U.S. stocks closed lower as Strait of Hormuz tensions lifted oil, Treasury yields and inflation concerns, while gold extended a strong weekly advance.
Fundamentals: U.S. equities ended modestly lower as failed negotiations over the Strait of Hormuz drove WTI crude to $81.78 and Brent to $87.72, raising inflation and yield concerns ahead of CPI data. The Dow fell 0.11%, while resilient earnings and AI spending offered support. Gold advanced as geopolitical risks, central-bank demand and ETF inflows underpinned metals.
Technicals: USO led ETF gains, while Nvidia, Apple and IBIT declined. S&P 500, Nasdaq, mid-cap, Russell 2000 and DAX futures remained broadly bullish across intermediate and long-term measures, with several markets testing pivot resistance after sharp recoveries. Dow futures showed a short-term pullback, while small caps consolidated near resistance despite constructive broader trend alignment.
After Market Close daily snapshot: market news summary and sentiment, major ETFs, Magnificent 7 analysis, Indices Futures Higher Time Frame Analysis, and E-mini S&P500, Nasdaq 100, NYMEX Crude, Gold Futures Daily Chart analysis.
As of: August 10, 2026 05:00 CT
Market News Summary:
Middle East oil-supply disruption and imminent U.S. inflation data drove a mixed-to-lower equity session, while gold extended its advance.
Primary Drivers & Risks:
- Primary Driver: Hormuz disruption lifts crude prices
- Primary Risk: Energy-driven inflation and yields
Tone:
Cautious, with geopolitical inflation pressure offsetting earnings optimism.
Stock Market / ETFs / Indices:
U.S. stocks finished lower as crude surged and uncertainty over the Strait of Hormuz intensified; the Dow fell 0.11% to 53,975.98. Equity support included robust earnings, broader earnings growth beyond large technology firms, AI-related spending, and a higher S&P 500 target from JPMorgan. Counterpoints included weak market breadth, short-term overbought signals, Apple weakness, and concern that AI investment has not lifted margins beyond the largest technology companies.
Geopolitical:
Iran’s refusal to reopen the Strait of Hormuz and reported demands around reopening the passage renewed disruption concerns. A reported Iranian missile attack on a UAE ship added to regional tensions. The U.S. extended a limited shipping-law waiver for 90 days to help maintain domestic oil flows amid the conflict.
Oil / Energy:
Crude rose sharply on failed Hormuz negotiations: WTI gained 4.6% to $81.78 a barrel and Brent rose about 5% to $87.72. The U.S. Strategic Petroleum Reserve fell below 300 million barrels, its lowest level since 1983. Higher oil prices lifted Treasury yields and increased inflation concerns.
Gold / Metals:
Gold recorded its strongest weekly gain in seven months, while gold ETFs attracted renewed momentum from lower yields, central-bank demand, and inflows. Gold, silver, and platinum advanced despite a stronger dollar and higher Treasury yields. Geopolitical fragmentation, debt, deficits, and central-bank purchases remained cited support for precious metals.
Fed / Financials:
Fed commentary emphasized a wait-and-see stance as softer July employment data conflicted with inflation signals. Wednesday’s CPI report was the immediate policy focus; prediction-market pricing placed less than a 55% chance of year-over-year CPI above 3.3%, versus a 3.4% consensus estimate. Rising oil and Treasury yields added pressure to the inflation outlook.
Macro / Other:
Global commodity traders and financial firms expanded into Brazil’s electricity market, citing price volatility and long-term growth despite financial distress among local participants. Consumer spending was reported as rising in the midday market update.
Conclusion:
Hormuz-related supply uncertainty pushed oil above $80 for WTI and near $88 for Brent, weighing on U.S. equities and lifting yields. CPI data and the Fed’s response remain central near-term macro focuses.
Solid earnings, broader participation outside large technology, and AI spending provided equity support. Weak breadth, elevated crude, reduced U.S. emergency oil inventories, and regional conflict remained the principal cross-currents.
Market News Sentiment
Market News Articles: 48
- Neutral: 50.00%
- Positive: 37.50%
- Negative: 12.50%
Sentiment Summary: Of 48 market news articles, 50% were neutral, 38% positive, and 13% negative, indicating broadly balanced coverage with a positive tilt.
Conclusion: Indices futures day traders are facing predominantly neutral news flow, with positive articles outnumbering negative articles.
GLD,Gold Articles: 9
- Positive: 66.67%
- Neutral: 22.22%
- Negative: 11.11%
Sentiment Summary: GLD/Gold coverage was predominantly positive at 67%, with 22% neutral and 11% negative across 9 articles.
Conclusion: Gold-related sentiment was positive overall, indicating a favorable tone in the sampled coverage.
USO,Oil Articles: 16
- Neutral: 37.50%
- Positive: 37.50%
- Negative: 25.00%
Sentiment Summary: USO/Oil coverage is balanced, with 38% positive, 38% neutral, and 25% negative sentiment across 16 articles.
Conclusion: Oil-related news tone is mixed to neutral, with positive and neutral coverage equally represented.
Market Data Snapshot
ETF Snapshot of major stock market ETFs, Mag7, and others as of: August 10, 2026 05:00
Top Movers & Losers
- USO 125.92 Bullish 6.73% ▲
- AMZN 278.09 Bullish 1.32% ▲
- MSFT 506.06 Bullish 1.21% ▲
- IBIT 36.23 Bearish -1.55% ▼
- AAPL 308.26 Bearish -1.62% ▼
- NVDA 217.55 Bearish -2.86% ▼
Major Index ETFs: SPY, QQQ, DIA, IWM, IJH
- SPY 773.03 Bearish -0.03% ▼
- DIA 538.99 Bearish -0.12% ▼
- QQQ 720.87 Bearish -0.30% ▼
- IJH 77.54 Bearish -0.32% ▼
- IWM 299.98 Bearish -0.52% ▼
Major index ETFs were Bearish across the board. IWM led the downside at -0.52%, followed by IJH at -0.32% and QQQ at -0.30%. DIA declined -0.12%, while SPY was the least negative mover and near-flat at -0.03%.
Mag 7 Stocks: AAPL, MSFT, GOOG, AMZN, META, NVDA, TSLA
- AMZN 278.09 Bullish 1.32% ▲
- MSFT 506.06 Bullish 1.21% ▲
- TSLA 330.88 Bullish 0.70% ▲
- GOOG 355.84 Bullish 0.67% ▲
- META 594.92 Bullish 0.48% ▲
- AAPL 308.26 Bearish -1.62% ▼
- NVDA 217.55 Bearish -2.86% ▼
Mixed: AMZN is the most bullish mover at +1.32%, followed by MSFT at +1.21%. TSLA, GOOG, and META are Bullish at +0.70%, +0.67%, and +0.48%. NVDA is the most bearish mover at -2.86%, while AAPL is Bearish at -1.62%.
Cross-Market ETFs: TLT, GLD, USO, IBIT
- USO 125.92 Bullish 6.73% ▲
- GLD 402.54 Bullish 1.02% ▲
- TLT 82.06 Bearish -0.85% ▼
- IBIT 36.23 Bearish -1.55% ▼
Mixed cross-market conditions: USO is the most bullish mover at +6.73%, while GLD is also Bullish at +1.02%. IBIT is the most bearish mover at -1.55%, with TLT Bearish at -0.85%.
ETF, Mag7, and Cross-Market ETF Insights
Overall Tone
Mixed: broad equity ETFs were modestly Bearish while several Mag7 names were Bullish, alongside strong commodity strength and Bearish bond and bitcoin ETFs.
Equity ETFs and Mag7:
Major Index ETFs were broadly but modestly Bearish: SPY was marginally lower at -0.03%, DIA at -0.12%, QQQ at -0.30%, IJH at -0.32%, and IWM led the downside at -0.52%. Mag7 performance was selective, led by AMZN at +1.32% and MSFT at +1.21%, while NVDA was the most bearish mover at -2.86% and AAPL declined -1.62%. Equity leadership was concentrated in several large-cap technology names rather than broadly aligned across index ETFs.
Cross-Market ETFs:
USO was the most bullish cross-market mover at +6.73%, while GLD also advanced +1.02%, contrasting with modestly Bearish equity ETFs. TLT fell -0.85% and IBIT was the most bearish cross-market mover at -1.55%, showing divergence between commodity strength and weakness in bonds and bitcoin.
Futures Indices – Higher Time Frame Analysis
Summary of the current state of US Indices Futures based on higher time-frame (HTF) technical analysis as of: 2026-08-10: 17:00 CT.
US Indices Futures
- ES YSFG/MSFG/WSFG above F0%, above rising benchmarks; 7802.25-7830.25 resistance, 7617.75/7472.25 pivot support; bullish pivots.
- NQ YSFG/MSFG/WSFG above F0%, above rising benchmarks; 30074 resistance, 30975.50-31090 upper band; 28809.50/27201 support; bullish pivots.
- YM YSFG/MSFG above F0%, WSFG below F0%; above rising intermediate/long benchmarks; 54884 resistance, 53462/52414 pivots; short-term pullback.
- EMD YSFG/MSFG/WSFG above F0%, above rising benchmarks; 3906.8-3908.0 resistance, 3789.8/3683.4 pivots; bullish structure despite TR120 short.
- RTY YSFG/MSFG above F0%, WSFG below F0%; above rising benchmarks; 3053.8-3068.4 resistance, 2962.7/2902.3 support; mixed short-term consolidation.
- FDAX YSFG/MSFG/WSFG above F0%, above rising benchmarks; 26527 resistance, 25859 pivot support; 25508/25301 benchmark support; bullish extension.
Overall State
- Short-Term: Bullish
- Intermediate-Term: Bullish
- Long-Term: Bullish
Conclusion
US index futures retain broadly aligned intermediate- and long-term bullish structures, supported by rising benchmark averages, higher-high/higher-low pivots, and primarily above-F0% YSFG and MSFG readings. ES, NQ, EMD, and FDAX are testing pivot-high resistance after fast recoveries. YM and RTY show weaker weekly Fib-grid positioning and consolidation beneath or near recent highs. Shared resistance is concentrated at current pivot highs, while listed pivot-reversal levels and benchmark clusters define structural support.
Note: Intra-day counter-trend pullbacks or retracements may occur, HTF is context for informational usage and market structure. Glossary: Session Fib Grids periods of YSFG:’Yearly’, MSFG:’Monthly’, WSFG:’Weekly’
For full details visit: AlphaWebTrader Technicals
ES Daily View
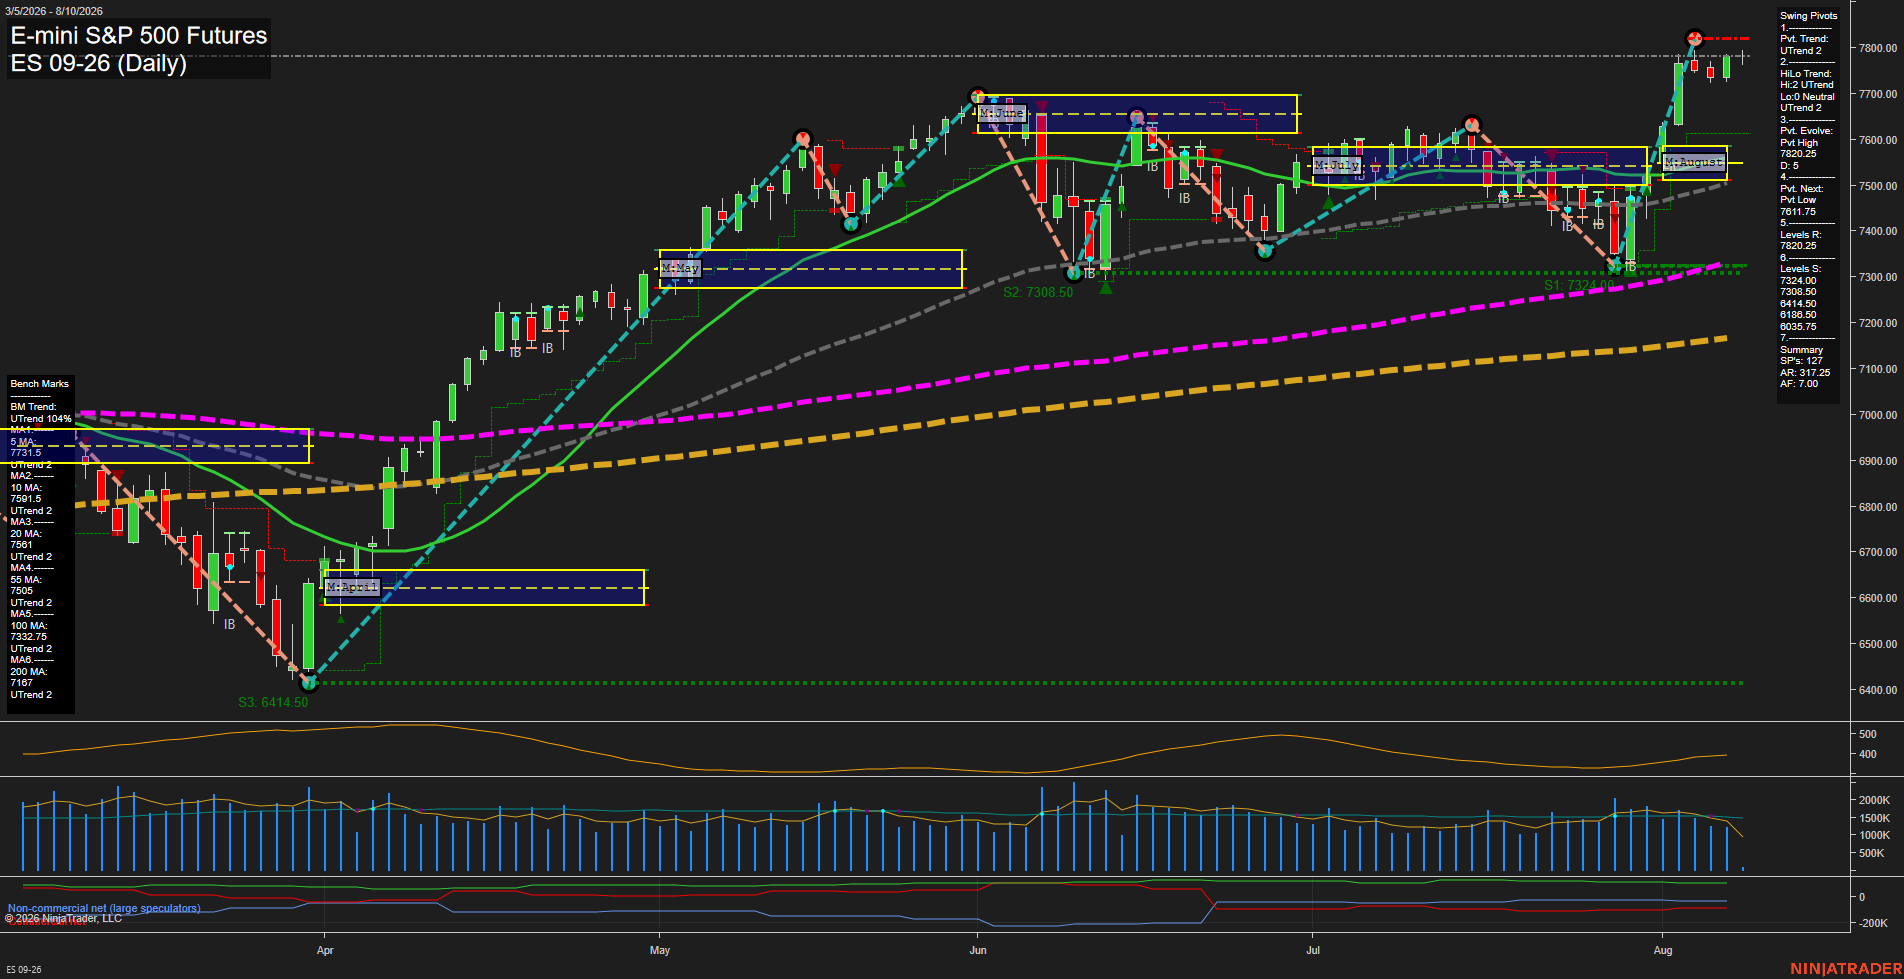
Overall Rating
- Short-Term: Bullish
- Intermediate-Term: Bullish
- Long-Term: Bullish.
Key Insights Summary
The daily swing structure is broadly bullish, with price extending from the early-August higher low into a fresh pivot-high test near 7802.25. Price is above all six rising benchmark averages, while weekly, monthly, and yearly Fib-grid biases remain above F0%, confirming alignment across the short-, intermediate-, and long-term trend layers. The recent advance has been fast and is pressing directly beneath pivot resistance, following a sharp V-shaped recovery from the late-July support area. Volume is broadly steady rather than expanding aggressively, while the next pivot reversal level at 7617.75 defines the nearby short-term structural line separating continuation from a deeper retracement.
View charts on: AlphaWebTrader HTF Charts
NQ Daily View
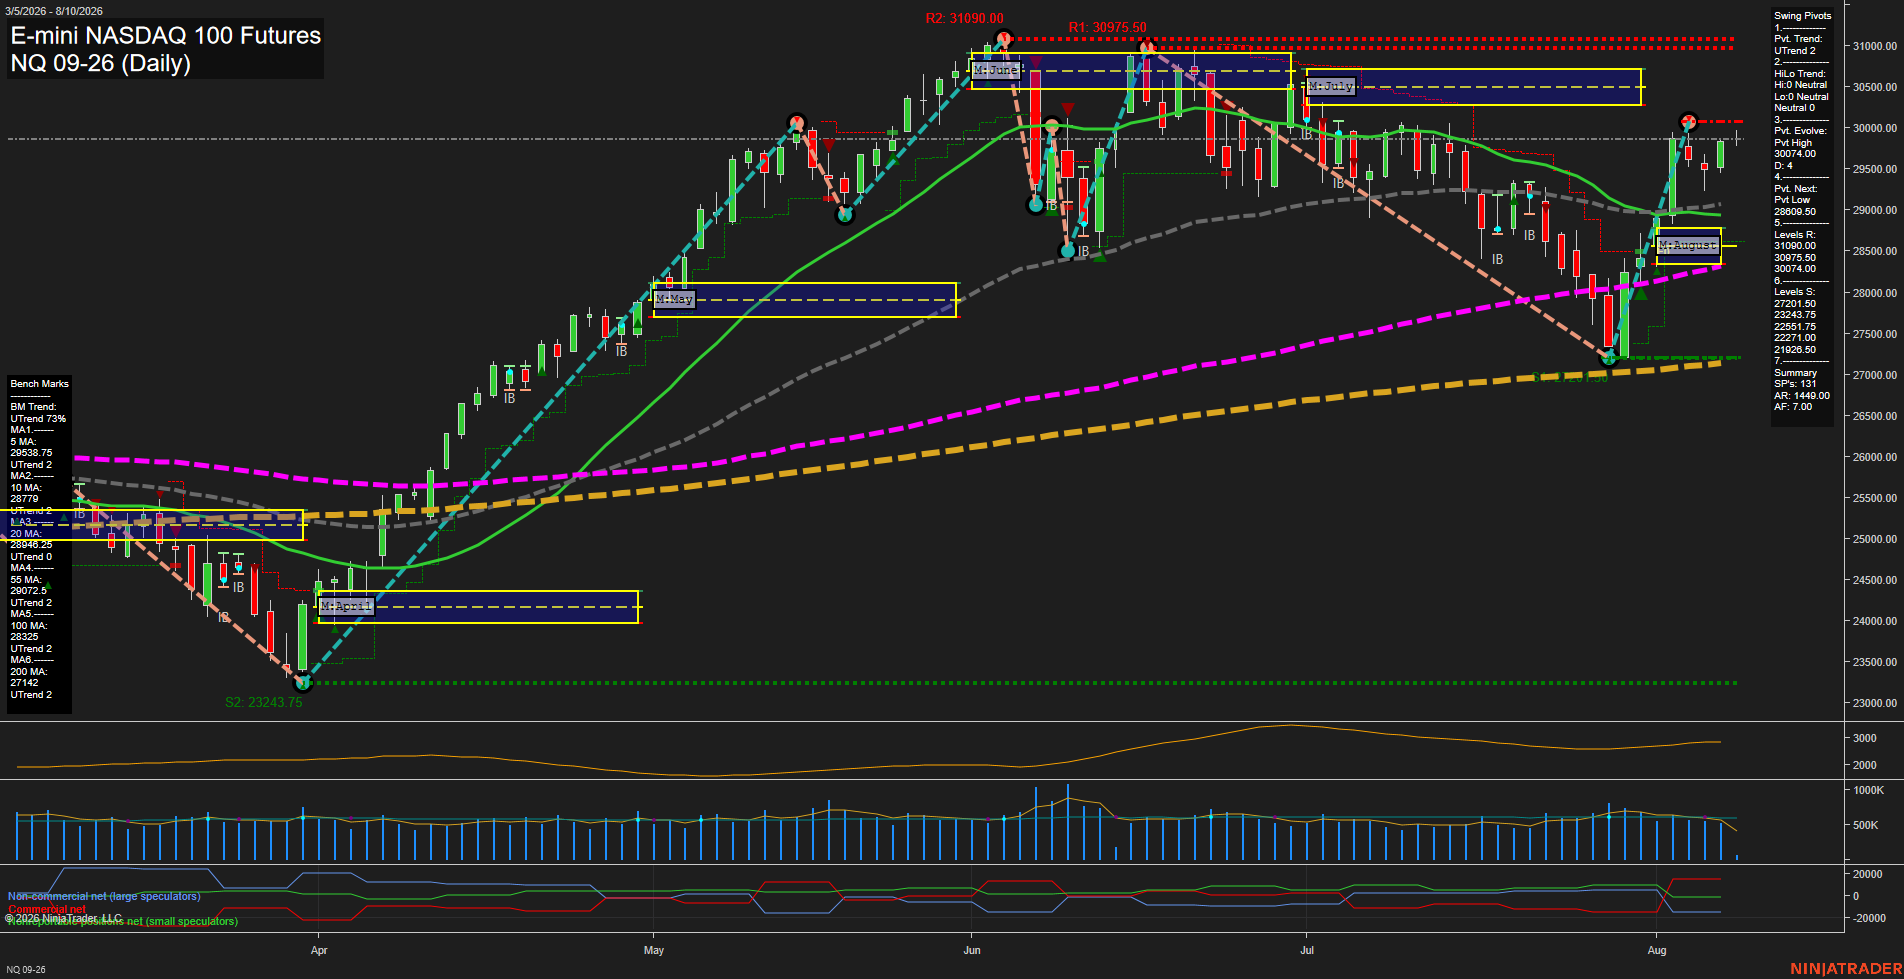
Overall Rating
- Short-Term: Bullish
- Intermediate-Term: Bullish
- Long-Term: Bullish.
Key Insights Summary
Price has produced a strong V-recovery from the late-July swing low near 27201.50 and is now consolidating just above 30000. The short-term pivot trend is up, price is above all benchmark averages, and the weekly, monthly, and yearly fib-grid structures remain positive. The 30074 pivot-high area is the immediate inflection level, while 30975.50 and 31090 define the higher resistance cluster. The intermediate pivot structure remains neutral following the sharp recovery, although rising 20-day and 55-day benchmarks and price above the August MSFG support the broader bullish continuation theme. The 28809.50 pivot-low reversal level is the principal nearby structural support beneath the current advance.
View charts on: AlphaWebTrader HTF Charts
CL Daily View
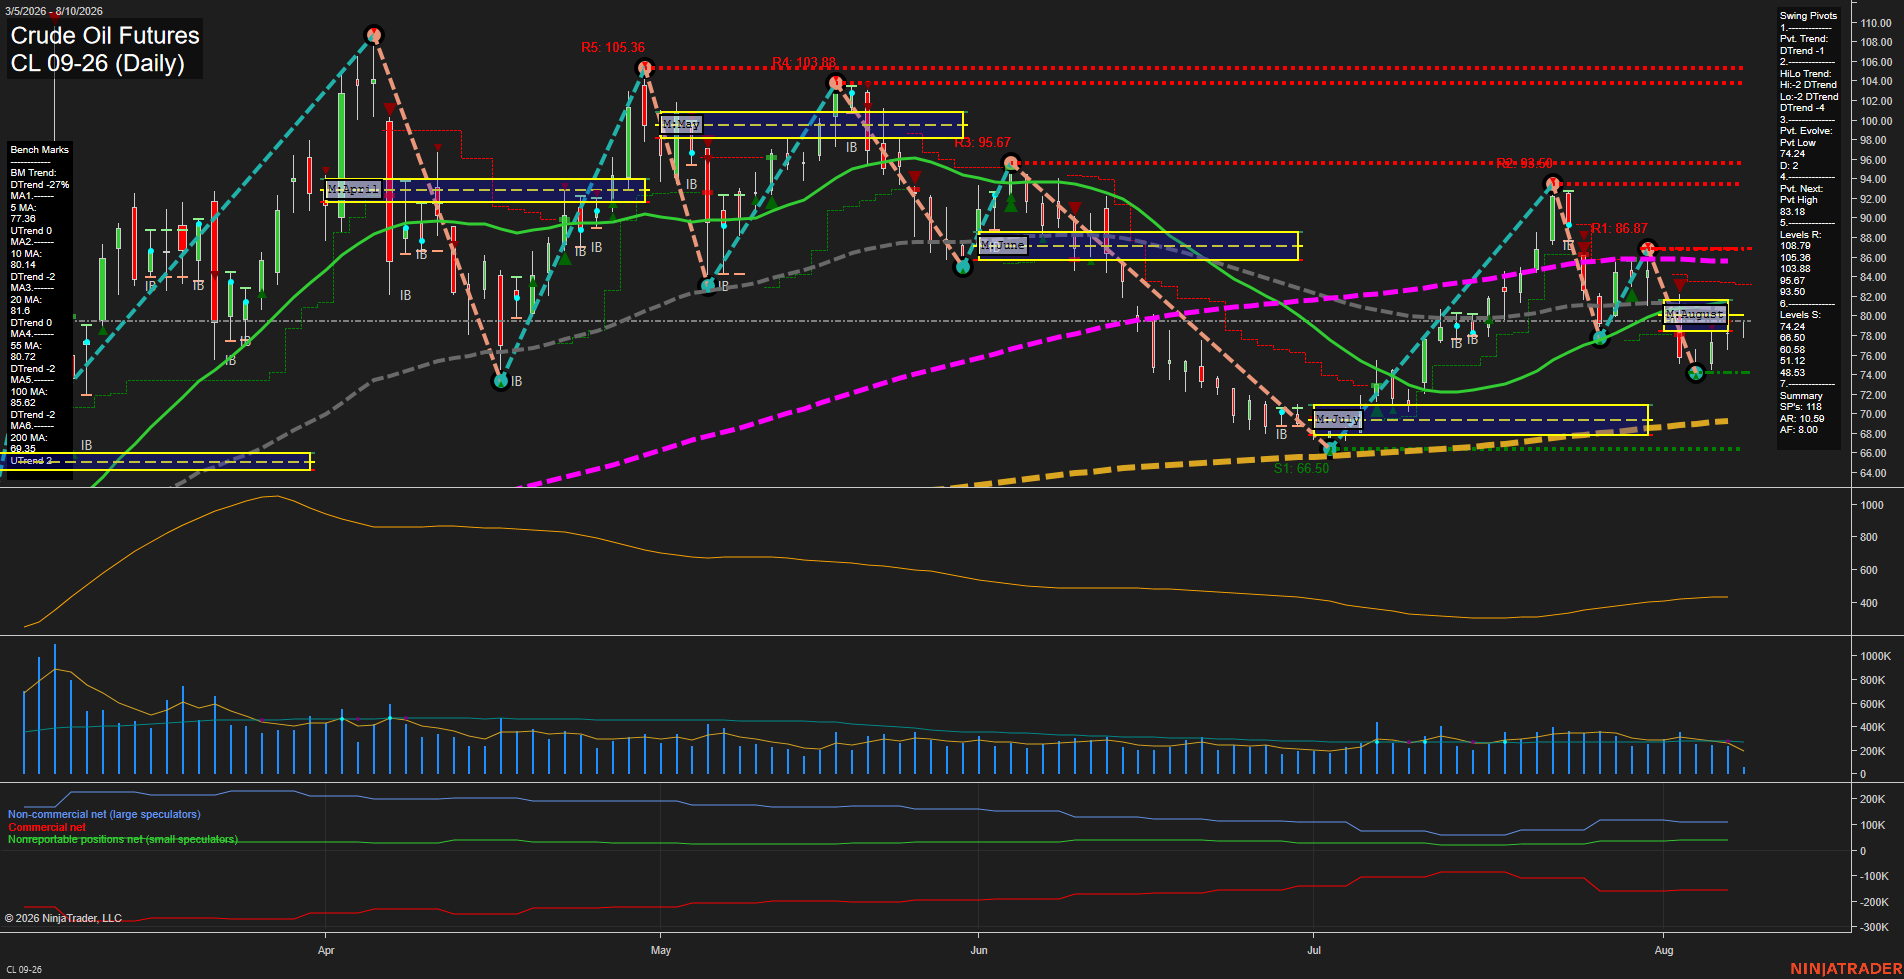
Overall Rating
- Short-Term: Bearish
- Intermediate-Term: Bearish
- Long-Term: Bullish.
Key Insights Summary
CL is rebounding from the 74.24 swing-low pivot and is marginally above the weekly F0% area, but the short-term pivot structure remains in a DTrend with 83.18 defining the next swing-high reversal threshold. Price is beneath the 10, 20, 55, and 100-day benchmarks, reflecting a counter-trend bounce within a broader intermediate decline. The August MSFG remains below F0%, while the longer-term yearly grid and rising 100-day and 200-day benchmarks preserve the larger bullish structure. The market is currently compressed between the 74.24 support pivot and the nearby 80.72 to 81.60 benchmark cluster, with 86.87 and 93.50 representing higher resistance areas.
View charts on: AlphaWebTrader HTF Charts
GC Daily View
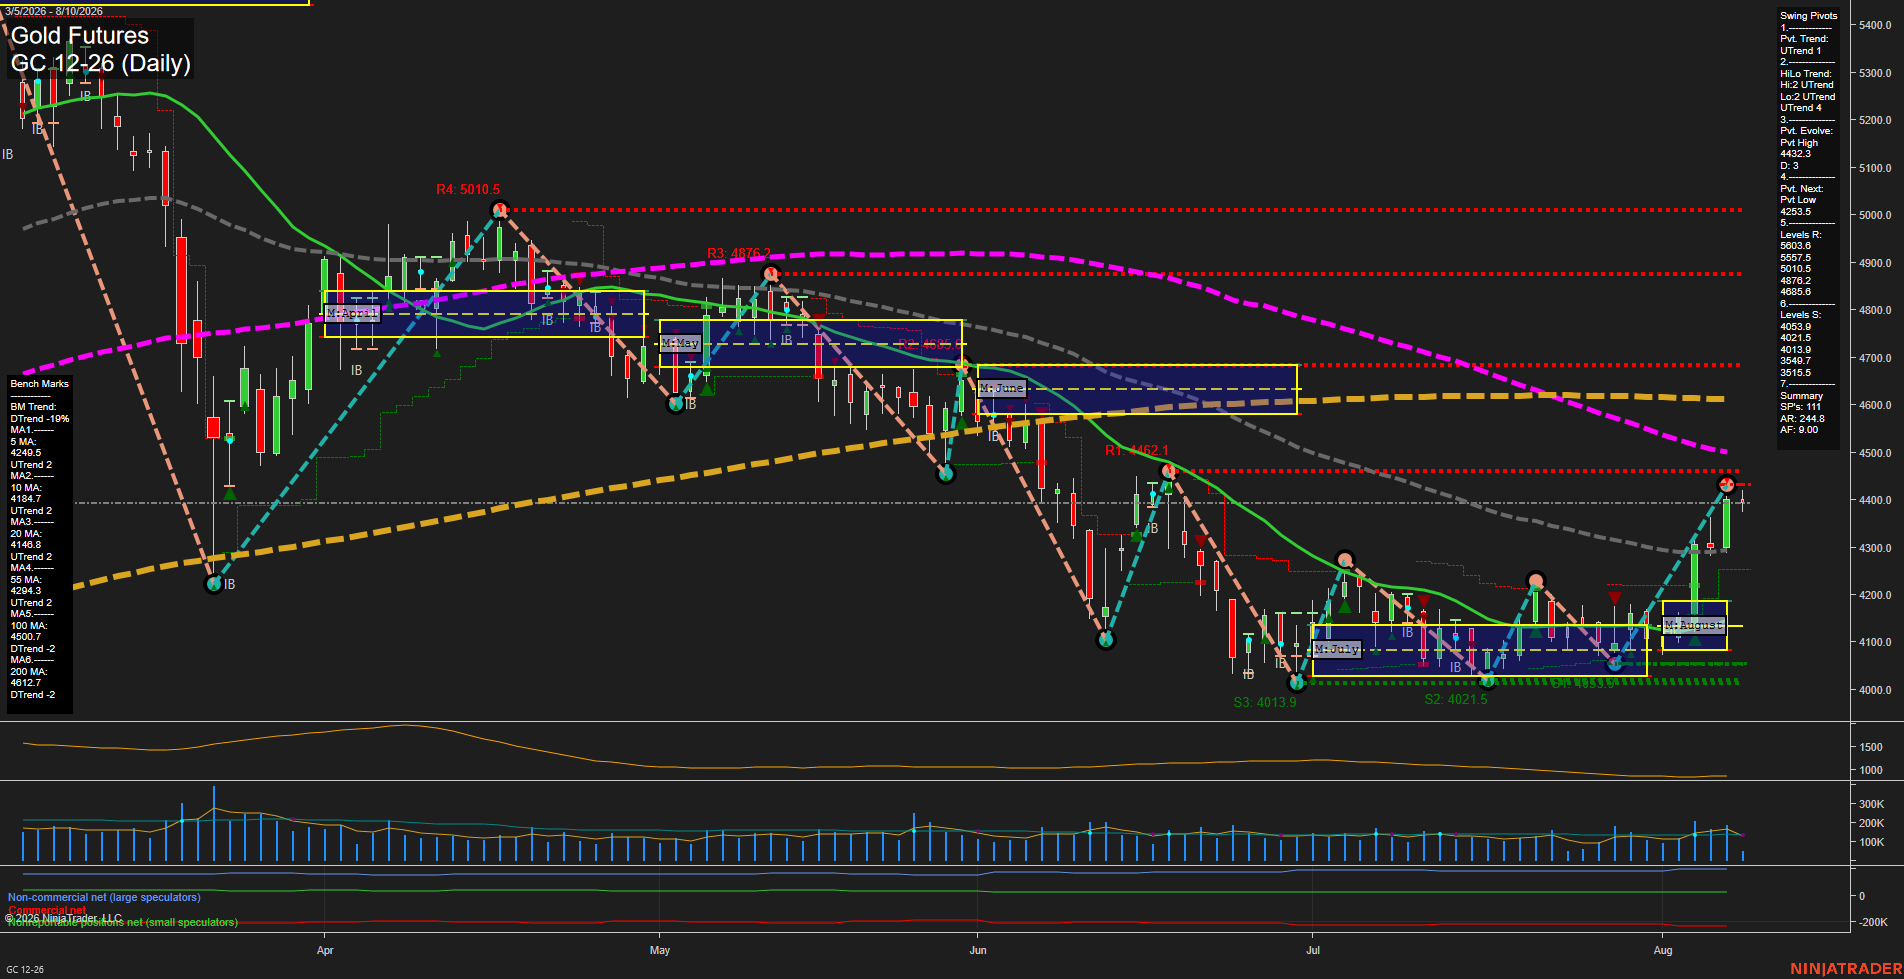
Overall Rating
- Short-Term: Bullish
- Intermediate-Term: Bullish
- Long-Term: Bearish.
Key Insights Summary
GC has produced a sharp V-style recovery from the early-August 4,000 area, reclaiming the 5-, 10-, 20-, and 55-day benchmarks while establishing an UTrend in both the short-term pivot and intermediate HiLo structures. The rally is approaching the 4432.3 evolving pivot high, with 4685.6 the next major overhead pivot resistance. Weekly fib positioning remains marginally below F0%, creating a countertrend element within the stronger monthly upswing. Long-term structure remains bearish because price is still below declining 100- and 200-day benchmarks and the yearly grid remains below F0%; the current advance therefore represents a high-momentum recovery inside a broader long-term decline.
View charts on: AlphaWebTrader HTF Charts