NYSE pre-market radar shows ETF laggards and mixed futures across ES, NQ, YM, EMD, RTY and FDAX as rate expectations, Asia weakness and oil headlines weigh.
Fundamentals: Equity futures are under pressure as strong U.S. jobs data lifts rate-hike expectations, Asia weakens, and Middle East tensions keep energy markets in focus. Crude is firmer on supply-risk headlines, gold is softer on hawkish Fed pricing, and sector moves remain uneven with AI-linked stocks, semis, and index changes adding support in parts of the market.
Technicals: Prior-session ETF leaders and laggards show broad weakness in major names, while futures analysis points to mixed conditions across weekly and daily time frames. ES, NQ, YM, EMD, RTY and FDAX each show a different blend of short-term pullbacks, longer-term trend support and resistance zones, with several markets still holding constructive higher-timeframe structures despite near-term reversals.
Pre-Market Trading 360° view Market Radar of: holidays, earnings, eco-news, market-news summary, news sentiment, prior session major ETFs, MAG7, Higher Time Frame Analysis Indices Futures Summary, and E-mini S&P500, Nasdaq 100, NYMEX Crude, Gold Futures Daily Chart analysis.
As of: June 8, 2026 07:16 CT
Earnings Radar
Monitoring for earnings releases by the Magnificent 7, AI-tech-related firms, and major financial institutions.
- ADBE Release: 2026-06-11 T:AMC
- ORCL Release: 2026-06-10 T:AMC
Conclusion: With ORCL on 2026-06-10 AMC and ADBE on 2026-06-11 AMC, index futures enter a software-heavy earnings window with broad tech/index relevance; market momentum and volume can slow ahead of major earnings releases, especially major tech names.
For full details visit: Yahoo Earnings Calendar
EcoNews Radar U.S. Events
| Day | Time | Impact | Event |
|---|---|---|---|
| Wed | 08:30 | High | Core CPI m/m |
| Wed | 08:30 | High | Core CPI y/y |
| Wed | 08:30 | High | CPI m/m |
| Wed | 08:30 | High | CPI y/y |
| Wed | 10:30 | Low | Crude Oil Inventories |
| Thu | 08:30 | High | Core PPI m/m |
| Thu | 08:30 | High | PPI m/m |
| Thu | 08:30 | Medium | Unemployment Claims |
| Fri | 10:00 | Medium | Prelim UoM Consumer Sentiment |
| Fri | 10:00 | Medium | Prelim UoM Inflation Expectations |
EcoNews Summary
Wednesday carries the week’s highest market focus with back-to-back U.S. inflation releases at 08:30, followed by crude oil inventories at 10:30. Thursday adds more inflation input through PPI at 08:30, alongside unemployment claims. Friday closes with UoM sentiment and inflation expectations at 10:00. The strongest market attention centers on inflation data, which often drives index futures volatility through rate-path and growth repricing.
Event Notes:
- Wednesday 08:30 High USD Core CPI m/m: Measures the month-over-month change in consumer prices excluding food and energy; traders monitor it for underlying inflation pressure and its influence on interest-rate expectations.
- Wednesday 08:30 High USD Core CPI y/y: Measures the year-over-year change in consumer prices excluding food and energy; traders watch it for the trend in core inflation and policy implications.
- Wednesday 08:30 High USD CPI m/m: Measures the monthly change in consumer prices across the full basket; traders monitor it as a broad inflation gauge and a major driver of volatility.
- Wednesday 08:30 High USD CPI y/y: Measures the annual pace of consumer inflation; traders follow it for confirmation of inflation trends and market repricing around rates.
- Wednesday 10:30 Low USD Crude Oil Inventories: Measures the weekly change in U.S. commercial crude stocks; traders watch it for signals on supply-demand balance and its impact on energy prices.
- Thursday 08:30 High USD Core PPI m/m: Measures the monthly change in producer prices excluding food and energy; traders monitor it for pipeline inflation pressure that can feed into later consumer inflation readings.
- Thursday 08:30 High USD PPI m/m: Measures the monthly change in producer-level prices; traders track it for wholesale inflation trends and broader pricing pressure.
- Thursday 08:30 Medium USD Unemployment Claims: Measures new filings for jobless benefits; traders use it as a timely labor-market indicator tied to growth and policy expectations.
- Friday 10:00 Medium USD Prelim UoM Consumer Sentiment: Measures household confidence in current and future economic conditions; traders watch it for demand and growth sentiment.
- Friday 10:00 Medium USD Prelim UoM Inflation Expectations: Measures consumer expectations for inflation over the coming period; traders monitor it for inflation psychology and rate sensitivity.
Conclusion:
The single most important event of the week is Wednesday 08:30, the U.S. CPI and Core CPI releases. This block is the main catalyst for index futures as inflation data directly affects interest-rate expectations and risk pricing. Market momentum and volume often slow ahead of major events such as CPI, with increased volatility at release time. News events around the 10 AM time cycle act as catalysts for reversals or continuations, making Wednesday’s 10:30 crude oil inventories release a secondary focus for energy-related market impact. High oil prices directly affect markets through inflation and geopolitical concerns.
For full details visit: Forex Factory EcoNews
Market News Summary:
Equity futures are reacting to firmer rate-hike pricing, weaker risk appetite in Asia, and renewed Middle East energy shocks.
Primary Drivers & Risks:
- Primary Driver: Strong jobs, higher rate pricing
- Primary Risk: Geopolitical oil shock, volatility
Tone:
Risk-off, with broad cross-asset pressure and sharp sector rotation.
Stock Market / ETFs / Indices:
Asian equities and U.S.-linked futures show strain after a sharp KOSPI drop, a Nasdaq and SOX selloff, and a jump in the VIX. Citigroup raised its S&P 500 target on AI-led earnings strength, while Marvell surged on S&P 500 inclusion and ETF news highlighted AI, shipping, and cannabis leadership versus weak bonds, gold miners, and crypto.
Geopolitical:
Iran-Israel tensions remain a central cross-current, with news of strikes, a truce holding in some reports, and market focus on conflict-related disruption. The war is also lifting jet fuel costs and reshaping sector performance across regions.
Oil / Energy:
Crude futures are firmer on supply-risk headlines, tight inventories, and conflict escalation. Saudi Arabia cut July OSPs to Asia on softer demand, while China’s reduced imports have helped keep Brent below $100.
Gold / Metals:
Gold and silver remain under pressure after strong U.S. labor data and rising Fed hike expectations. Reports point to key support breaks, a steep gold selloff, and continued lag in gold miners.
Fed / Financials:
Stronger U.S. jobs data pushed rate-cut hopes lower and lifted expectations for a more hawkish Fed path. Asian currencies were mixed against the dollar, and Powell commentary renewed focus on central-bank independence.
Macro / Other:
German factory orders fell back in April, and China’s e-commerce exporters face higher costs and weaker demand tied to the war. Japan’s growth print came in softer than the first estimate, while software valuations and select dividend-growth names drew positive attention.
Conclusion:
Primary pressure comes from firmer Fed tightening expectations, weak risk appetite, and the latest Middle East energy headlines. Those factors are feeding into indices through higher volatility, weaker semis, and softer sentiment across Asia and Europe.
Secondary inputs include mixed support from AI-linked equities, selective ETF strength, and corporate/index-specific catalysts such as Marvell’s S&P 500 addition. Oil strength, gold weakness, and softer German and Chinese data add cross-currents that keep tape action uneven.
Market News Sentiment
Market News Articles: 29
- Negative: 48.28%
- Positive: 27.59%
- Neutral: 24.14%
Sentiment Summary: Market news sentiment is mostly negative, with 48% negative articles, 28% positive articles, and 24% neutral articles across 29 reports.
Conclusion: The news flow is weighted toward negative tone, with negative coverage exceeding positive and neutral coverage combined in relative emphasis.
GLD,Gold Articles: 6
- Negative: 83.33%
- Positive: 16.67%
Sentiment Summary: GLD/Gold articles were predominantly negative, with 83% negative sentiment and 17% positive sentiment across 6 articles.
Conclusion: The snapshot shows a negative tone in gold-related coverage, which is the primary sentiment signal in this data.
USO,Oil Articles: 11
- Positive: 54.55%
- Negative: 36.36%
- Neutral: 9.09%
Sentiment Summary: Oil-related news is moderately positive, with 55% positive, 36% negative, and 9% neutral coverage across 11 articles.
Conclusion: The article mix shows a positive bias in oil sentiment, with a meaningful negative share still present.
Market Data Snapshot
ETF Snapshot of major stock market ETFs, Mag7, and others as of: June 8, 2026 07:16
Top Movers & Losers
- TLT 85.06 Bearish -0.51% ▼
- GOOG 365.76 Bearish -0.95% ▼
- AAPL 307.34 Bearish -1.25% ▼
- META 593.00 Bearish -5.51% ▼
- NVDA 205.10 Bearish -6.20% ▼
- TSLA 391.00 Bearish -6.56% ▼
Major Index ETFs: SPY, QQQ, DIA, IWM, IJH
- DIA 509.70 Bearish -1.35% ▼
- IJH 73.95 Bearish -2.00% ▼
- SPY 737.55 Bearish -2.58% ▼
- IWM 281.65 Bearish -3.55% ▼
- QQQ 705.06 Bearish -4.80% ▼
Mixed-to-Bearish tone across the index ETF set, with all five instruments lower. DIA was the least negative mover at -1.35%, followed by IJH at -2.00%, SPY at -2.58%, and IWM at -3.55%, while QQQ was the most bearish mover at -4.80%.
Mag 7 Stocks: AAPL, MSFT, GOOG, AMZN, META, NVDA, TSLA
- GOOG 365.76 Bearish -0.95% ▼
- AAPL 307.34 Bearish -1.25% ▼
- MSFT 416.67 Bearish -2.66% ▼
- AMZN 246.03 Bearish -3.06% ▼
- META 593.00 Bearish -5.51% ▼
- NVDA 205.10 Bearish -6.20% ▼
- TSLA 391.00 Bearish -6.56% ▼
Mag7 sentiment is Bearish overall, with GOOG the least negative mover at -0.95% and TSLA the most bearish mover at -6.56%; the group is broadly lower across AAPL -1.25%, MSFT -2.66%, AMZN -3.06%, META -5.51%, and NVDA -6.20%.
Cross-Market ETFs: TLT, GLD, USO, IBIT
- TLT 85.06 Bearish -0.51% ▼
- USO 133.02 Bearish -2.72% ▼
- GLD 396.24 Bearish -3.65% ▼
- IBIT 34.14 Bearish -5.22% ▼
Bearish cross-market tone led by IBIT at -5.22% as the most bearish mover, while TLT was the least negative mover at -0.51%; USO fell -2.72% and GLD dropped -3.65%, reinforcing broad downside across the group.
ETF, Mag7, and Cross-Market ETF Insights
Overall Tone
Bearish and risk-off across the board, with negative moves in every tracked group and no broad area showing relative strength.
Equity ETFs and Mag7:
Major Index ETFs were uniformly weaker, led lower by QQQ -4.80% and IWM -3.55%, while DIA was the least negative index ETF at -1.35%. Mag7 also showed clear downside leadership, with TSLA the most bearish mover at -6.56% and NVDA close behind at -6.20%; GOOG was the least negative Mag7 name at -0.95%. Equity action is broadly aligned to the downside rather than selective strength.
Cross-Market ETFs:
Cross-market ETFs also leaned bearish, with TLT the least negative at -0.51%, while IBIT was the most bearish at -5.22%. GLD -3.65% and USO -2.72% both declined, reinforcing a weaker cross-asset tone rather than a clear hedge or commodity bid. The group is broadly consistent with the equity selloff and does not show offsetting strength.
Futures Indices – Higher Time Frame Analysis
Summary of the current state of US Indices Futures based on higher time-frame (HTF) technical analysis as of: 2026-06-08: 07:16 CT.
US Indices Futures
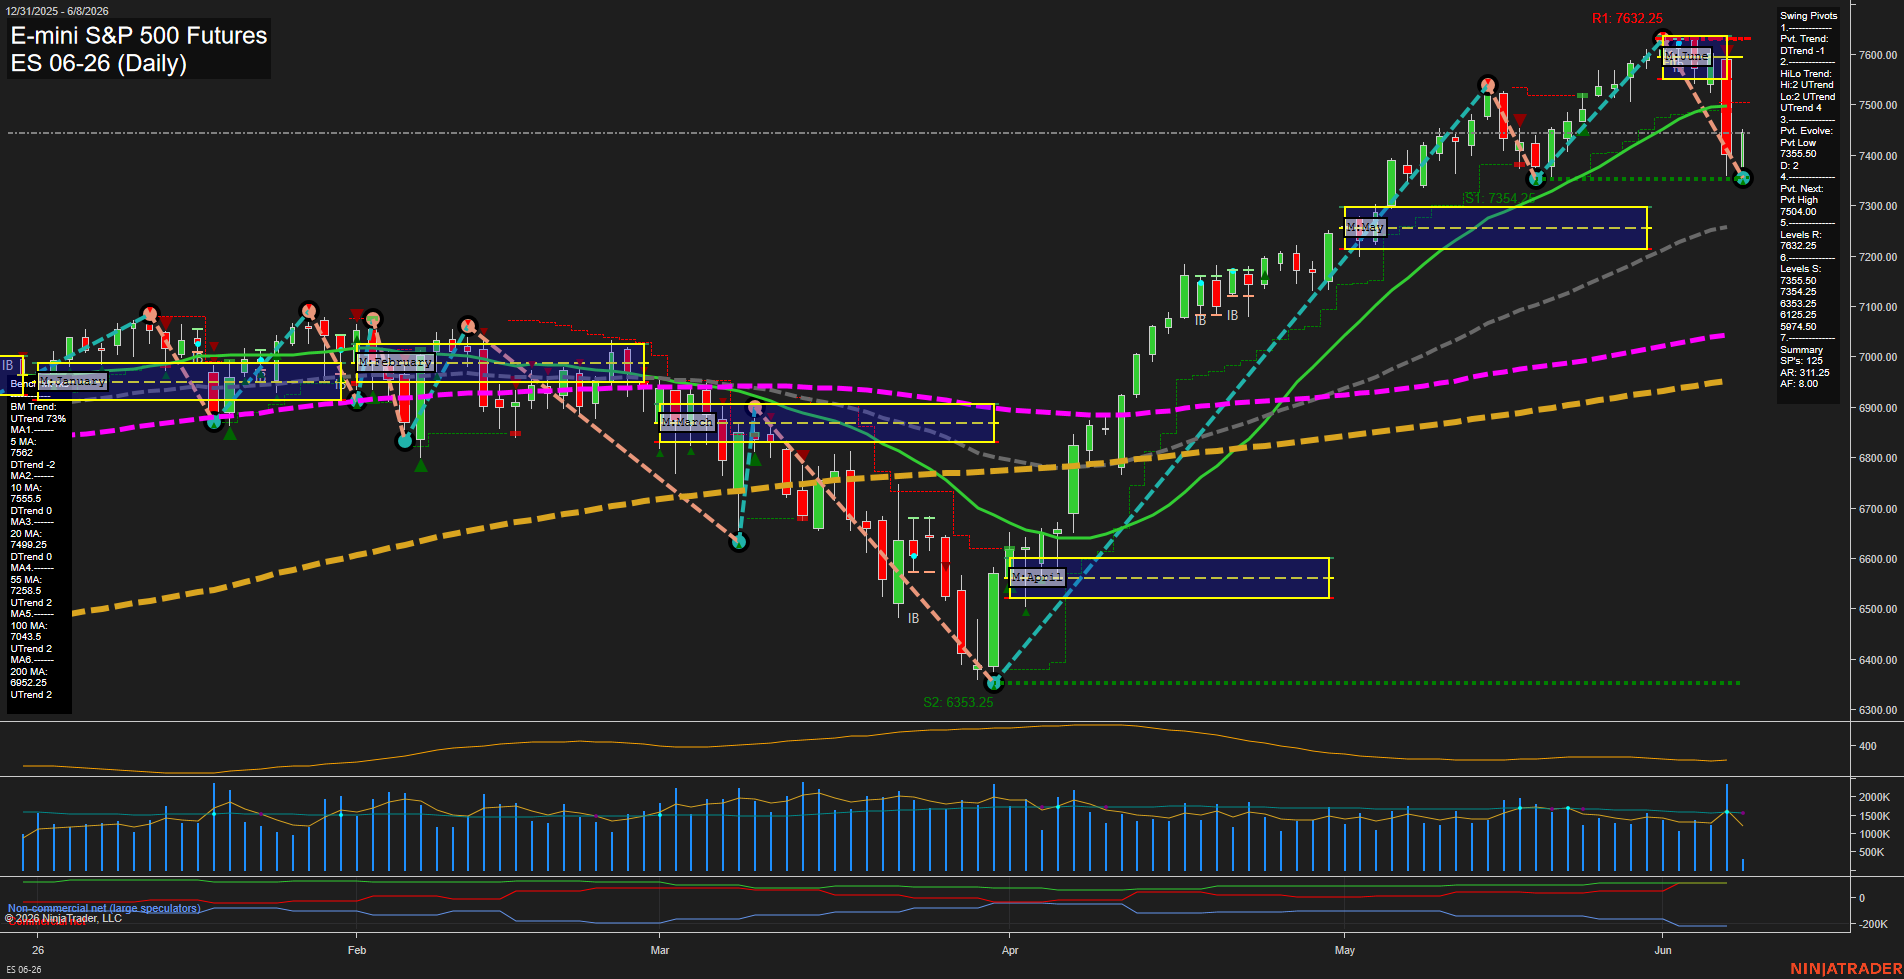
- ES Weekly bullish, daily corrective; YSFG above midline, MSFG below F0%, WSFG above F0%; benchmarks bullish stack; pivots near 7632.25, 7355 support.
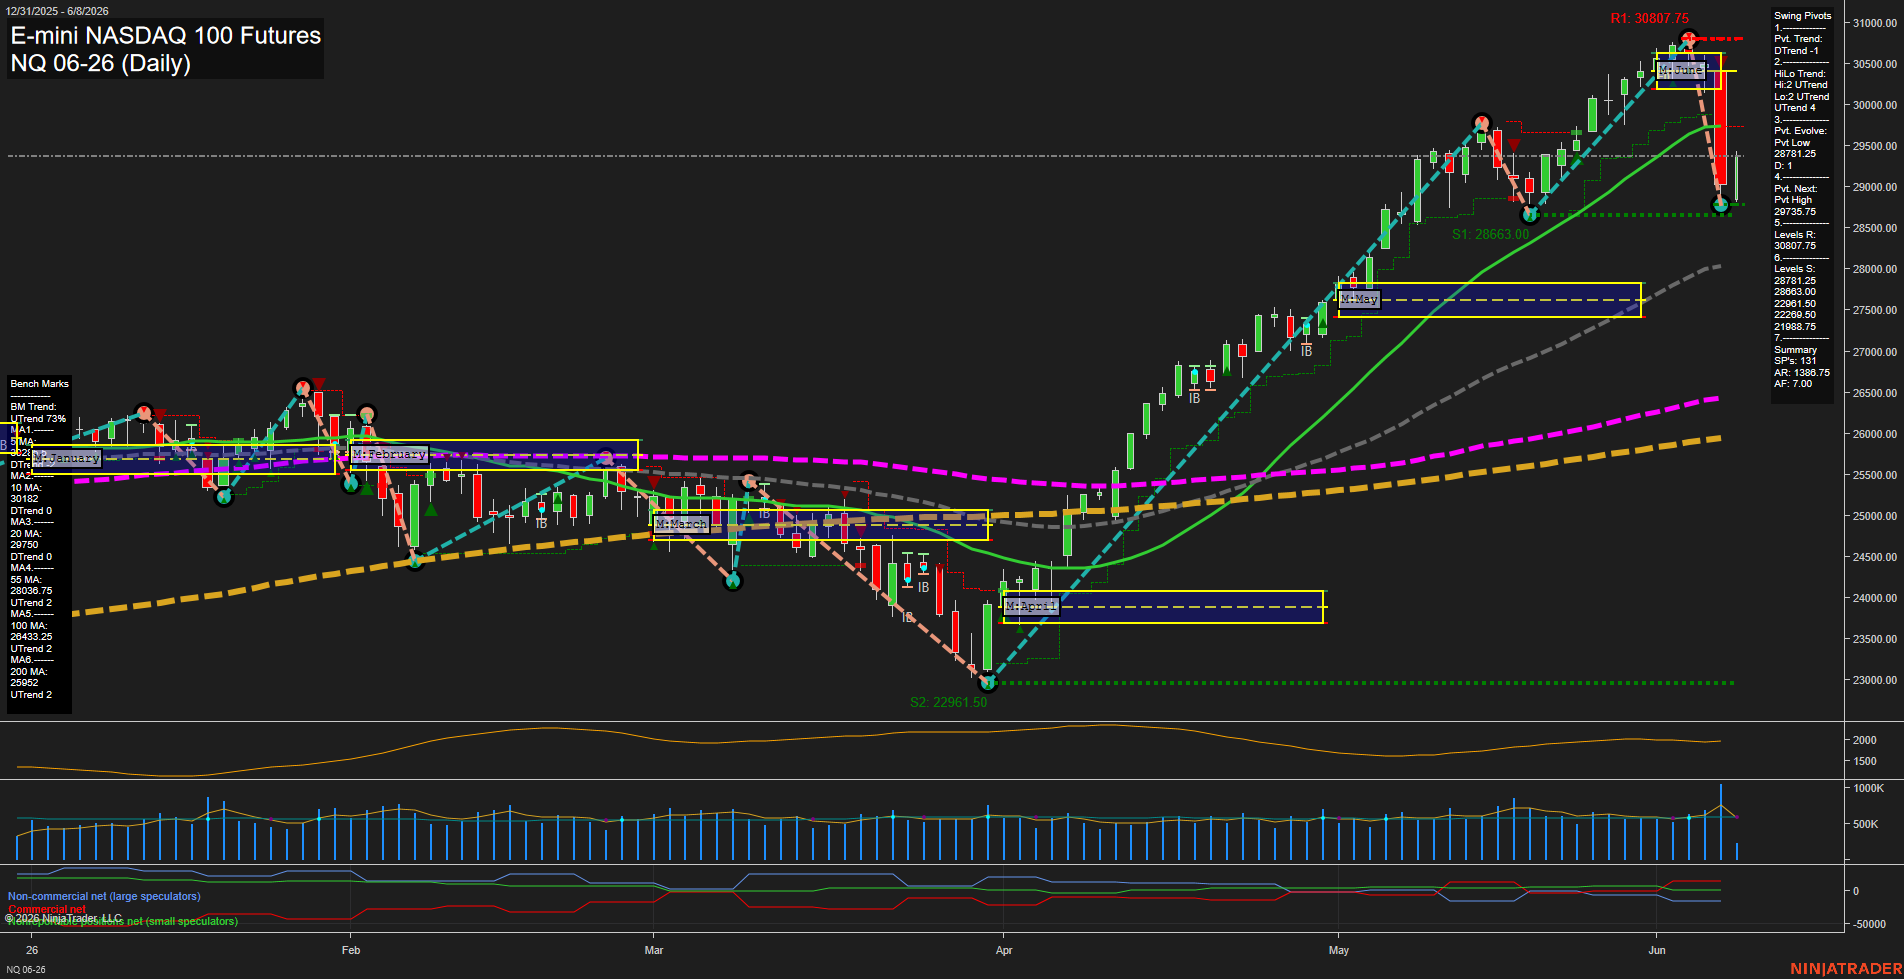
- NQ Weekly bullish, daily corrective; YSFG above midline, MSFG below F0%, WSFG above midpoint; benchmarks rising; pivots 30393/30151 resistance, upper-28k support zone.
- YM Weekly bullish, daily corrective; YSFG above midline, MSFG below F0%, WSFG above NTZ; benchmarks rising across 20-200D; pivots 51849 resistance, 50624 support.
- EMD Weekly bullish, daily corrective; YSFG above midpoint, MSFG below midpoint, WSFG above midpoint; benchmarks rising across 20-200D; pivots 3782.1 resistance, 3671.7 support.
- RTY Weekly bullish, daily corrective; YSFG above midline, MSFG below F0%, WSFG above F0%; benchmarks mostly rising; pivots 2952 resistance, 2807.7 support.
- FDAX Weekly rebound, daily mixed; YSFG and MSFG below F0%, WSFG above F0%; benchmarks rising but choppy; pivots 25854 resistance, 24356/23874 support.
Overall State
- Short-Term: Bullish
- Intermediate-Term: Neutral
- Long-Term: Bullish
Conclusion
HTF structure is broadly bullish across ES, NQ, YM, EMD, and RTY, with weekly YSFG and WSFG generally above midpoint or F0% and major benchmarks aligned higher. Daily charts show corrective pullbacks from recent highs, with MSFG for several contracts still below F0%, limiting intermediate alignment. FDAX remains the main outlier, with session grids below F0% on monthly and yearly frames despite a weekly rebound. Overall correlations remain trend-aligned on the weekly and long-term grids, while daily swings are in retracement or consolidation phases against higher-timeframe uptrends.
Note: Intra-day counter-trend pullbacks or retracements may occur, HTF is context for informational usage and market structure. Glossary: Session Fib Grids periods of YSFG:’Yearly’, MSFG:’Monthly’, WSFG:’Weekly’
For full details visit: AlphaWebTrader Technicals
ES Daily View
Overall Rating
- Short-Term: Bearish
- Intermediate-Term: Bearish
- Long-Term: Bullish.
Key Insights Summary
ES is showing a sharp daily reversal off the recent 7632.25 resistance area after a strong multi-month advance, with the latest candle pressing back into the lower edge of the June monthly fib grid and into the 7355 area. Short-term structure has rolled over, with the current pivot trend down and price losing the near-term benchmark cluster, while the intermediate picture remains mixed-to-heavy as the pullback works through the monthly decline zone. The higher-timeframe trend stays constructive because price remains well above the 55, 100, and 200 day benchmarks, and the yearly session fib remains above its midpoint bias, so the larger trend backdrop is still upward even as the chart is in a correction phase.
View charts on: AlphaWebTrader HTF Charts
NQ Daily View
Overall Rating
- Short-Term: Bearish
- Intermediate-Term: Bearish
- Long-Term: Bullish.
Key Insights Summary
The chart shows a powerful multi-month advance that culminated in a sharp rejection from the 30.8k area, followed by a fast selloff back toward the upper-28k zone. Short-term structure has flipped to DTrend, with the latest pivot evolving into a lower-high / lower-low sequence and price losing the near-term benchmark stack. Intermediate-term remains mixed to weaker because June MSFG is below F0% and the monthly fib bias is down, while the market is also working through a fast retracement after an extended rally. Long-term trend remains constructive because the 55-, 100-, and 200-day benchmarks are still aligned upward, keeping the broader uptrend intact despite the near-term break in momentum.
View charts on: AlphaWebTrader HTF Charts
CL Daily View
Overall Rating
- Short-Term: Bearish
- Intermediate-Term: Bullish
- Long-Term: Bullish.
Key Insights Summary
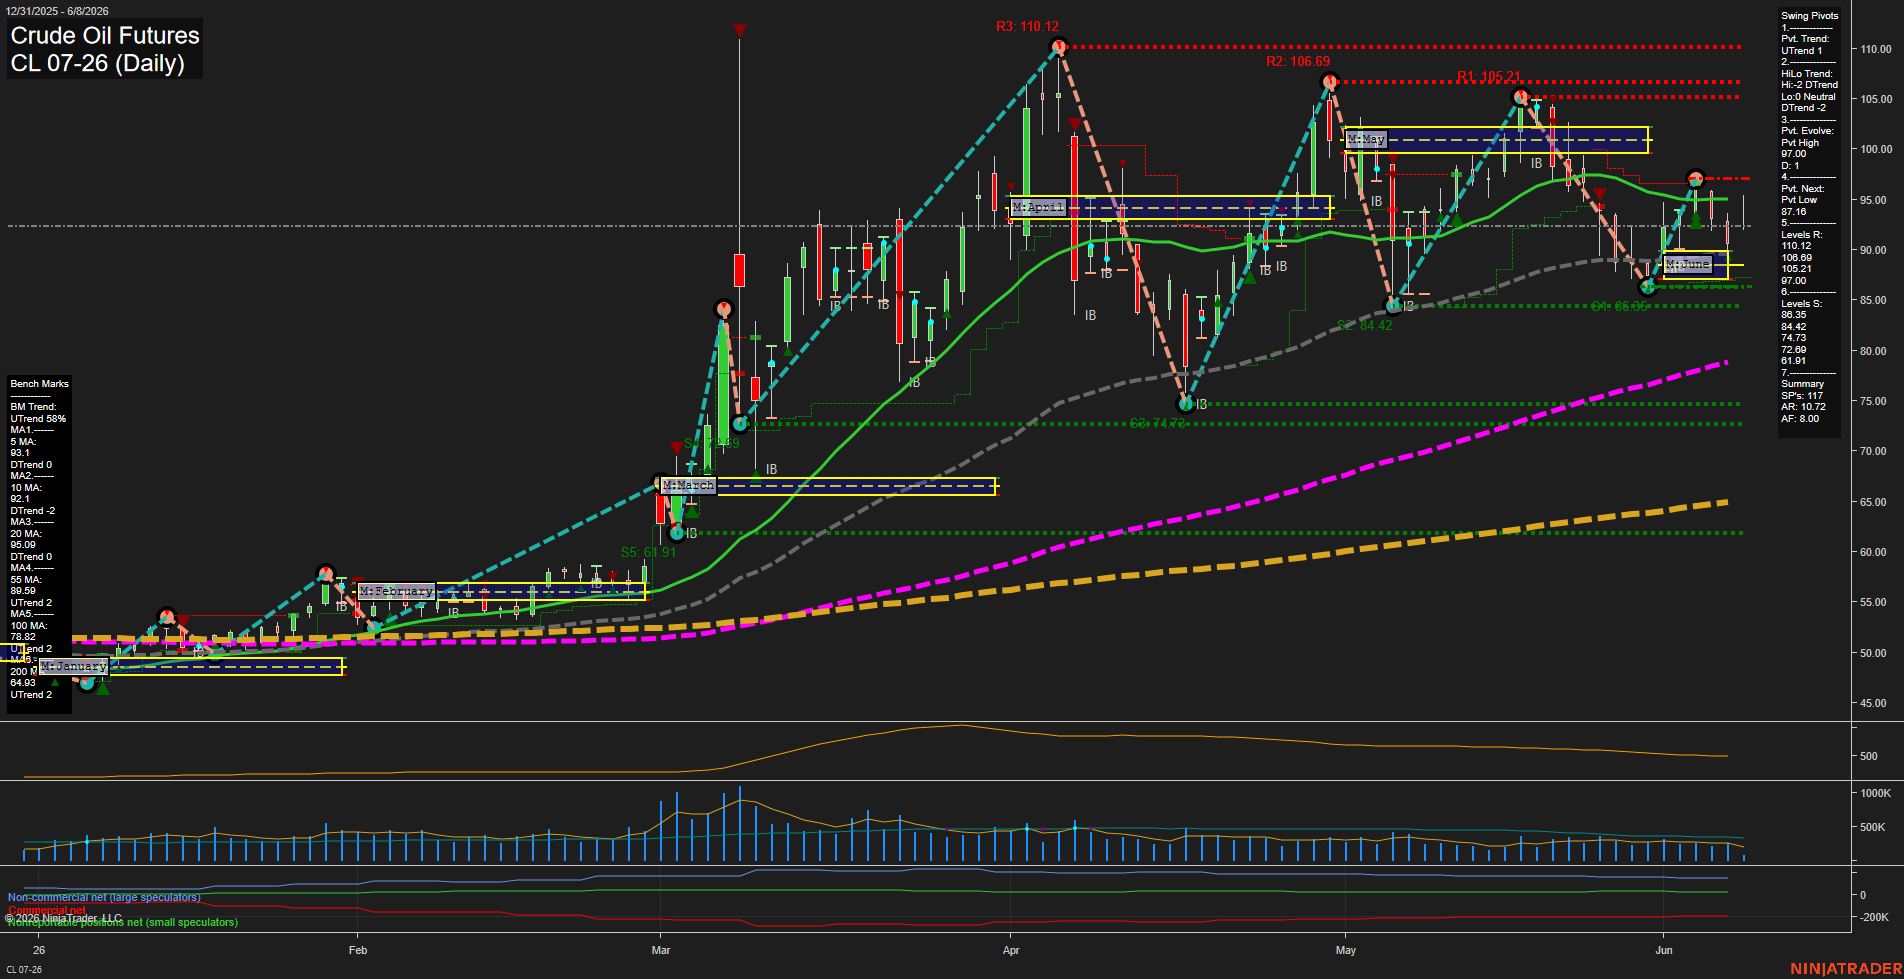
Crude oil remains in a larger year-long uptrend, with the 2026 YSFG holding firmly above the F0%/NTZ zone and the major 55/100/200-day benchmarks still aligned higher. Near term, however, the daily structure is softer: price is trading below the weekly fib bias, below the 20-day benchmark, and sits under the most recent pivot resistance cluster, leaving the short-term profile choppy to bearish. The swing pivot map still shows an active UTrend, but the HiLo pivot trend has rolled to DTrend, reflecting a transition phase after the sharp May rally and subsequent pullback. The market is working through a retracement inside a broader advance, with the key feature being whether price can stabilize above the 90s zone and rebuild toward the 97 area and higher resistance bands.
View charts on: AlphaWebTrader HTF Charts
GC Daily View
Overall Rating
- Short-Term: Bearish
- Intermediate-Term: Bearish
- Long-Term: Bearish.
Key Insights Summary
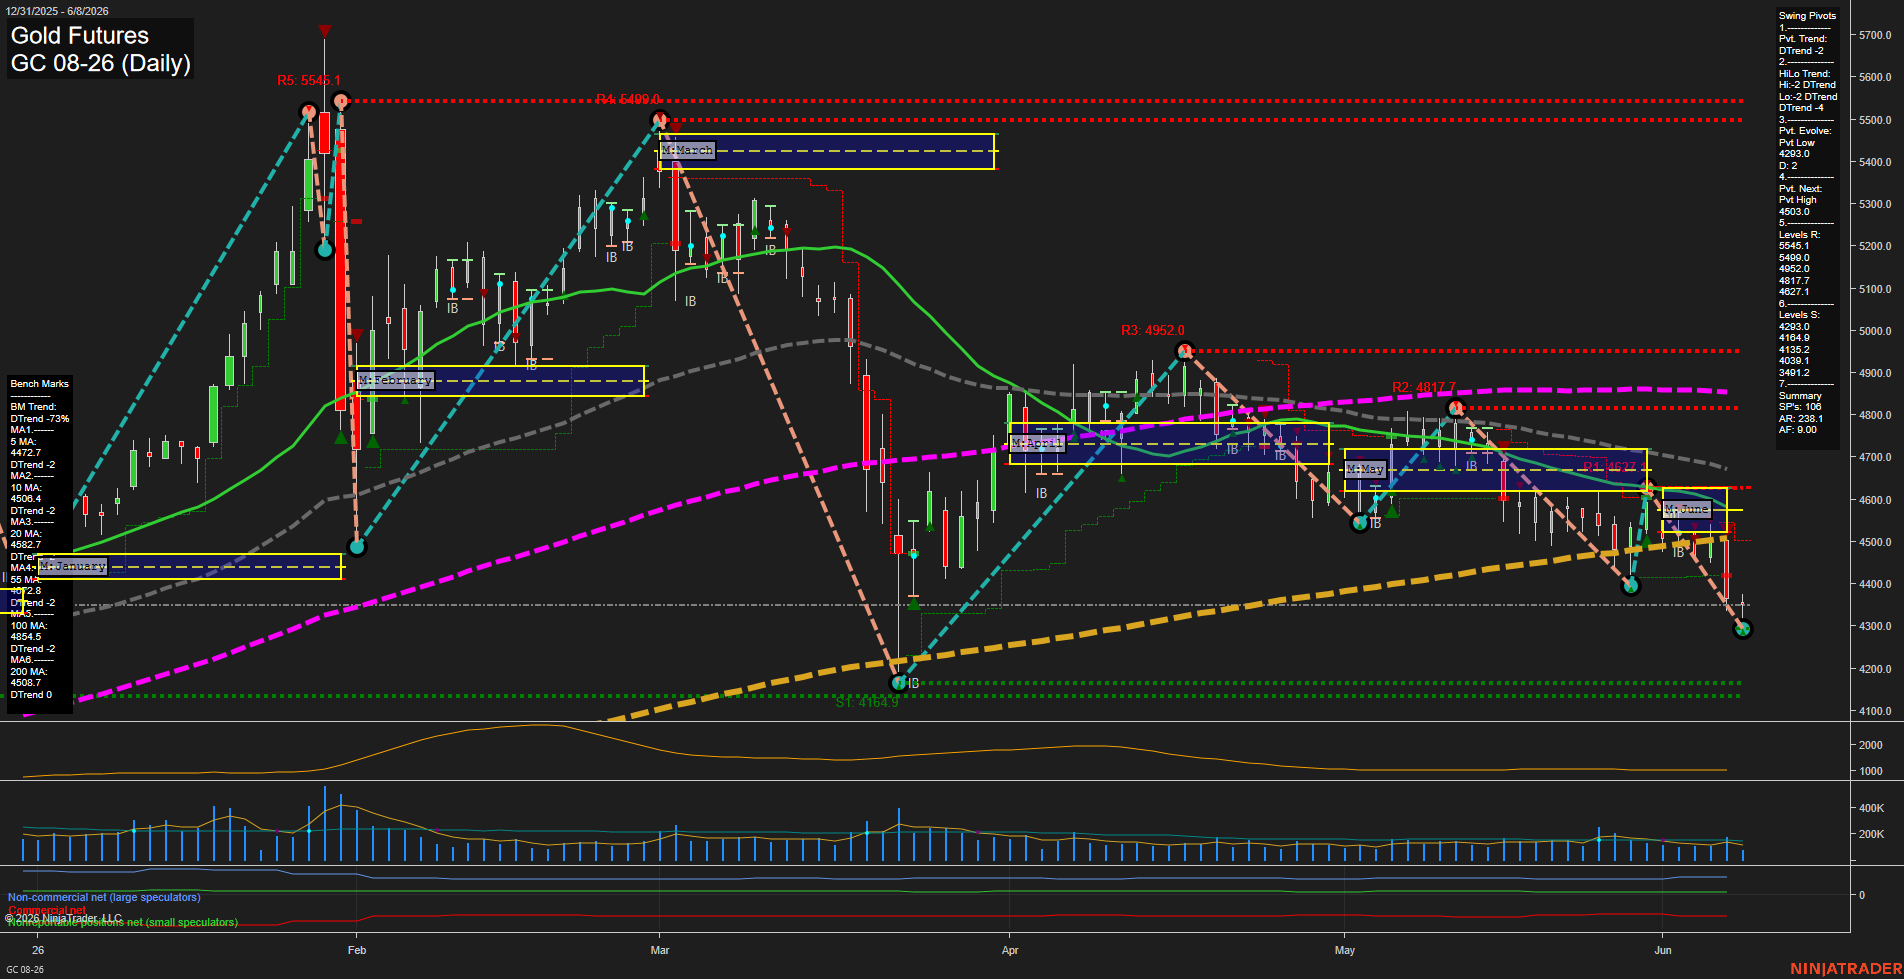
Gold futures are in a decisive downside swing with the daily structure aligned bearish across the short, intermediate, and long horizons. Price is pressing beneath all major daily benchmarks, with the 5, 10, 20, 55, and 100 day averages all trending lower and overhead, reinforcing a persistent trend-down profile. The swing pivot framework also remains in DTrend, with the next upside pivot reference still well above current trade, while nearby support has already been tested and broken into the low 4300s. The weekly fib structure still shows a positive short-term bias above its F0%/NTZ, but the monthly and yearly fib grids remain below their centers, keeping the broader backdrop weak. Recent sell signals from WSFG, TR120, and MSFG confirm downside continuation after repeated rejection from the mid-4400s and lower-4500s zone, leaving the tape in a bearish continuation phase with elevated momentum and expansion in daily range.
View charts on: AlphaWebTrader HTF Charts