NYSE pre-market radar highlights ETF movers, futures trends and oil near $90 as Big Tech earnings and Strait of Hormuz risks shape markets.
Fundamentals: U.S. index futures advanced as investors focused on a heavy week of Big Tech earnings, while Brent crude eased from an intraday move above $90 but remained near that level. Escalating U.S.-Iran hostilities and reduced Strait of Hormuz tanker traffic kept energy supply risks elevated, reinforcing inflation and higher-for-longer rate concerns.
Technicals: USO and GLD led prior-session ETF gains, while NVDA, TSLA and META declined. S&P 500 futures retain bullish daily and longer-term structures amid consolidation below recent highs. Nasdaq futures remain in a sharper short-term retracement, while Dow, Russell 2000, Eurodollar, DAX and other contracts show mixed near-term momentum within broadly constructive long-term trends.
Pre-Market Trading 360° view Market Radar of: holidays, earnings, eco-news, market-news summary, news sentiment, prior session major ETFs, MAG7, Higher Time Frame Analysis Indices Futures Summary, and E-mini S&P500, Nasdaq 100, NYMEX Crude, Gold Futures Daily Chart analysis.
As of: July 20, 2026 07:16 CT
Earnings Radar
Monitoring for earnings releases by the Magnificent 7, AI-tech-related firms, and major financial institutions.
- INTC Release: 2026-07-23 T:AMC
- GOOGL Release: 2026-07-22 T:AMC
- IBM Release: 2026-07-22 T:BMO
- TSLA Release: 2026-07-22 T:AMC
Conclusion: Index futures face concentrated tech earnings risk on July 22, with IBM before the open and GOOGL and TSLA after the close, followed by INTC after the close on July 23. These releases center market attention on MAG7, AI, semiconductor, enterprise-tech, consumer-tech, and autos-related index components; market momentum and volume can slow ahead of these major earnings releases.
For full details visit: Yahoo Earnings Calendar
EcoNews Radar U.S. Events
| Day | Time | Impact | Event |
|---|---|---|---|
| Wed | 10:30 | Low | Crude Oil Inventories |
| Thu | 08:30 | Medium | Unemployment Claims |
EcoNews Summary
No qualifying high-impact EcoNews events are listed. The scheduled crude oil inventories release is directly relevant to energy prices, petroleum supply conditions, inflation sensitivity, and oil-linked market sectors.
Event Notes:
- Wednesday 10:30 – USD Crude Oil Inventories: Reports the weekly change in U.S. commercial crude oil stockpiles. Traders monitor inventory builds or draws as indicators of petroleum supply-demand conditions and potential pressure on energy prices.
Conclusion:
The single most important event of the week is Wednesday’s 10:30 USD Crude Oil Inventories release. As a 10 AM time-cycle catalyst, it is relevant for market reversals or continuations around the release. High oil prices directly affect markets through inflation and geopolitical concerns.
For full details visit: Forex Factory EcoNews
Market News Summary:
Index futures strengthened ahead of major technology earnings, while the U.S.-Iran conflict lifted oil and intensified inflation and risk-appetite concerns.
Primary Drivers & Risks:
- Primary Driver: Big Tech earnings and oil retreat
- Primary Risk: Hormuz disruptions lift energy inflation
Tone:
Cautiously constructive for equities, with elevated geopolitical and inflation pressure.
Stock Market / ETFs / Indices:
U.S. futures moved higher, with Dow futures up 0.2%, S&P 500 futures up 0.3%, and Nasdaq-100 futures up 0.7% as attention shifted to a heavy week of Big Tech results. The rebound followed a difficult week for semiconductor shares, while elevated S&P 500 earnings assumptions and technology valuation concerns remained a cross-current.
Geopolitical:
U.S.-Iran hostilities intensified, with attacks affecting vessels and energy infrastructure near the Strait of Hormuz. Tanker traffic through the waterway remained low, while Iran also signaled openness to mediation proposals.
Oil / Energy:
Brent briefly exceeded $90 per barrel before easing near $88-$90 as supply-disruption concerns grew. Reduced Hormuz traffic, risks to refined-product shipments, a Kuwait facility attack, and suspended Caspian Pipeline Consortium loadings added to supply concerns; U.S. gasoline prices returned above $4 per gallon.
Gold / Metals:
Gold and silver remained under pressure as higher-for-longer rate expectations supported the dollar and Treasury yields. Higher oil prices added inflation concerns while precious metals traded near technical support.
Fed / Financials:
Higher energy prices complicated the inflation backdrop for the Federal Reserve. Higher-for-longer rate expectations boosted the dollar and yields, weighing on gold and tightening broader financial conditions.
Macro / Other:
Asian currencies consolidated but faced pressure from higher oil prices and weaker risk appetite. China’s June marine fuel exports rose 55% from May, reaching their highest level of 2026.
Conclusion:
Futures gains were led by positioning ahead of Big Tech earnings and an easing from oil’s intraday peak. Oil remained the principal macro catalyst as Brent traded near $90.
Escalating Middle East conflict and constrained Hormuz traffic sustained supply concerns. Energy-driven inflation pressure, higher rate expectations, technology valuation concerns, and softer risk appetite remained key cross-currents.
Market News Sentiment
Market News Articles: 19
- Negative: 36.84%
- Neutral: 31.58%
- Positive: 31.58%
Sentiment Summary: Market news sentiment is mixed, with 37% negative, 32% neutral, and 32% positive articles across 19 reports.
Conclusion: Negative coverage holds a narrow lead, indicating a slightly cautious news tone for indices futures day traders.
GLD,Gold Articles: 4
- Negative: 75.00%
- Positive: 25.00%
Sentiment Summary: Gold-related coverage is predominantly negative, with 75% negative and 25% positive articles across four items.
Conclusion: The gold news tone is negative overall, indicating risk-focused sentiment in related market coverage.
USO,Oil Articles: 12
- Negative: 41.67%
- Positive: 33.33%
- Neutral: 25.00%
Sentiment Summary: USO/Oil coverage is mixed to slightly negative, with 42% negative, 33% positive, and 25% neutral articles.
Conclusion: For indices futures day traders, oil-related news tone presents a modest negative bias but remains broadly mixed.
Market Data Snapshot
ETF Snapshot of major stock market ETFs, Mag7, and others as of: July 20, 2026 07:16
Top Movers & Losers
- USO 123.96 Bullish 3.91% ▲
- GLD 368.41 Bullish 0.95% ▲
- TLT 84.52 Bullish 0.37% ▲
- NVDA 202.81 Bearish -2.21% ▼
- TSLA 380.84 Bearish -2.61% ▼
- META 646.01 Bearish -2.79% ▼
Major Index ETFs: SPY, QQQ, DIA, IWM, IJH
- IWM 294.04 Bearish -0.52% ▼
- IJH 75.54 Bearish -0.59% ▼
- DIA 520.81 Bearish -0.77% ▼
- SPY 743.29 Bearish -0.99% ▼
- QQQ 695.33 Bearish -1.50% ▼
Major Index ETFs were uniformly Bearish: QQQ led losses at -1.50%, followed by SPY at -0.99% and DIA at -0.77%. IJH declined -0.59%, while IWM was the least negative mover at -0.52%.
Mag 7 Stocks: AAPL, MSFT, GOOG, AMZN, META, NVDA, TSLA
- AAPL 333.74 Bullish 0.14% ▲
- AMZN 247.23 Bearish -1.06% ▼
- MSFT 393.82 Bearish -1.81% ▼
- GOOG 346.12 Bearish -2.17% ▼
- NVDA 202.81 Bearish -2.21% ▼
- TSLA 380.84 Bearish -2.61% ▼
- META 646.01 Bearish -2.79% ▼
Mag7 is Bearish overall: six components are lower, led by META at -2.79%, followed by TSLA at -2.61%, NVDA at -2.21%, and GOOG at -2.17%. AAPL is the most bullish mover but remains marginal at +0.14%; AMZN is the least negative mover at -1.06%.
Cross-Market ETFs: TLT, GLD, USO, IBIT
- USO 123.96 Bullish 3.91% ▲
- GLD 368.41 Bullish 0.95% ▲
- TLT 84.52 Bullish 0.37% ▲
- IBIT 36.35 Bearish -0.11% ▼
Cross-market tone is Bullish: USO is the most bullish mover at +3.91%, while GLD rises +0.95% and TLT adds +0.37%. IBIT is the most bearish mover, marginally lower at -0.11%.
ETF, Mag7, and Cross-Market ETF Insights
Overall Tone
Mixed conditions: equity ETFs and Mag7 are Bearish, while strength in oil, gold, and Treasuries reflects a risk-off cross-market backdrop.
Equity ETFs and Mag7:
Major Index ETFs are broadly Bearish, led lower by QQQ at -1.50%, while IWM is the least negative mover at -0.52%; SPY fell -0.99%, DIA -0.77%, and IJH -0.59%. Mag7 action is also Bearish and weaker than the broad equity ETFs, with AAPL marginally Bullish at +0.14% while META is the most bearish mover at -2.79%. TSLA declined -2.61%, NVDA -2.21%, GOOG -2.17%, MSFT -1.81%, and AMZN -1.06%, showing selective leadership only in AAPL.
Cross-Market ETFs:
Cross-market ETFs are Mixed, with USO the most bullish mover at +3.91%, while GLD gained +0.95% and TLT rose +0.37%. IBIT is marginally Bearish at -0.11%, making it the most bearish cross-market mover. Oil strength alongside gains in gold and Treasuries diverges from the Bearish equity backdrop.
Futures Indices – Higher Time Frame Analysis
Summary of the current state of US Indices Futures based on higher time-frame (HTF) technical analysis as of: 2026-07-20: 07:16 CT.
US Indices Futures
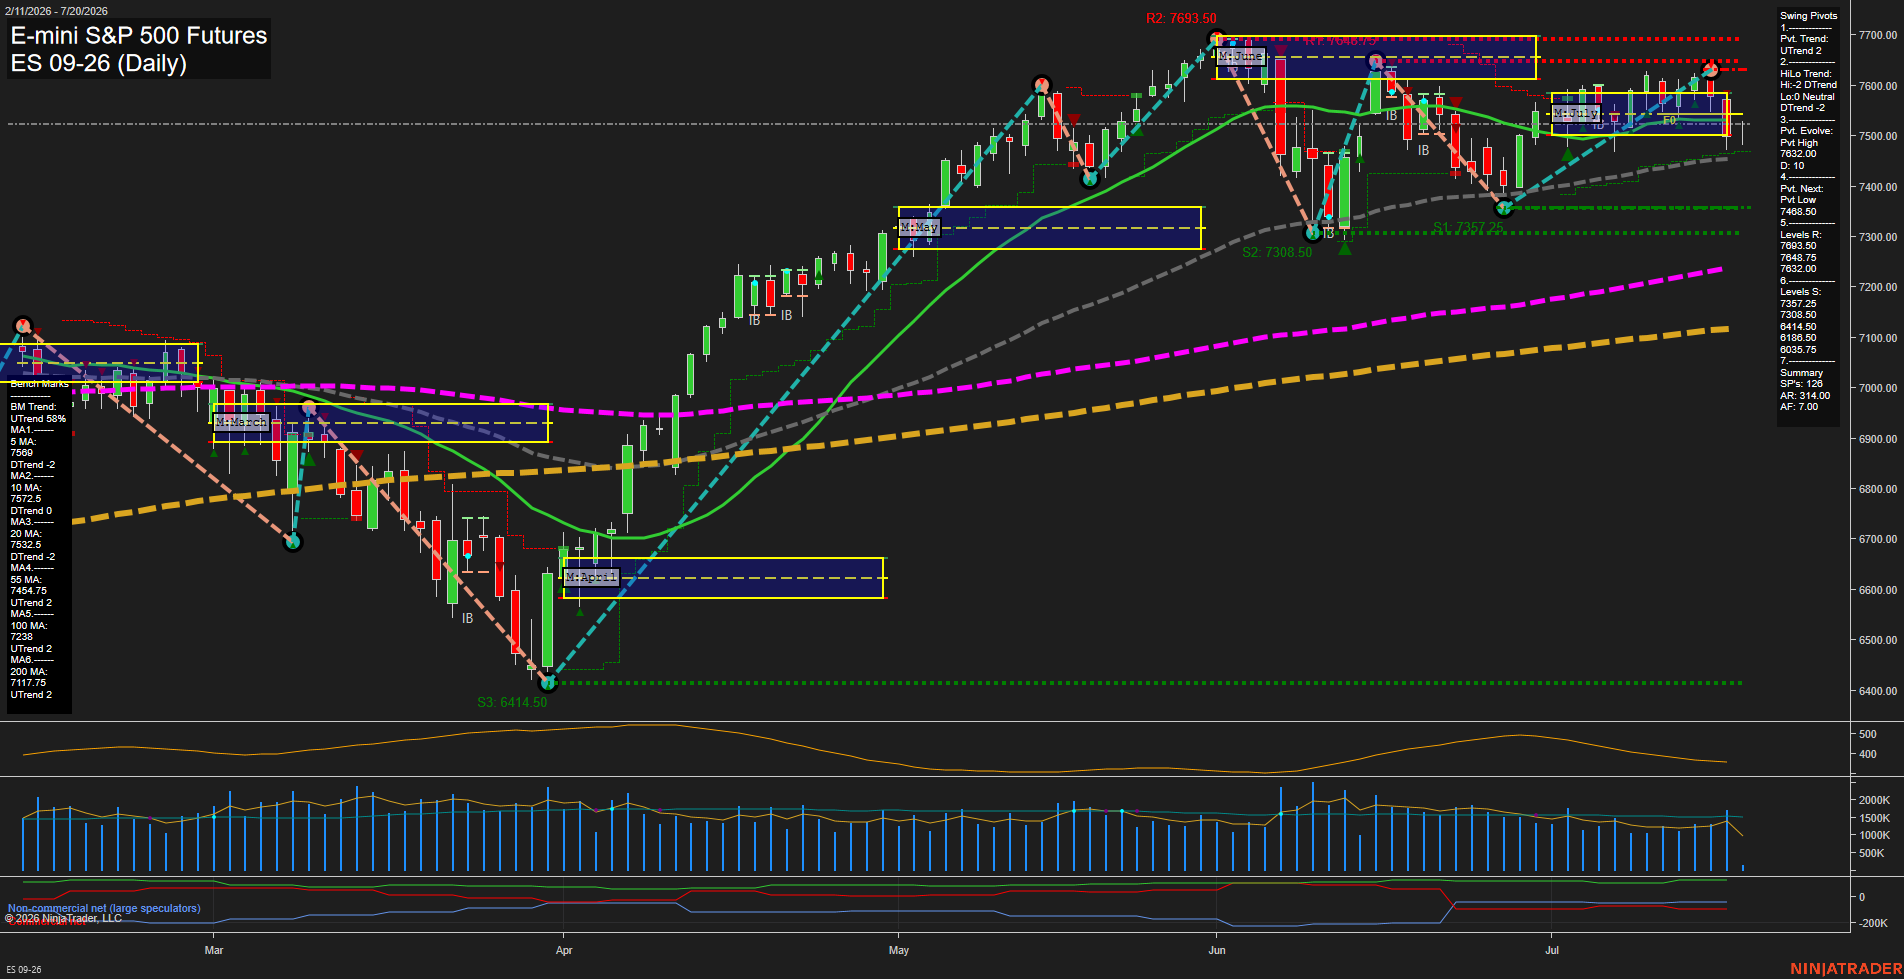
- ES YSFG/MSFG/WSFG above F0%, UTrend pivots, higher MAs rising, 7292.50 swing support, 7693.50 resistance; weekly consolidation, daily pullback.
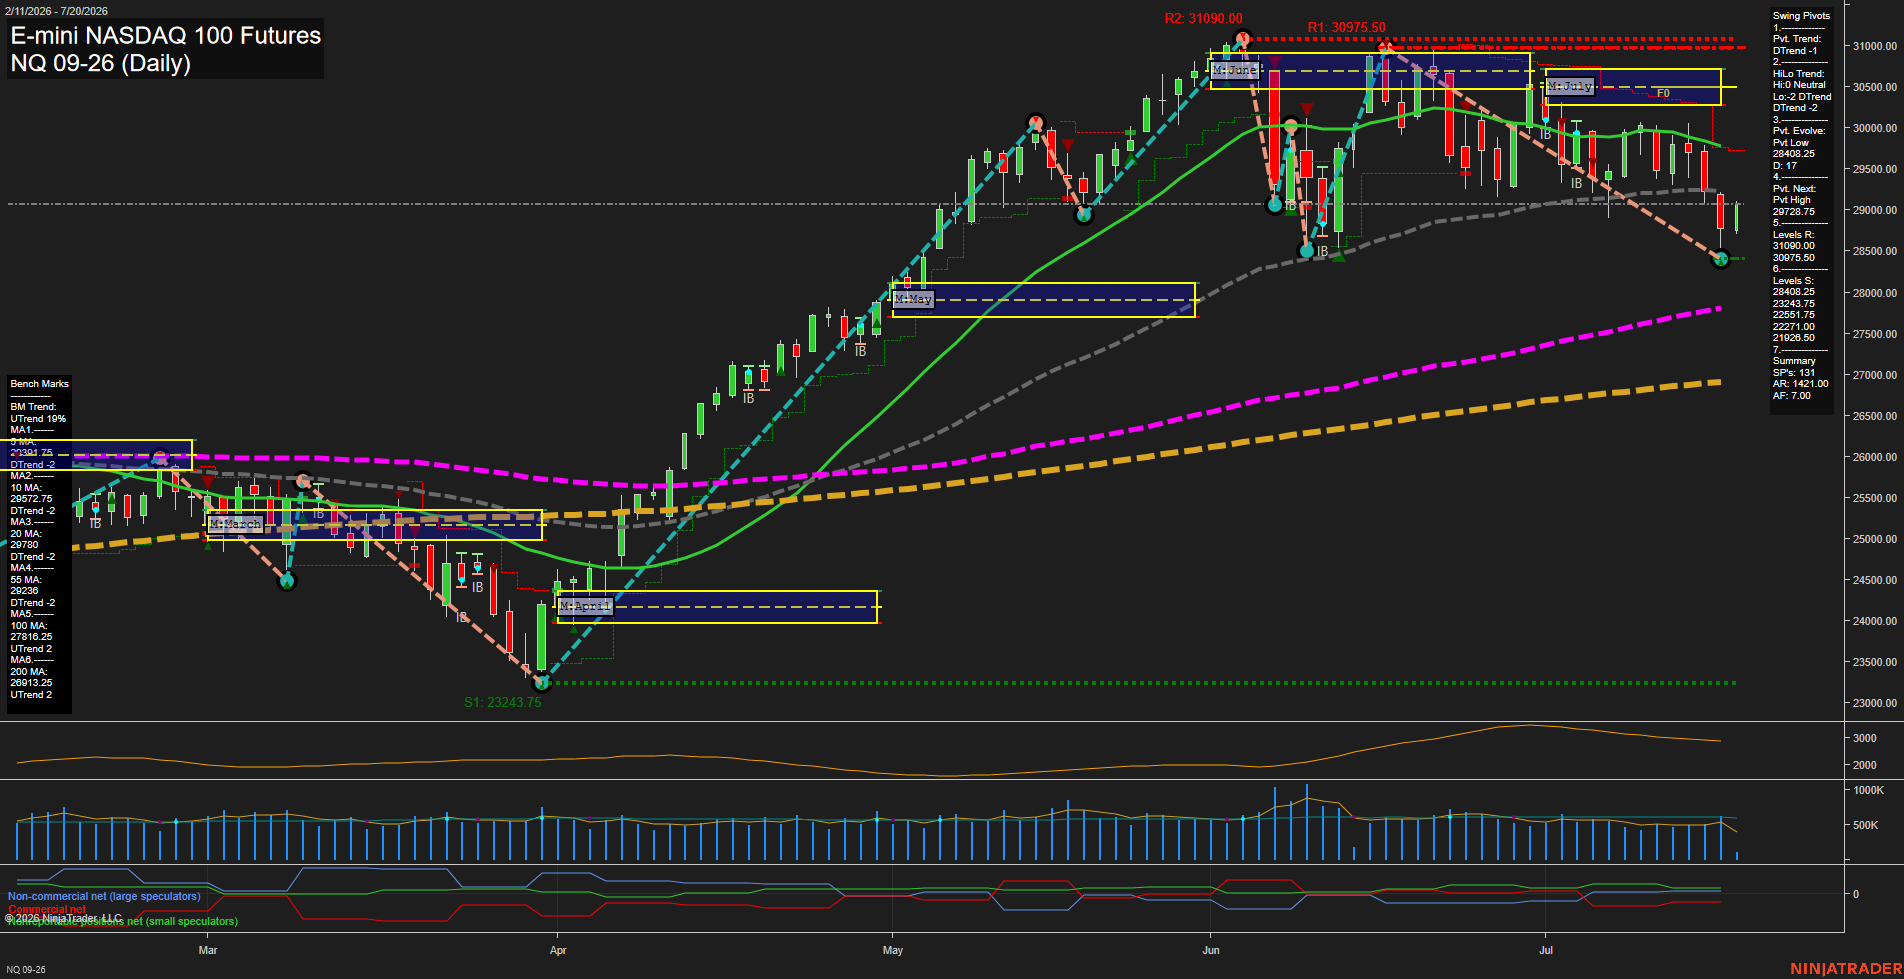
- NQ YSFG/WSFG higher, MSFG below F0%, DTrend pivots, 5–55-day benchmarks lower, 28408.25 support, 29728.75/31090.00 resistance.
- YM YSFG/MSFG/WSFG above F0%, higher-high pivots, MAs rising, 51104/52117 support, 53656–53866 resistance; daily pullback within weekly uptrend.
- EMD YSFG/WSFG above F0%, MSFG below F0%, weekly UTrend and daily DTrend, 3724.0–3834.7 support, 3839.0/3892.4 resistance.
- RTY YSFG/WSFG above F0%, MSFG below F0%, weekly UTrend and daily DTrend, 2947.8 support, 3042.4–3068.4 resistance.
- FDAX YSFG/WSFG above F0%, MSFG below F0%, weekly UTrend and daily DTrend, 24730/24294 support, 25465/26064 resistance.
Overall State
- Short-Term: Neutral
- Intermediate-Term: Bullish
- Long-Term: Bullish
Conclusion
Weekly structures retain broad upward alignment across all indices, led by ES, YM, EMD, RTY, and FDAX holding above yearly and weekly Fib references. NQ, YM, and FDAX daily conditions are in DTrend, while EMD and RTY are consolidative. Monthly Fib positioning remains below F0% in NQ, EMD, RTY, and FDAX, correlating with intermediate pullbacks beneath recent pivot highs. ES and YM maintain the most consistent Fib-grid and benchmark alignment; NQ and FDAX show the weakest short-term benchmark alignment.
Note: Intra-day counter-trend pullbacks or retracements may occur, HTF is context for informational usage and market structure. Glossary: Session Fib Grids periods of YSFG:’Yearly’, MSFG:’Monthly’, WSFG:’Weekly’
For full details visit: AlphaWebTrader Technicals
ES Daily View
Overall Rating
- Short-Term: Bullish
- Intermediate-Term: Bullish
- Long-Term: Bullish.
Key Insights Summary
The daily structure remains broadly constructive, with price above the rising 55-, 100-, and 200-day benchmarks and both monthly and yearly Fib-grid trends pointed higher. Short-term action is consolidative and choppy beneath the 7632.00-7648.75 resistance cluster, while the declining 10- and 20-day averages reflect a recent pullback from the June high. The UTrend pivot condition remains intact, although the intermediate HiLo trend is still DTrend, defining the current action as a countertrend retracement within the larger advance. Support is concentrated near the 7468.50 pivot-reversal area, followed by 7357.25 and 7308.50; sustained trade above the monthly F0% area preserves the broader higher-low recovery pattern.
View charts on: AlphaWebTrader HTF Charts
NQ Daily View
Overall Rating
- Short-Term: Bearish
- Intermediate-Term: Bearish
- Long-Term: Bullish.
Key Insights Summary
Price has undergone a sharp short-term retracement from the June highs, producing a DTrend pivot structure and trading beneath the 5-, 10-, 20-, and 55-day benchmarks. The weekly fib structure remains positive, while the July monthly grid is below its F0% area, reflecting a counter-trend decline within the broader annual uptrend. The 28408.25 pivot low is the active short-term structural reference, with 29728.75 defining the next upside pivot reversal level. Long-term benchmark alignment remains constructive as price holds above the rising 100- and 200-day averages, despite elevated daily range and fast downside momentum.
View charts on: AlphaWebTrader HTF Charts
CL Daily View
Overall Rating
- Short-Term: Bullish
- Intermediate-Term: Bullish
- Long-Term: Bullish.
Key Insights Summary
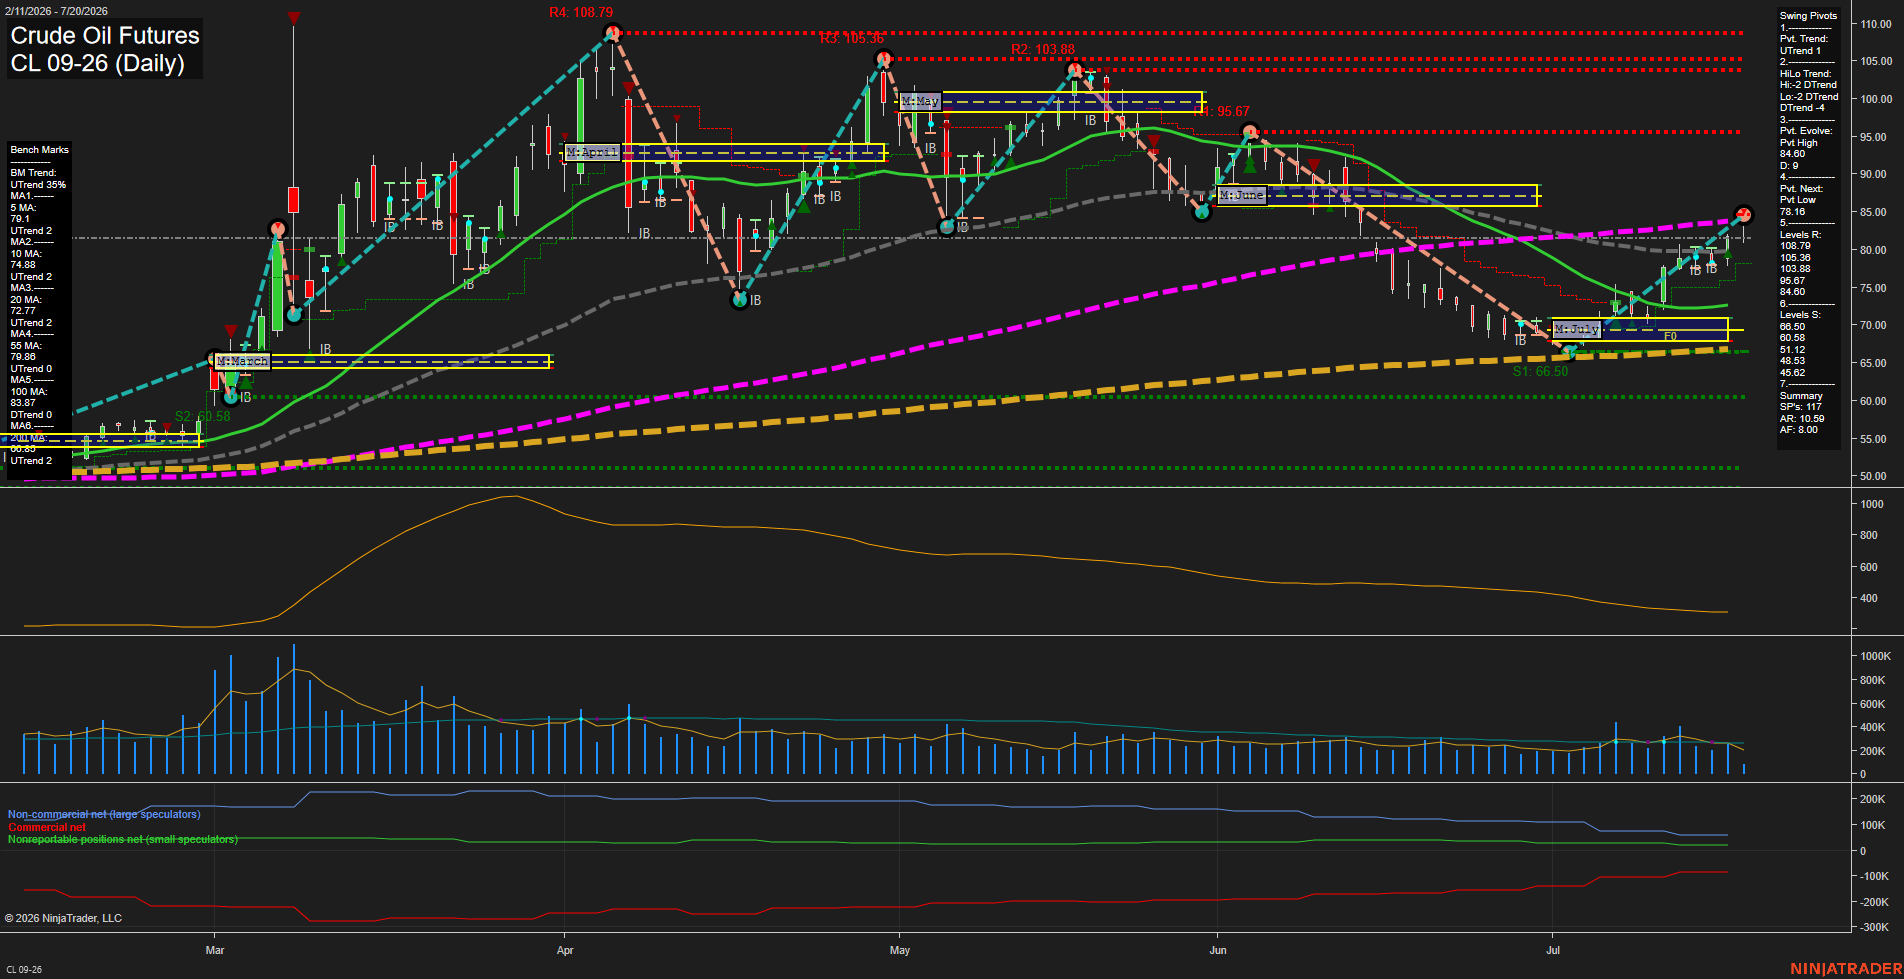
CL has produced a sharp V-style recovery from the early-July low area, reclaiming the 5-, 10-, 20-, and 55-day benchmarks while forming higher lows. Short-term pivot structure is positive, although price is testing the 84.60 pivot-high area and remains below the declining 100-day benchmark near 83.87 only marginally. The weekly grid remains below its F0% reference, creating a countertrend short-term backdrop within an otherwise upward monthly and yearly grid structure. The intermediate HiLo pivot trend remains down, reflecting the larger decline from the May-June highs, while the current rally has restored bullish near-term momentum. Volume participation is moderate and ATR has compressed from prior highs, consistent with a recovery phase rather than the earlier high-volatility selloff.
View charts on: AlphaWebTrader HTF Charts
GC Daily View
Overall Rating
- Short-Term: Bearish
- Intermediate-Term: Bearish
- Long-Term: Bearish.
Key Insights Summary
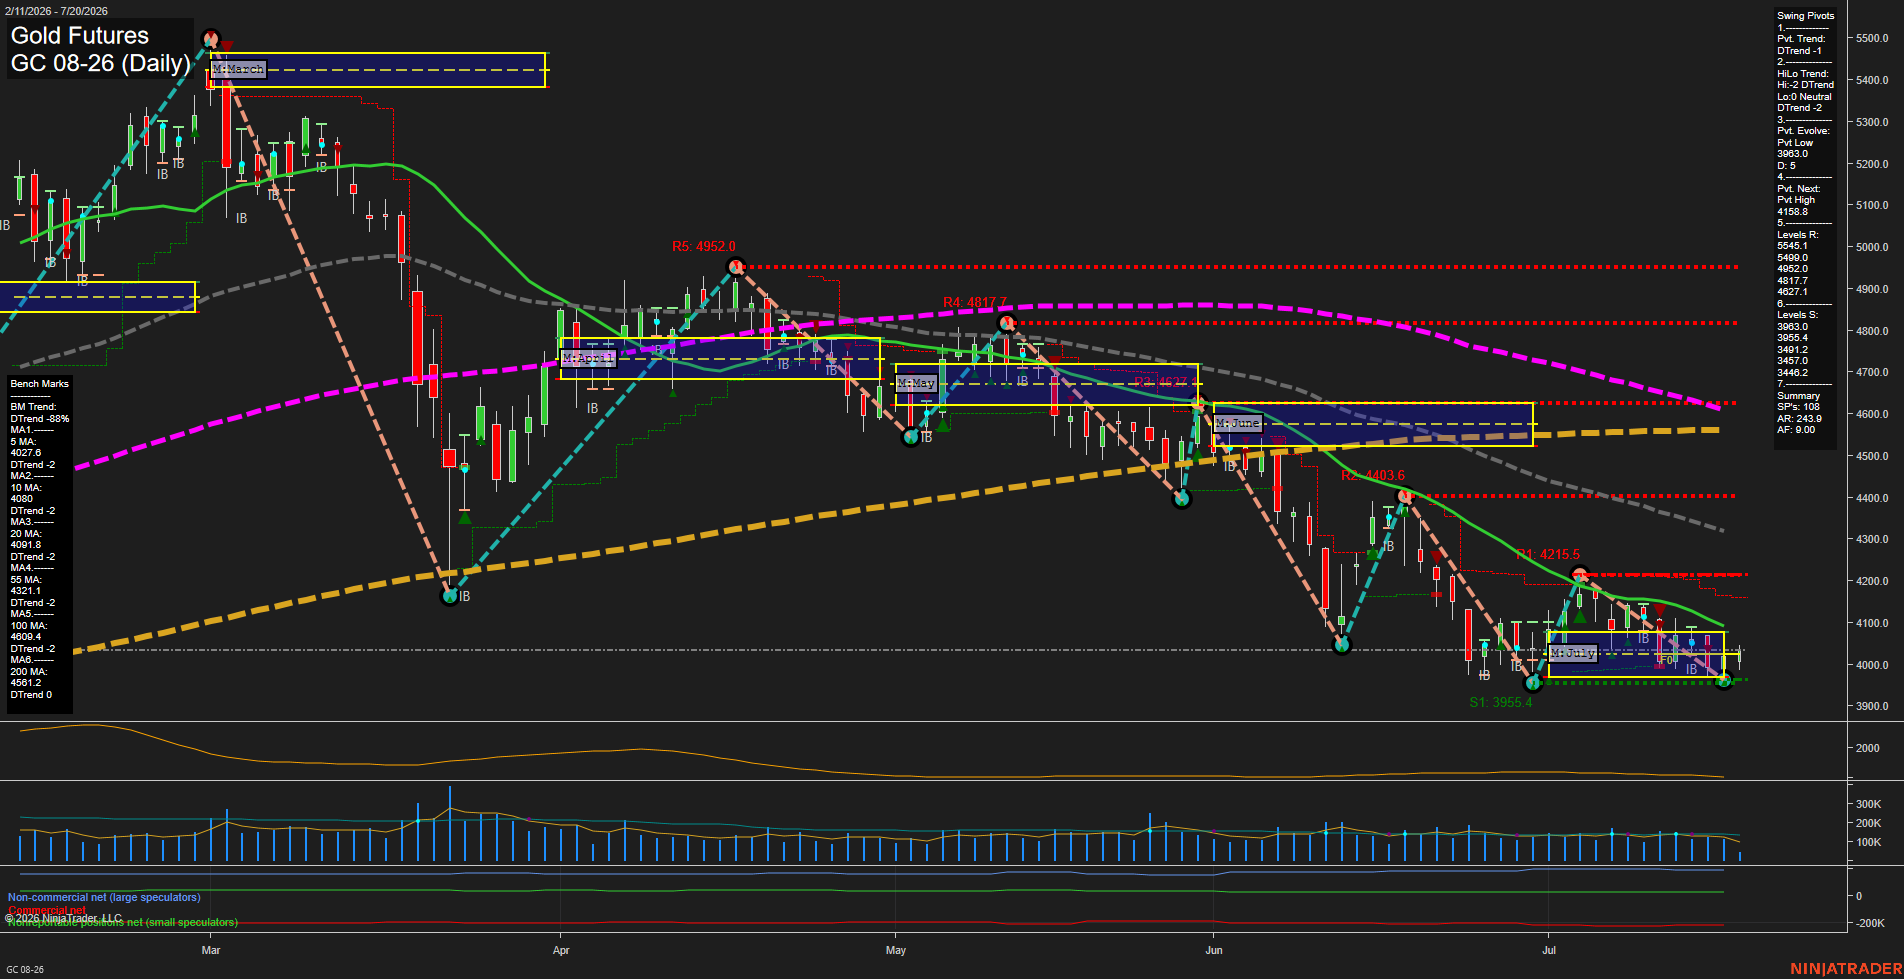
GC is consolidating tightly near the 3963-4029 support area following a sharp multi-month decline. The weekly and monthly Fib grids show a countertrend upward bias, but pivot structure remains in DTrend and price is below the 10, 20, 55, 100, and 200 day benchmarks. Small daily bars and subdued momentum reflect compression after the selloff; 4158.8 defines the next pivot reversal threshold, while 3963.0 and 3955.4 remain the nearby swing support cluster. The broader structure continues to show lower highs and lower lows, with the recent WSFG and MSFG long signals representing a short-term rebound within a still-bearish intermediate and long-term price cycle.
View charts on: AlphaWebTrader HTF Charts