U.S. stocks closed mixed as software gains offset semiconductor weakness, oil prices fell on Iran talks, and traders awaited Fed and tech earnings.
Fundamentals: U.S. equities ended mixed, with the Dow and S&P 500 advancing while the Nasdaq declined amid pressure on semiconductor shares. Software stocks provided support as oil prices dropped sharply following paused U.S.-Iran strikes and renewed negotiations. Markets remained focused on upcoming Big Tech earnings, the Federal Reserve decision, PCE inflation data, and unresolved Middle East shipping disruptions.
Technicals: Large-cap technology shares led notable gains, with Alphabet, Microsoft and Apple higher, while Nvidia, Tesla and the United States Oil Fund declined. Futures analysis showed bullish longer-term structures across several contracts, although Nasdaq futures remained in a corrective phase and S&P 500 futures faced nearby resistance. Dow, E-mini Dow, Russell 2000 and DAX trends remained broadly constructive.
After Market Close daily snapshot: market news summary and sentiment, major ETFs, Magnificent 7 analysis, Indices Futures Higher Time Frame Analysis, and E-mini S&P500, Nasdaq 100, NYMEX Crude, Gold Futures Daily Chart analysis.
As of: July 27, 2026 05:00 CT
Market News Summary:
U.S. equities finished mixed as a sharp oil decline, semiconductor weakness, and a dense calendar of tech earnings, Fed policy, and inflation data shaped positioning.
Primary Drivers & Risks:
- Primary Driver: Big Tech earnings and Fed decision
- Primary Risk: Iran conflict and chip-sector pressure
Tone:
Mixed and event-sensitive, with rotation away from semiconductors.
Stock Market / ETFs / Indices:
The Dow gained 0.51% to 52,210.08 and the S&P 500 edged higher, while the Nasdaq fell as semiconductor weakness offset gains in other groups. Software stocks led the S&P 500, while a Chinese IPO rattled chip stocks. Markets enter a key week near record highs, with Microsoft and Meta reporting Wednesday and volatile ETF flows in focus.
Geopolitical:
U.S. and Iran halted strikes and began negotiations, supporting hopes for a peace agreement. The Strait of Hormuz and a key Red Sea oil chokepoint remain closed, while the duration of the Iran conflict remains a continuing market concern.
Oil / Energy:
WTI and Brent oil fell sharply, with reports describing a roughly 10% drop as paused strikes and Iran negotiations reduced immediate supply-risk pricing. Chokepoint closures remain an important constraint for oil markets, and energy commodities had recently been among leading ETF exposures.
Gold / Metals:
Gold retreated from around $4,116 as oil prices fell, though gold, silver, and platinum gained ground during the session. FOMC and PCE data remain central for rate-sensitive metals pricing, while Asian demand led by China was cited as ongoing support.
Fed / Financials:
The Federal Reserve decision and PCE inflation data are major scheduled catalysts. President Trump again pressed for lower interest rates while noting that Fed Chair Kevin Warsh does not decide policy alone. Bonds and ETF flows are also in focus ahead of the decision.
Macro / Other:
U.S. durable-goods orders increased 0.3% in June. Strong demand for AI-related memory and technology was cited as supporting economic activity, while market risk remains concentrated in expensive technology and semiconductor shares.
Conclusion:
Index futures sentiment is centered on Big Tech results, the Fed decision, and inflation data. Equity leadership was mixed, with software strength offset by chip-sector pressure.
Oil’s sharp decline reduced immediate energy-driven inflation pressure, while Middle East transport disruptions remain unresolved. Gold and bonds remain sensitive to the Fed and inflation outlook.
Market News Sentiment
Market News Articles: 41
- Neutral: 68.29%
- Negative: 17.07%
- Positive: 14.63%
Sentiment Summary: Of 41 market news articles, 68% are neutral, 17% negative, and 15% positive, indicating predominantly neutral coverage with negative sentiment slightly exceeding positive sentiment.
Conclusion: Indices futures news tone is broadly neutral, with a modest negative skew among directional articles.
GLD,Gold Articles: 9
- Positive: 88.89%
- Neutral: 11.11%
Sentiment Summary: Gold-related coverage was strongly positive, with 89% positive and 11% neutral across 9 articles.
Conclusion: The snapshot indicates predominantly positive sentiment toward GLD and gold, with no negative articles reported.
USO,Oil Articles: 16
- Negative: 56.25%
- Neutral: 25.00%
- Positive: 18.75%
Sentiment Summary: USO/Oil coverage is predominantly negative at 56%, with 25% neutral and 19% positive articles across 16 items.
Conclusion: The oil-news tone is net negative, which may be relevant context for indices futures traders monitoring energy-sector sentiment.
Market Data Snapshot
ETF Snapshot of major stock market ETFs, Mag7, and others as of: July 27, 2026 05:00
Top Movers & Losers
- GOOG 326.57 Bullish 2.34% ▲
- MSFT 389.10 Bullish 1.94% ▲
- AAPL 336.91 Bullish 1.17% ▲
- TSLA 309.22 Bearish -1.22% ▼
- NVDA 196.51 Bearish -4.99% ▼
- USO 124.76 Bearish -8.73% ▼
Major Index ETFs: SPY, QQQ, DIA, IWM, IJH
- IWM 292.91 Bullish 0.60% ▲
- DIA 521.26 Bullish 0.48% ▲
- IJH 76.00 Bullish 0.30% ▲
- SPY 739.09 Bullish 0.02% ▲
- QQQ 682.12 Bearish -0.31% ▼
Mixed index ETF snapshot: IWM is the most bullish mover at +0.60%, followed by DIA at +0.48% and IJH at +0.30%. SPY is marginally Bullish at +0.02%, while QQQ is the most bearish mover at -0.31%.
Mag 7 Stocks: AAPL, MSFT, GOOG, AMZN, META, NVDA, TSLA
- GOOG 326.57 Bullish 2.34% ▲
- MSFT 389.10 Bullish 1.94% ▲
- AAPL 336.91 Bullish 1.17% ▲
- META 593.87 Bearish -0.22% ▼
- AMZN 231.39 Bearish -0.31% ▼
- TSLA 309.22 Bearish -1.22% ▼
- NVDA 196.51 Bearish -4.99% ▼
Mag7 action is Mixed: GOOG is the most bullish mover at +2.34%, followed by MSFT at +1.94% and AAPL at +1.17%. NVDA is the most bearish mover at -4.99%, while TSLA is down -1.22%; META and AMZN are modestly Bearish at -0.22% and -0.31%.
Cross-Market ETFs: TLT, GLD, USO, IBIT
- IBIT 36.77 Bullish 1.16% ▲
- GLD 374.63 Bullish 0.73% ▲
- TLT 83.75 Bullish 0.60% ▲
- USO 124.76 Bearish -8.73% ▼
Cross-market action was Mixed: IBIT was the most bullish mover at +1.16%, followed by GLD at +0.73% and TLT at +0.60%. USO was the most bearish mover, down -8.73%, creating a pronounced divergence versus the bullish moves in IBIT, GLD, and TLT.
ETF, Mag7, and Cross-Market ETF Insights
Overall Tone
Mixed, with selective equity strength led by GOOG while pronounced weakness in USO and NVDA offsets broader risk-on alignment.
Equity ETFs and Mag7:
Major Index ETFs were Mixed: IWM led at +0.60%, followed by DIA at +0.48% and IJH at +0.30%, while SPY was marginally positive at +0.02% and QQQ declined -0.31%. Mag7 performance was selective, with GOOG the most bullish equity mover at +2.34%, ahead of MSFT at +1.94% and AAPL at +1.17%; META fell -0.22%, AMZN declined -0.31%, TSLA lost -1.22%, and NVDA was the most bearish equity mover at -4.99%. Equity performance was not broadly aligned, with small- and mid-cap ETFs positive while Nasdaq exposure was pressured by NVDA and TSLA.
Cross-Market ETFs:
TLT, GLD, and IBIT were Bullish, rising +0.60%, +0.73%, and +1.16%, respectively, with IBIT the most bullish cross-market mover. USO was Bearish at -8.73%, the most bearish cross-market mover and the largest decline across the full snapshot. The strength in bonds, gold, and bitcoin diverged from sharp commodity weakness and selective equity performance.
Futures Indices – Higher Time Frame Analysis
Summary of the current state of US Indices Futures based on higher time-frame (HTF) technical analysis as of: 2026-07-27: 17:00 CT.
US Indices Futures
- ES YSFG/WSFG above F0%, MSFG below F0%; 7693.50 resistance, 7302.50 pivot-next support; weekly bullish, daily intermediate DTrend.
- NQ YSFG/WSFG above F0%, MSFG below F0%; 28212.50 support, 29463.00 reversal, 30901.50–31090.00 resistance; short/intermediate bearish.
- YM YSFG/MSFG/WSFG above F0%; 53668–53856 resistance, 52844 reversal, 51720 support; benchmarks rising, broad UTrend intact.
- EMD YSFG/WSFG above F0%, MSFG below F0%; 3892.4–3904.7 resistance, 3863.2 pivot threshold; weekly bullish, monthly countertrend.
- RTY YSFG/WSFG above F0%, MSFG below F0%; 3068.4 resistance, 3023.7 reversal, 2936.2 support; daily consolidation within UTrend.
- FDAX YSFG/MSFG/WSFG above F0%; 25630–26064 resistance, 24902 reversal, 24715 support; all benchmarks rising, UTrend intact.
Overall State
- Short-Term: Bullish
- Intermediate-Term: Bullish
- Long-Term: Bullish
Conclusion
Long-term alignment remains bullish across all contracts, supported by YSFG positioning and rising long-duration benchmarks. FDAX, YM, and EMD retain the firmest multi-timeframe structure; ES, NQ, and RTY show monthly-grid retracement or consolidation. NQ remains the primary short-term lagging instrument, while FDAX and YM hold broad UTrend conditions. Major swing pivots and nearby resistance define current HTF boundaries.
Note: Intra-day counter-trend pullbacks or retracements may occur, HTF is context for informational usage and market structure. Glossary: Session Fib Grids periods of YSFG:’Yearly’, MSFG:’Monthly’, WSFG:’Weekly’
For full details visit: AlphaWebTrader Technicals
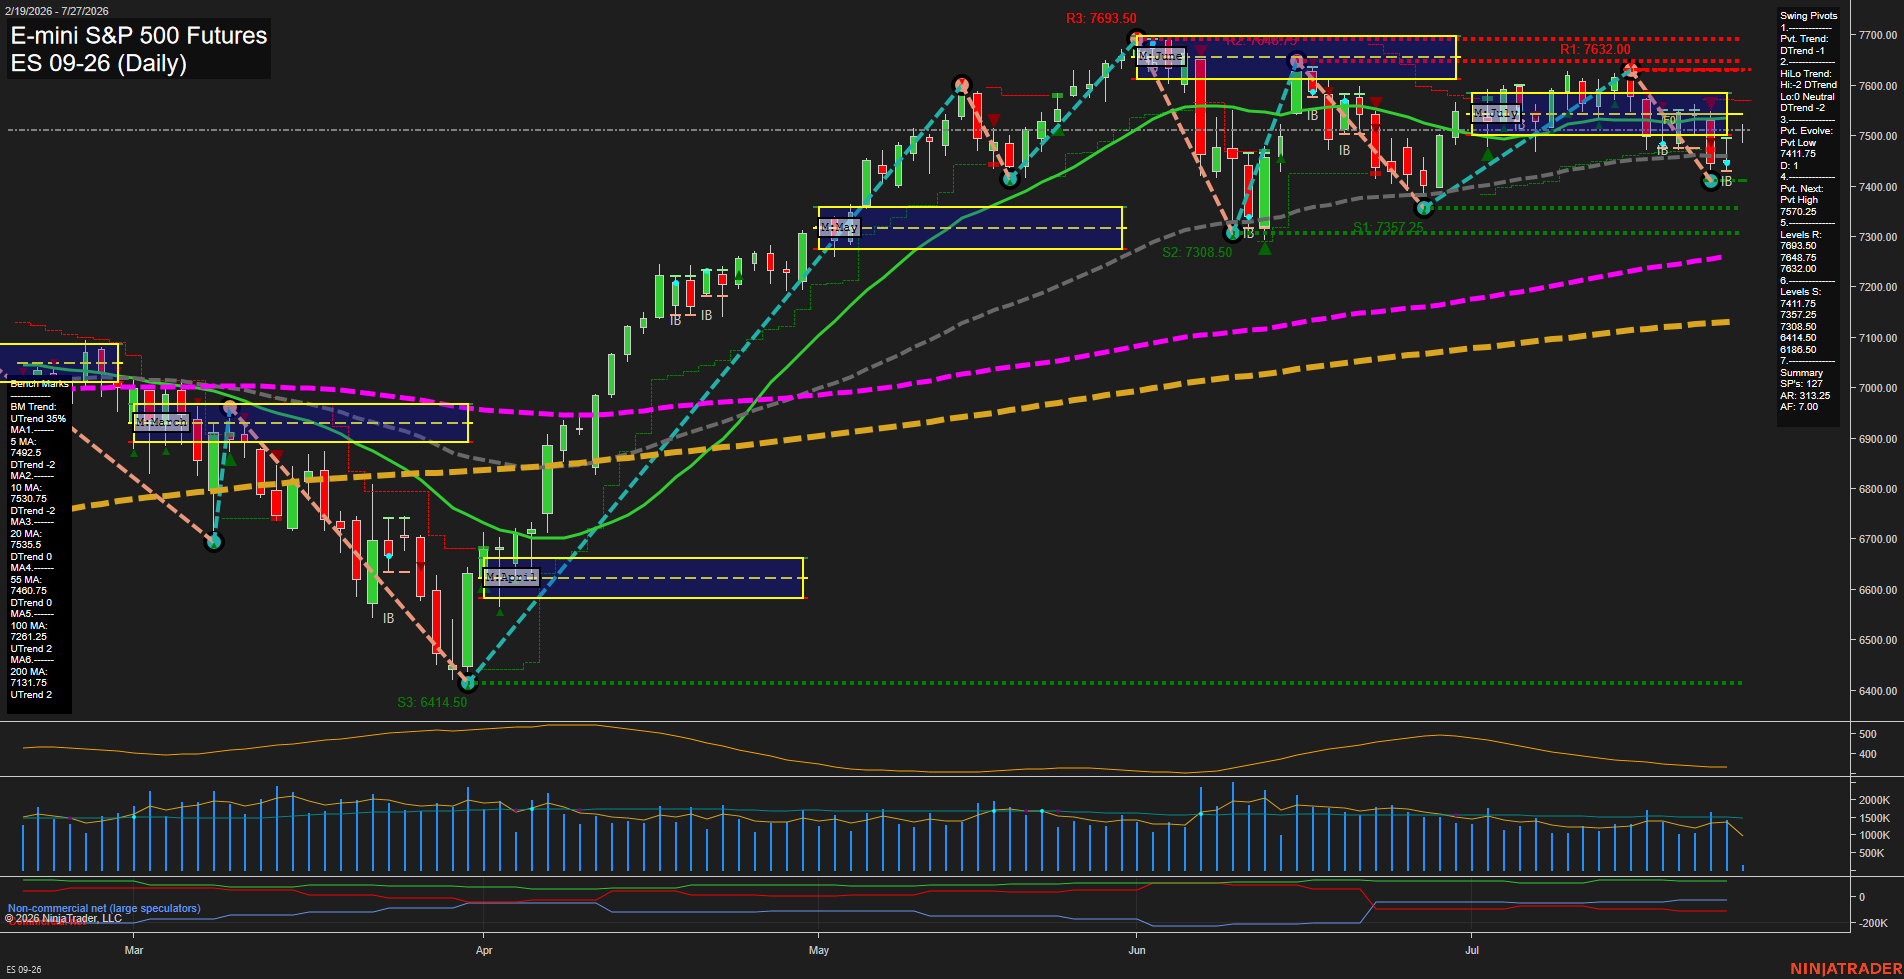
ES Daily View
Overall Rating
- Short-Term: Bullish
- Intermediate-Term: Bearish
- Long-Term: Bullish.
Key Insights Summary
Price is holding above the weekly F0% area and the rising 5-day benchmark, reflecting a short-term rebound from the 7417.5 pivot low. The recovery remains a countertrend swing within a softer intermediate structure: price is below the monthly F0% area, the 10-day and 20-day averages, and both pivot trend measures remain in DTrend. The 7530.75 to 7579.25 area defines the nearby overhead pivot and moving-average cluster, while 7411.75 and 7357.25 mark the principal lower swing supports. Long-term structure remains constructive because price is materially above rising 100-day and 200-day benchmarks, despite current consolidation and elevated daily range conditions.
View charts on: AlphaWebTrader HTF Charts
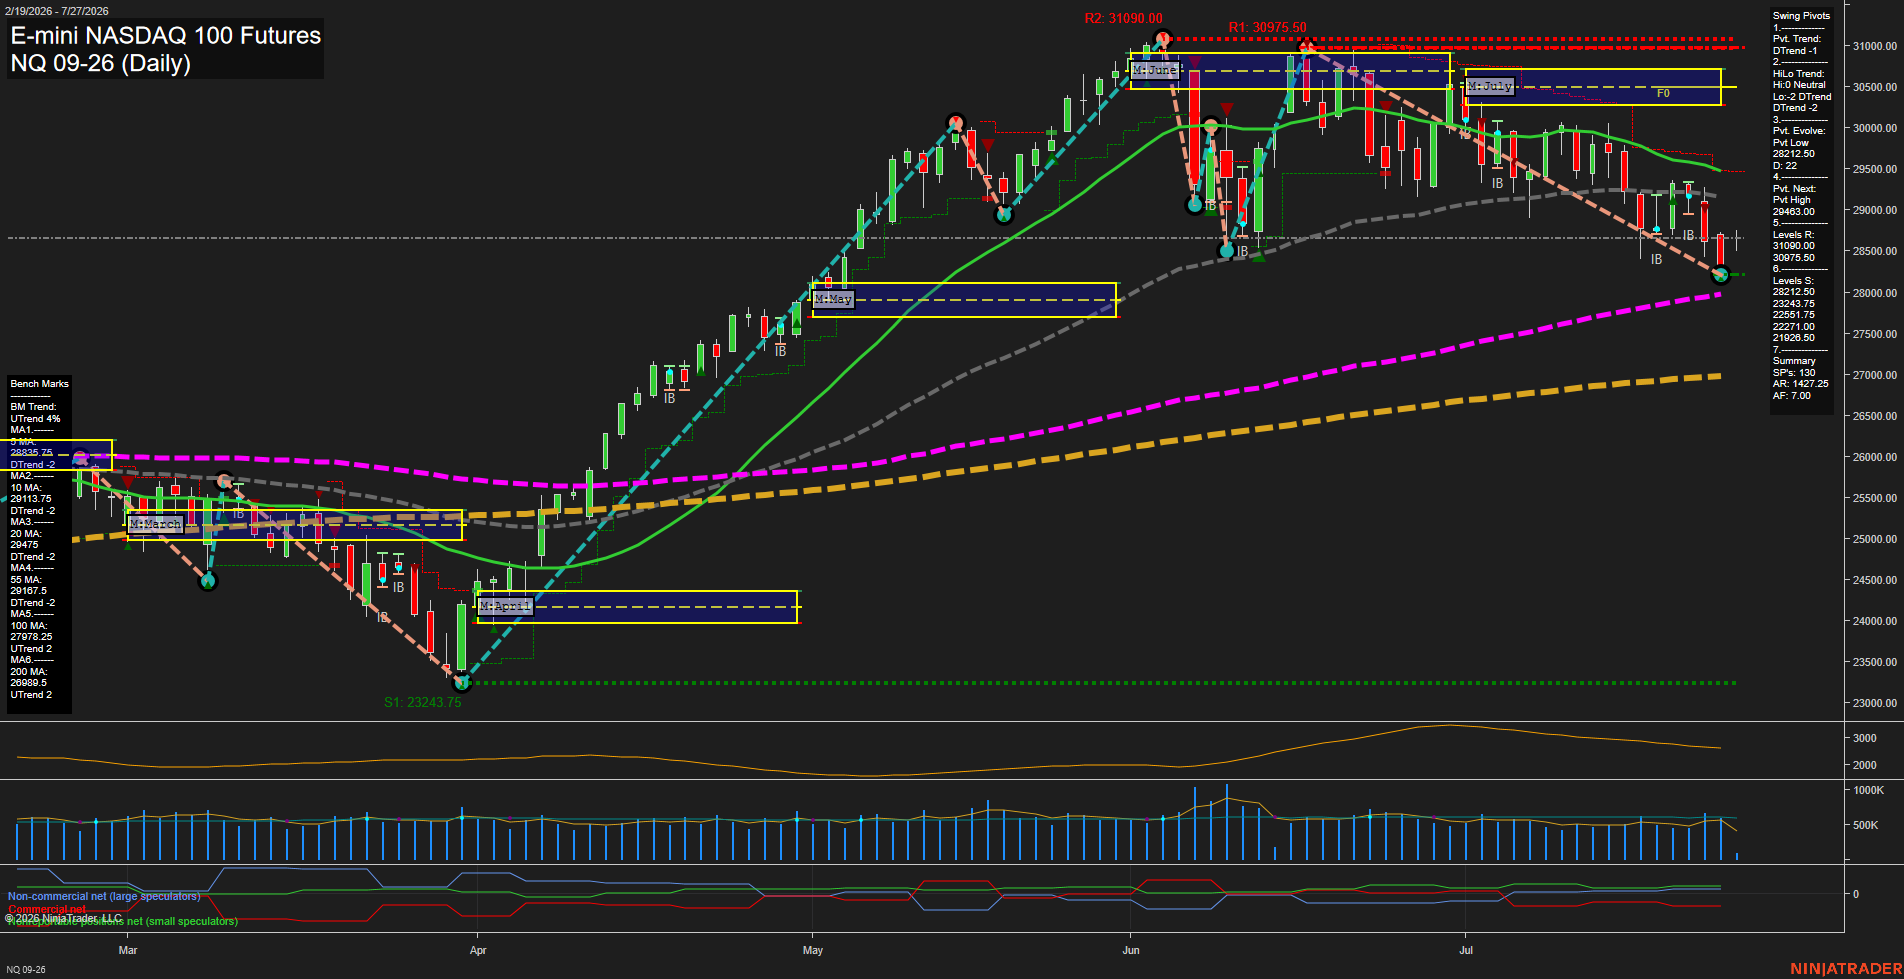
NQ Daily View
Overall Rating
- Short-Term: Bearish
- Intermediate-Term: Bearish
- Long-Term: Bullish.
Key Insights Summary
Price remains in a short-term corrective downswing, holding below the 5-, 10-, 20-, and 55-day benchmarks while the pivot sequence reflects lower highs and lower lows. The July MSFG is below its F0% region and supports the intermediate bearish retracement theme, although the weekly grid remains positive and indicates a countertrend bounce framework within the broader decline. The 28242.50 pivot-support area is the nearest structural reference beneath price, while 29463.00 is the active pivot-reversal threshold and aligns with the declining intermediate moving-average zone. The longer-term structure remains constructive because price is above the rising 100- and 200-day averages and the yearly fib grid remains positive; current action therefore reflects a pullback within a broader long-term advance rather than a confirmed major-trend reversal.
View charts on: AlphaWebTrader HTF Charts
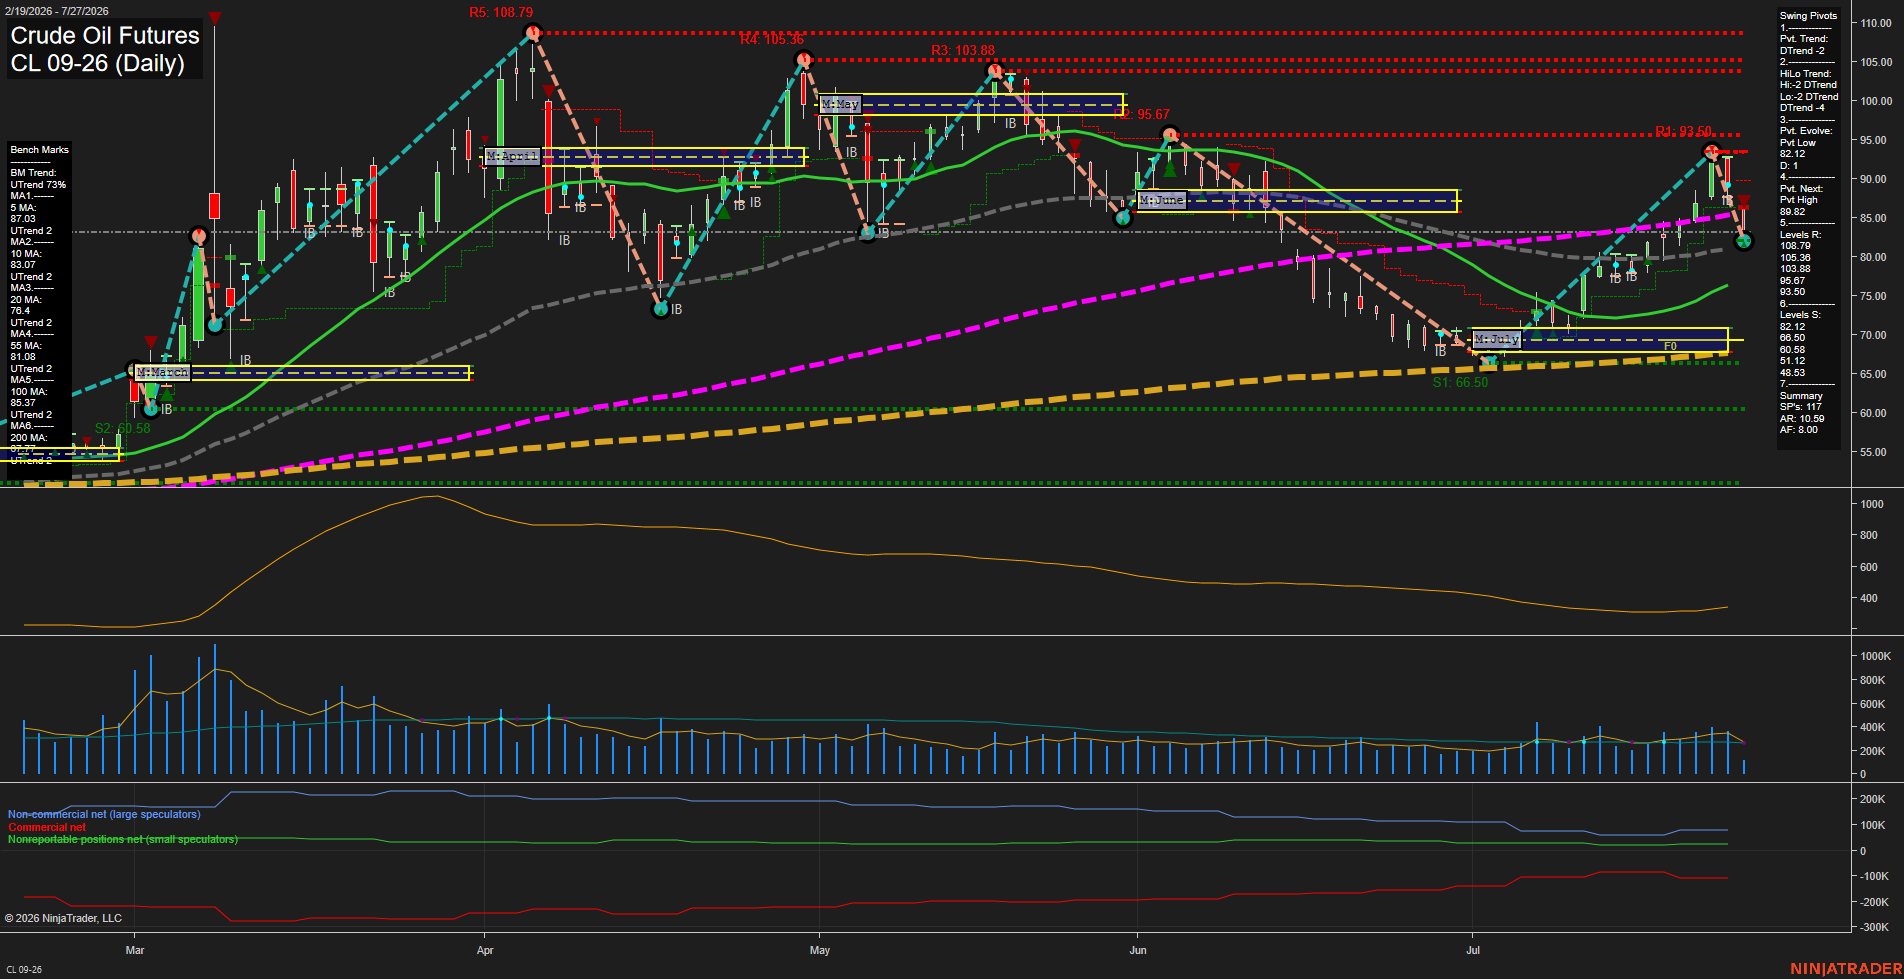
CL Daily View
Overall Rating
- Short-Term: Bearish
- Intermediate-Term: Bullish
- Long-Term: Bullish.
Key Insights Summary
Price is undergoing a fast short-term pullback after rejection from the 93.50 pivot resistance area. The current pivot and HiLo structures remain in DTrend, while the weekly Fib Grid is below its F0% level, reflecting near-term downside pressure. Price remains above the rising 10-, 20-, 55-, 100-, and 200-day benchmarks, and the monthly and yearly Fib Grid readings remain positive, preserving the broader recovery structure. The 82.12 pivot low is the principal nearby structural support, while 89.89 is the reversal level required to establish the next pivot high; 93.50 remains the larger overhead resistance reference.
View charts on: AlphaWebTrader HTF Charts
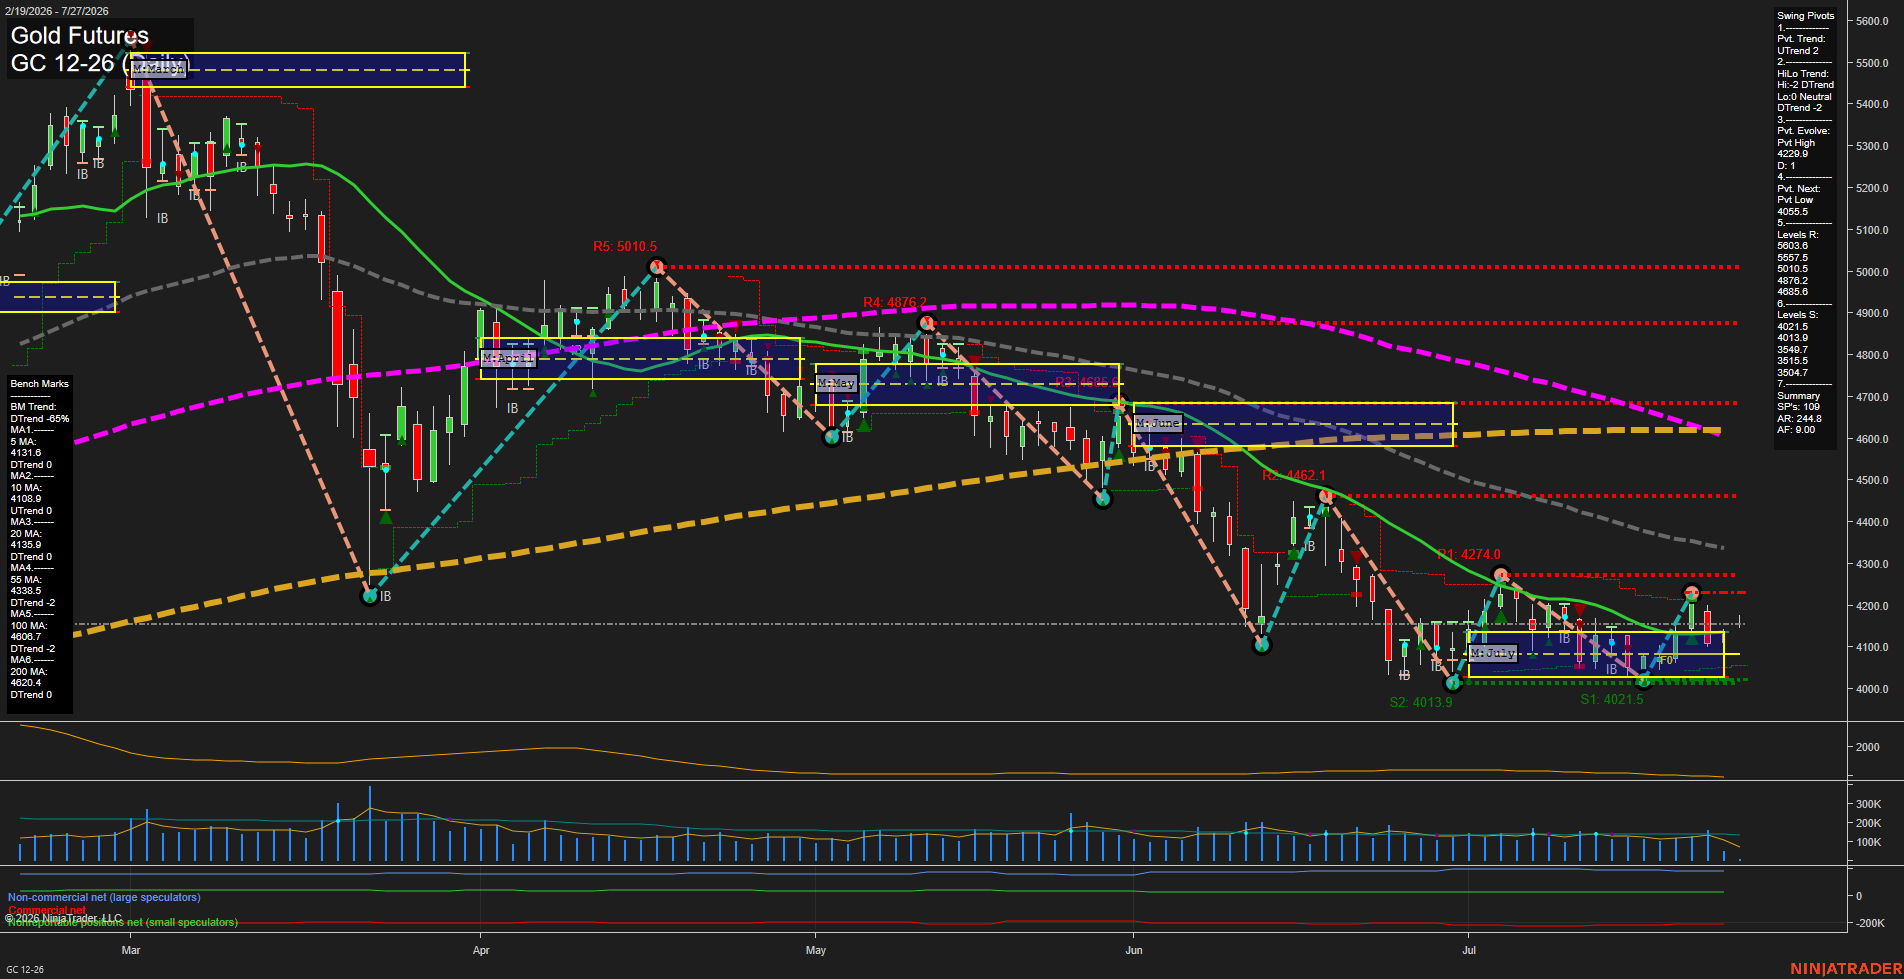
GC Daily View
Overall Rating
- Short-Term: Bullish
- Intermediate-Term: Bearish
- Long-Term: Bearish.
Key Insights Summary
GC is consolidating in a narrow July range above the 4021.5-4013.9 support cluster, with small daily bars and subdued momentum reflecting compression after the June-July decline. Short-term structure has improved to a UTrend, supported by price above the weekly and monthly F0% areas and rising 10-day benchmark behavior. The intermediate and major trend backdrop remains bearish: the HiLo trend is down and price remains beneath the declining 20-, 55-, 100-, and 200-day benchmarks. The 4229.9 pivot high is the immediate structural ceiling, while 4055.5 identifies the reversal threshold for a new short-term pivot low. Volume is below earlier-period activity, consistent with consolidation rather than a broad directional expansion.
View charts on: AlphaWebTrader HTF Charts