U.S. stocks closed mixed as Dow strength and value rotation offset a semiconductor selloff, while Fed policy, AI valuations and oil stayed in focus.
Fundamentals: U.S. equities ended mixed as a gain of more than 540 points in the Dow and strength in value, consumer, industrial and energy-linked shares contrasted with a semiconductor-led decline in technology. Lower oil prices supported consumer stocks, while investors weighed the Federal Reserve decision, major technology earnings, Iran-war risks, inflation signals and AI valuation concerns.
Technicals: Google, Microsoft and the Dow ETF led listed movers higher, while gold, bitcoin and oil funds declined. Futures technical readings showed short-term weakness in the S&P 500 and Nasdaq despite longer-term bullish structures, while Dow and DAX trends remained comparatively firm. Small-cap and midcap futures were consolidating below recent resistance levels.
After Market Close daily snapshot: market news summary and sentiment, major ETFs, Magnificent 7 analysis, Indices Futures Higher Time Frame Analysis, and E-mini S&P500, Nasdaq 100, NYMEX Crude, Gold Futures Daily Chart analysis.
As of: July 28, 2026 05:00 CT
Market News Summary:
U.S. equities finished mixed as a semiconductor selloff contrasted with strength in the Dow, value stocks, consumer shares, industrials, and energy-related sectors ahead of the Fed decision and major technology earnings.
Primary Drivers & Risks:
- Primary Driver: Rotation from chips into value
- Primary Risk: Fed and AI valuation uncertainty
Tone:
Mixed, with broad-market resilience offset by technology weakness.
Stock Market / ETFs / Indices:
The Dow rose more than 540 points as corporate earnings and lower oil prices offset ongoing weakness in semiconductor shares. The Nasdaq-100 approached correction territory amid the chip rout, while growth-oriented benchmarks faced pressure and value outperformed growth. IQVIA led the S&P 500 after raising its full-year outlook, and Invesco reported record long-term inflows and higher profitability.
Geopolitical:
The Iran war remained a source of uncertainty for energy prices, inflation expectations, yields, equities, and the Fed outlook. U.S. strategic petroleum reserves have fallen to their lowest level since 1983 following emergency releases during recent disruptions.
Oil / Energy:
Falling oil prices supported consumer stocks, while WTI faced continued selling pressure after a sharp pullback. The low level of the Strategic Petroleum Reserve and strain on older reserve infrastructure remained energy-security concerns.
Gold / Metals:
Gold remained under pressure despite a weaker dollar and favorable yield conditions, with rate-hike fears and Middle East conflict weighing on sentiment. The metal has declined from its January 2026 peak and is testing key technical support; silver-mining equities showed stronger one-year returns than bullion but also deeper historical drawdowns.
Fed / Financials:
Markets awaited Wednesday’s Federal Reserve rate decision amid unsettled oil prices, inflation expectations, yields, and geopolitical risk. Commentary reflected disagreement over policy: one strategist cited a hold through at least September, while another argued for a rate increase. The BIS said the AI investment boom complicates central-bank interpretation of inflation and economic signals.
Macro / Other:
AI-related valuation concerns intensified as semiconductor shares fell. Fitch characterized a prolonged AI-market pullback as a major credit risk, while hyperscaler capital-spending decisions remained a key focus for AI hardware suppliers.
Conclusion:
Broad equity performance was supported by earnings, lower oil prices, and rotation into value, defensive, industrial, and energy-linked shares. Semiconductor weakness remained the main drag on technology-heavy indexes.
The Fed decision and major technology earnings were immediate event risks. Iran-war uncertainty, depleted strategic oil reserves, inflation ambiguity, and AI valuation concerns maintained cross-currents across futures markets.
Market News Sentiment
Market News Articles: 39
- Neutral: 48.72%
- Positive: 28.21%
- Negative: 23.08%
Sentiment Summary: Market news sentiment is predominantly neutral at 49%, with positive coverage at 28% and negative coverage at 23% across 39 articles.
Conclusion: Indices futures day traders are facing a broadly balanced news backdrop with neutral coverage outweighing both positive and negative sentiment.
GLD,Gold Articles: 13
- Neutral: 38.46%
- Positive: 30.77%
- Negative: 30.77%
Sentiment Summary: Gold-related coverage is neutral overall, with 38% neutral, 31% positive, and 31% negative articles across 13 items.
Conclusion: The balanced positive and negative distribution indicates no clear directional sentiment signal from gold news for indices futures day traders.
USO,Oil Articles: 10
- Negative: 70.00%
- Neutral: 30.00%
Sentiment Summary: USO/Oil coverage is predominantly negative, with 70% negative and 30% neutral articles across 10 articles.
Conclusion: The oil news backdrop is negative overall, which may be relevant to energy-sensitive index futures components.
Market Data Snapshot
ETF Snapshot of major stock market ETFs, Mag7, and others as of: July 28, 2026 05:00
Top Movers & Losers
- GOOG 332.60 Bullish 1.85% ▲
- MSFT 393.35 Bullish 1.09% ▲
- DIA 526.89 Bullish 1.08% ▲
- GLD 369.37 Bearish -1.40% ▼
- IBIT 36.14 Bearish -1.71% ▼
- USO 120.49 Bearish -3.42% ▼
Major Index ETFs: SPY, QQQ, DIA, IWM, IJH
- DIA 526.89 Bullish 1.08% ▲
- SPY 740.86 Bullish 0.24% ▲
- IWM 293.37 Bullish 0.16% ▲
- IJH 76.03 Bullish 0.04% ▲
- QQQ 675.49 Bearish -0.97% ▼
Major index ETFs were Mixed: DIA was the most bullish mover at +1.08%, while SPY gained +0.24%. IWM rose +0.16%, and IJH was marginally bullish at +0.04%. QQQ was the most bearish mover, down -0.97%, highlighting divergence between large-cap growth and the broader index ETF gains.
Mag 7 Stocks: AAPL, MSFT, GOOG, AMZN, META, NVDA, TSLA
- GOOG 332.60 Bullish 1.85% ▲
- MSFT 393.35 Bullish 1.09% ▲
- AAPL 340.08 Bullish 0.94% ▲
- NVDA 197.01 Bullish 0.25% ▲
- META 593.41 Bearish -0.08% ▼
- AMZN 230.86 Bearish -0.23% ▼
- TSLA 307.44 Bearish -0.58% ▼
Mag7 conditions are Mixed: GOOG is the most bullish mover at +1.85%, followed by MSFT at +1.09% and AAPL at +0.94%. NVDA is modestly Bullish at +0.25%. META is marginally Bearish at -0.08%, while AMZN is Bearish at -0.23%. TSLA is the most bearish mover at -0.58%.
Cross-Market ETFs: TLT, GLD, USO, IBIT
- TLT 84.24 Bullish 0.59% ▲
- GLD 369.37 Bearish -1.40% ▼
- IBIT 36.14 Bearish -1.71% ▼
- USO 120.49 Bearish -3.42% ▼
Other ETFs were Bearish overall: TLT was the least negative mover at +0.59%, while USO was the most bearish mover at -3.42%. GLD declined -1.40% and IBIT fell -1.71%.
ETF, Mag7, and Cross-Market ETF Insights
Overall Tone
Mixed, with selective equity leadership led by GOOG while weakness in USO, IBIT, GLD, and QQQ tempered the broader Bullish index ETF moves.
Equity ETFs and Mag7:
Major Index ETFs were Mixed: DIA led at +1.08%, while SPY rose +0.24%, IWM gained +0.16%, and IJH was marginally higher at +0.04%; QQQ was the most bearish major index ETF at -0.97%. Mag7 action was selective, with GOOG the most bullish mover at +1.85%, followed by MSFT at +1.09%, AAPL at +0.94%, and NVDA at +0.25%. META was marginally lower at -0.08%, AMZN declined -0.23%, and TSLA was the most bearish Mag7 mover at -0.58%.
Cross-Market ETFs:
Cross-market ETFs were Mixed: TLT was the only Bullish instrument, gaining +0.59%. GLD fell -1.40% and IBIT declined -1.71%, while USO was the most bearish cross-market and overall mover at -3.42%. The contrast between higher TLT and lower commodities and bitcoin reflected divergence from the mostly Bullish major index ETF action.
Futures Indices – Higher Time Frame Analysis
Summary of the current state of US Indices Futures based on higher time-frame (HTF) technical analysis as of: 2026-07-28: 17:00 CT.
US Indices Futures
- ES YSFG constructive, MSFG/WSFG below F0%, DTrend; support 7411.75, 7357.25, 7300.00; resistance 7693.50; long-term benchmarks rising.
- NQ YSFG constructive, MSFG/WSFG below F0%, DTrend; 27839.50-27892.50 support; 29018.00, 30562.50 and 31090.00 resistance; long-term benchmarks rising.
- YM YSFG/MSFG/WSFG above F0%, benchmarks rising; compression below 53656; support 51720 and 51184; 52844 reversal pivot; intermediate and long-term uptrend.
- EMD YSFG constructive, MSFG/WSFG below F0%, short-term pullback; support 3724.0, 3692.9, 3662.0; resistance 3847.2-3892.4; rising intermediate-term benchmarks.
- RTY YSFG/WSFG above F0%, MSFG below F0%; DTrend; support 2931.1, 2845.0, 2824.2; resistance 3011.1 and 3068.4; long-term benchmarks rising.
- FDAX YSFG/MSFG/WSFG above F0%, all benchmarks rising; support 25268-25026, 24920, 24715; resistance 25604-25610 and 26064; aligned uptrend.
Overall State
- Short-Term: Bearish
- Intermediate-Term: Neutral
- Long-Term: Bullish
Conclusion
ES, NQ, EMD and RTY retain short-term retracement structures, with MSFG and/or WSFG below F0% and lower pivot references active. YM and FDAX maintain stronger alignment above Fib-grid centers and rising benchmarks. Across all contracts, YSFG context and rising 100- and 200-period benchmarks maintain broadly upward long-term correlation. Key pivot resistance remains overhead following recent consolidation or pullback phases.
Note: Intra-day counter-trend pullbacks or retracements may occur, HTF is context for informational usage and market structure. Glossary: Session Fib Grids periods of YSFG:’Yearly’, MSFG:’Monthly’, WSFG:’Weekly’
For full details visit: AlphaWebTrader Technicals
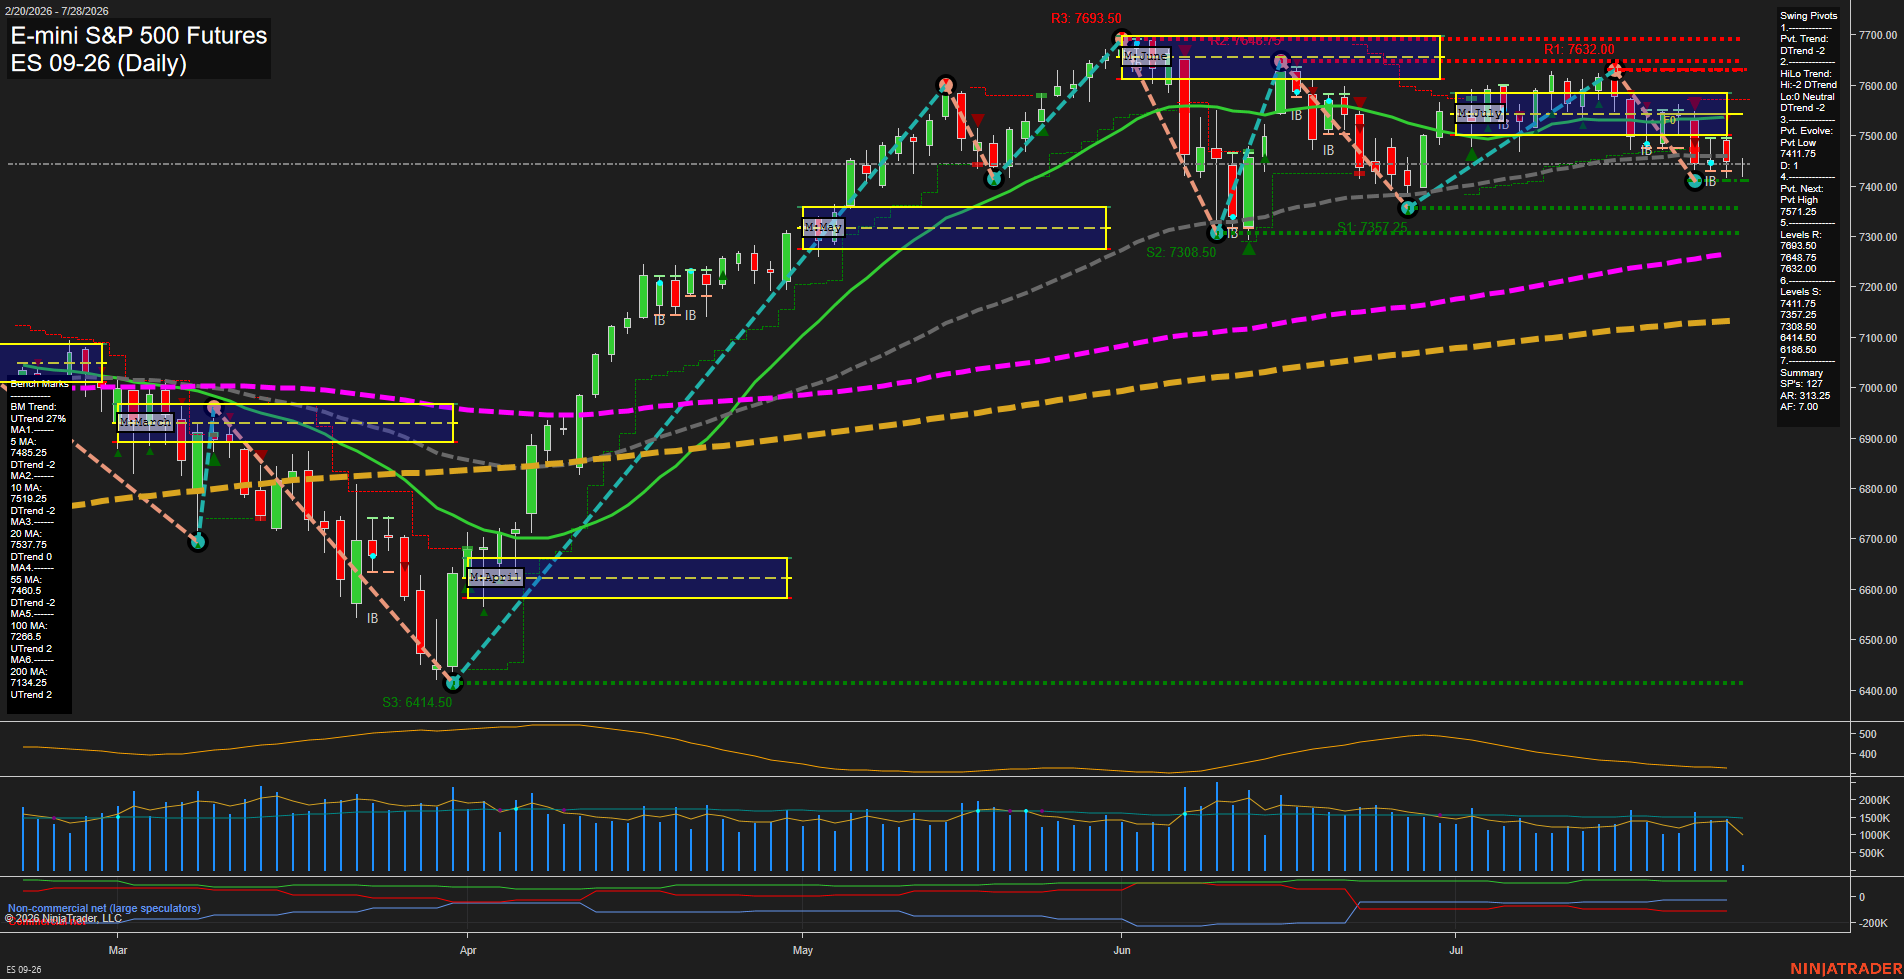
ES Daily View
Overall Rating
- Short-Term: Bearish
- Intermediate-Term: Bearish
- Long-Term: Bullish.
Key Insights Summary
ES is consolidating beneath the weekly and July monthly F0% levels after a sharp decline from the mid-July 7600 area. The short-term pivot structure remains in a DTrend, with price below the 5, 10, 20, and 55-day benchmarks and recent short signals aligned with the current downside swing. Small daily bars and slowing momentum reflect compression near the 7411.75 pivot-support area, while 7357.25 and 7308.50 define the next lower support structure. The broader 2026 trend remains constructive because price is still above rising 100-day and 200-day averages, making the current decline an intermediate pullback within a longer-term uptrend.
View charts on: AlphaWebTrader HTF Charts
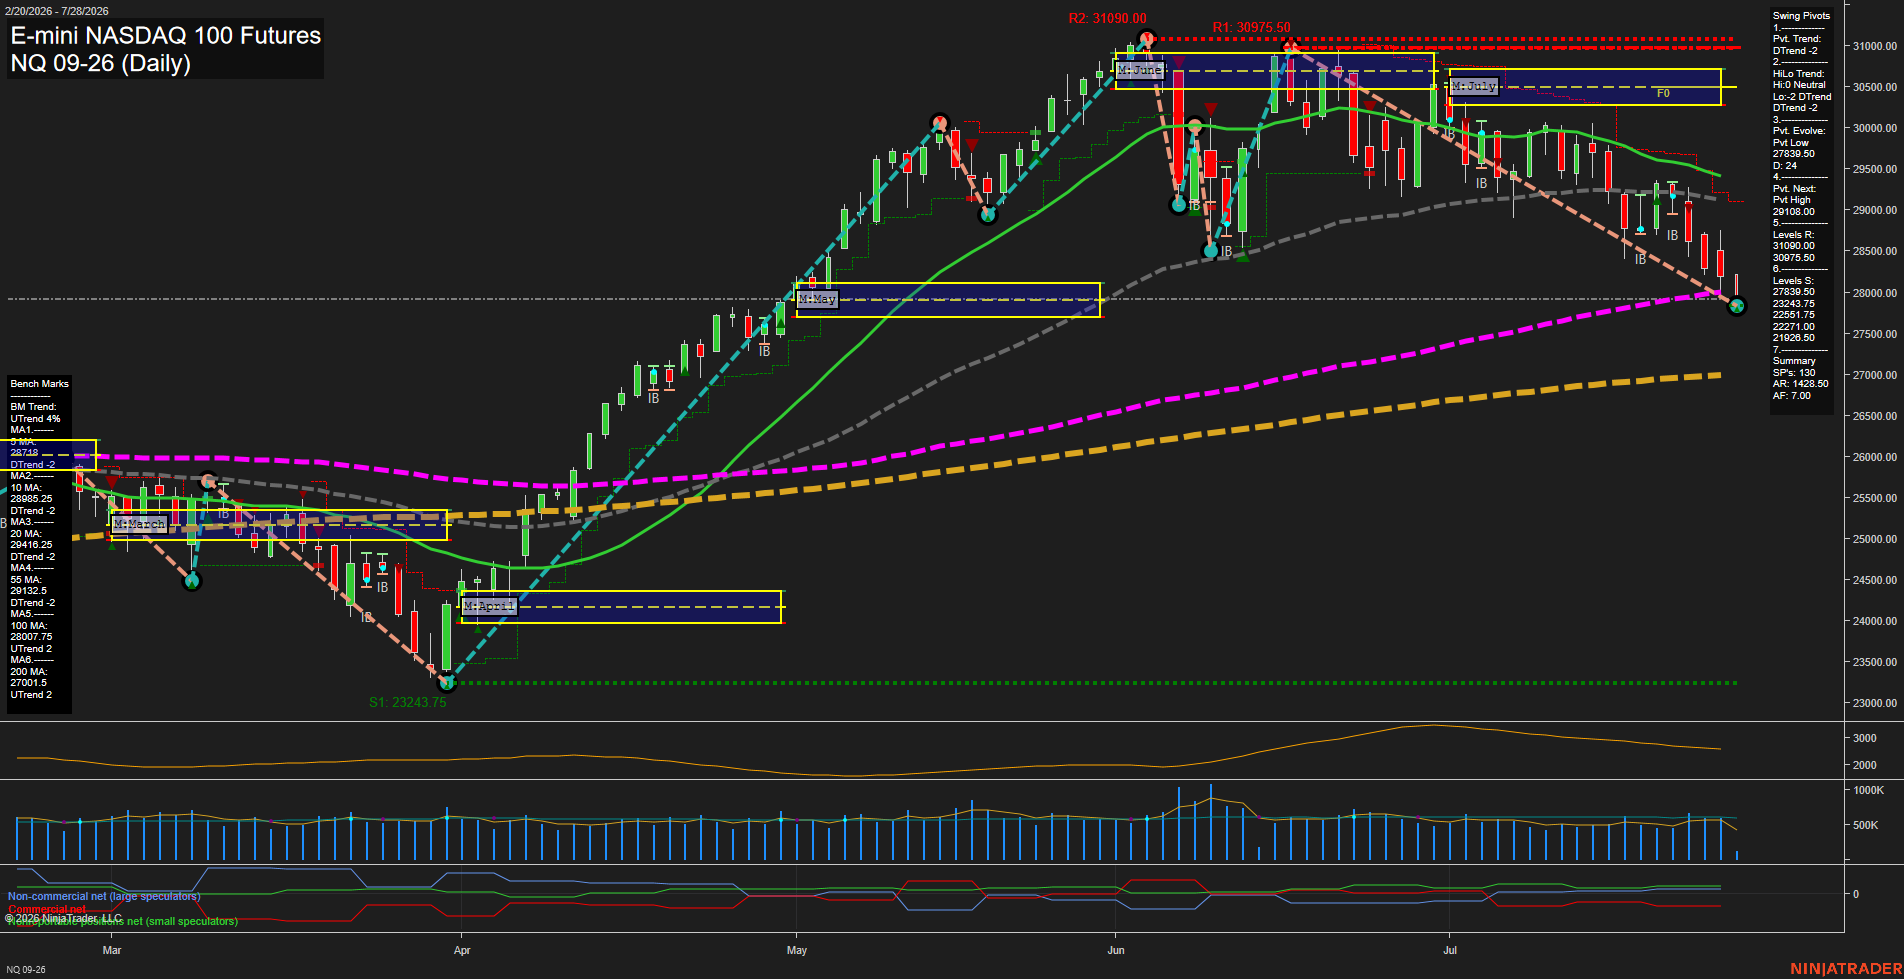
NQ Daily View
Overall Rating
- Short-Term: Bearish
- Intermediate-Term: Bearish
- Long-Term: Bullish.
Key Insights Summary
Price is in a fast short-term selloff, trading below the weekly and July monthly Fib-grid centers and beneath all short- and intermediate-term benchmarks. The daily pivot structure remains in DTrend, with the 27839.50 pivot low defining the immediate downside reference and 29018.00 the next pivot-high reversal threshold. The broader yearly structure remains constructive because price is still above rising 100-day and 200-day averages, framing the current decline as an intermediate corrective leg within a longer-term uptrend.
View charts on: AlphaWebTrader HTF Charts
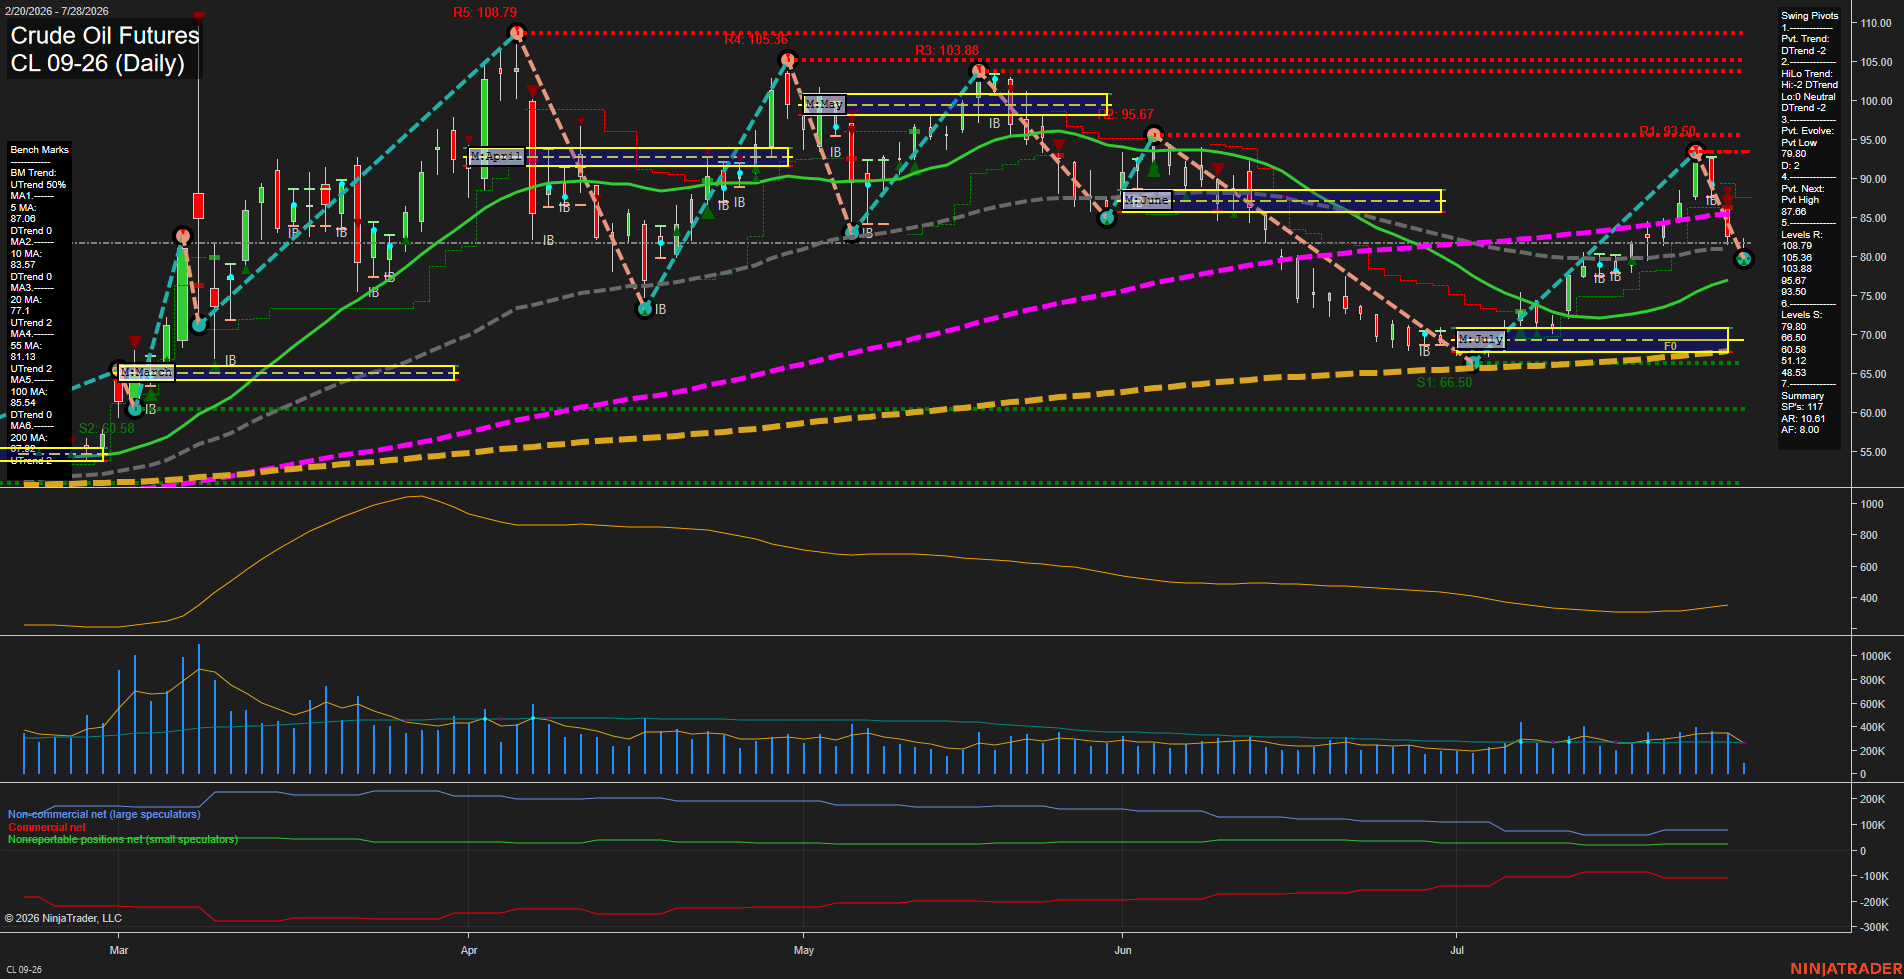
CL Daily View
Overall Rating
- Short-Term: Bearish
- Intermediate-Term: Neutral
- Long-Term: Neutral.
Key Insights Summary
Price action has reversed sharply lower from the late-July recovery high, producing a large-range decline beneath the 5-day, 10-day, 55-day, and 100-day benchmarks. The short-term pivot structure is in DTrend, with 87.66 defining the next upside pivot reversal level and 79.80 serving as immediate pivot support. Intermediate conditions are mixed: July MSFG remains above its F0% level and the 20-day and 55-day averages retain upward trends, while the HiLo pivot trend has turned down. The broader yearly grid remains positive above F0%, but the 100-day average is declining and the recent selloff has shifted the near-term swing cycle toward lower highs and renewed downside momentum.
View charts on: AlphaWebTrader HTF Charts
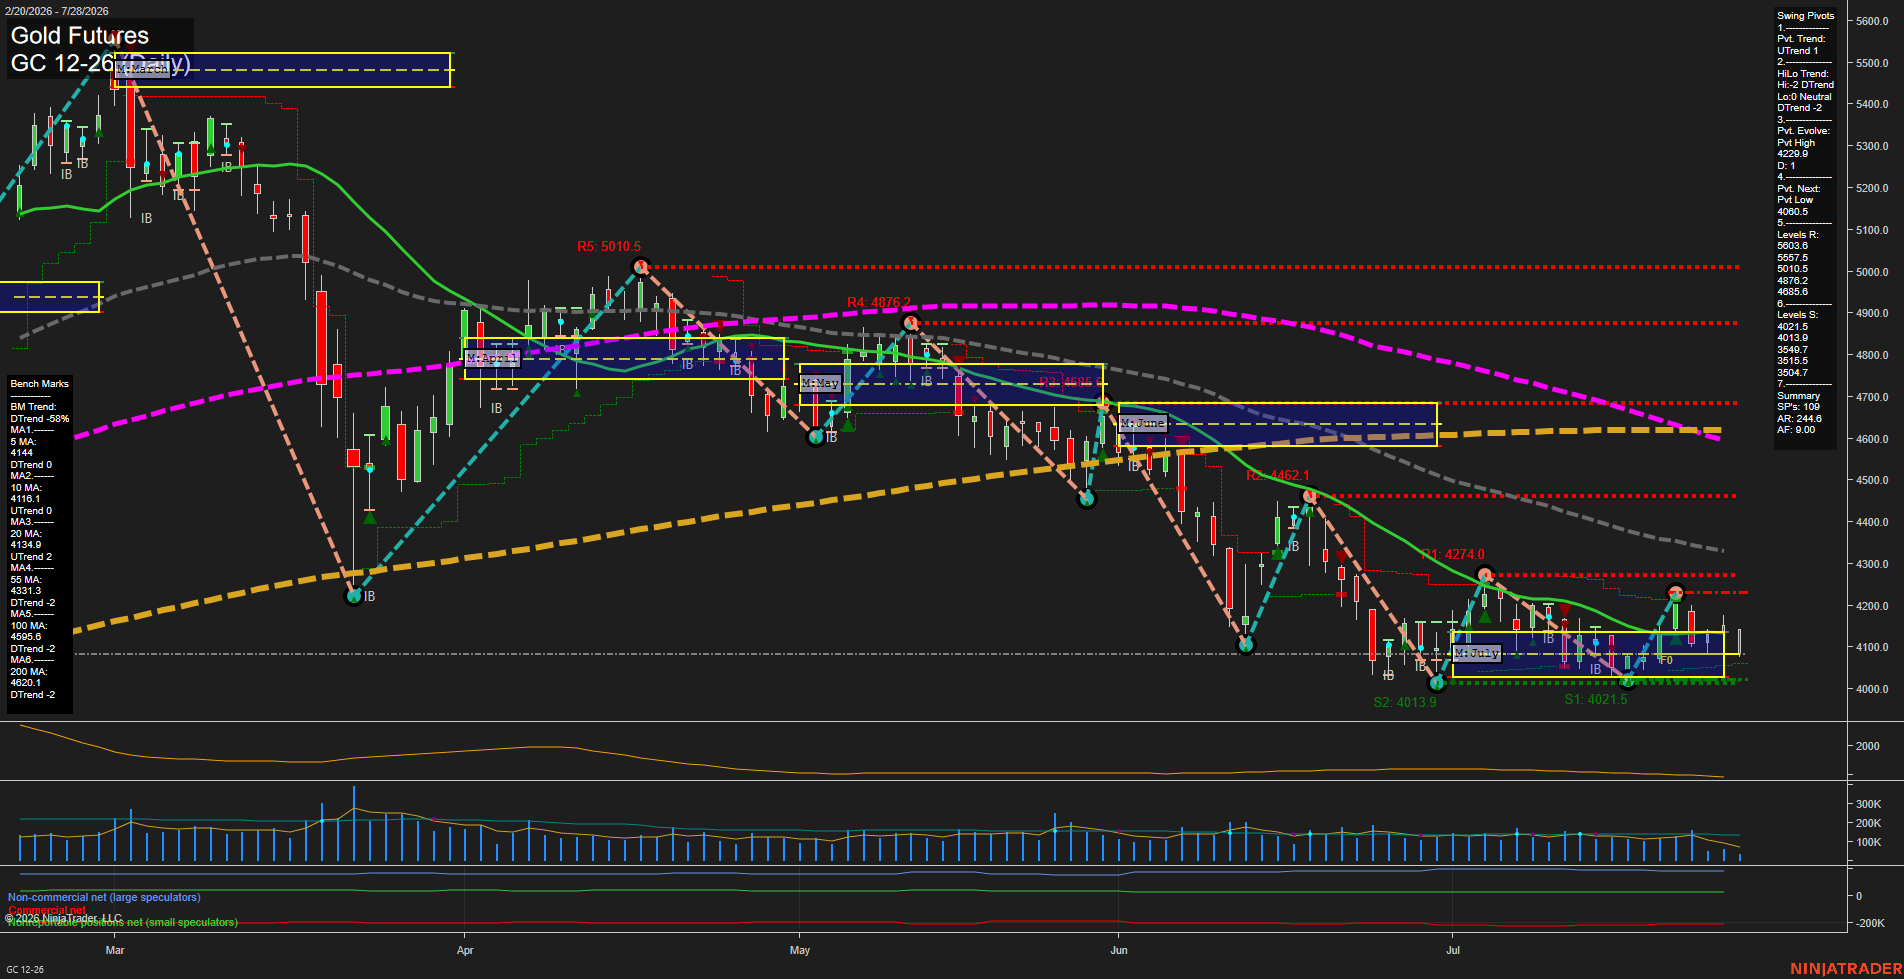
GC Daily View
Overall Rating
- Short-Term: Bearish
- Intermediate-Term: Neutral
- Long-Term: Bearish.
Key Insights Summary
Gold is consolidating in a narrow, low-momentum range near 4106 after a broader decline from the June and early-July highs. The short-term pivot has turned up, but price remains beneath the 5-day average and the weekly fib-grid bias is down, while the developing 4228.9 pivot high defines the nearby recovery ceiling. The 4021.5-4013.9 support cluster remains the dominant lower boundary, with the next pivot reversal level at 4060.5. Intermediate structure is mixed: July MSFG remains positive and the 20-day average is rising, but the HiLo trend and 55-day average remain down. Long-term conditions retain a bearish alignment, with price materially below the declining 100-day and 200-day benchmarks. Volume is subdued relative to earlier swings, consistent with consolidation rather than a high-participation directional expansion.
View charts on: AlphaWebTrader HTF Charts