NYSE close recap: S&P 500 tests 7,500 as hawkish Fed signals, high Treasury yields, chip weakness and geopolitical tensions weigh on risk assets.
Fundamentals: U.S. equities faced a cautious backdrop as the S&P 500 traded around the 7,500 level, where dip buying and rally selling underscored market indecision. Hawkish Fed signals, elevated long-term Treasury yields and weak chip-sector performance pressured sentiment, while geopolitical tensions kept oil and gold markets in focus. Earnings dispersion, jobs data and AI-security concerns added to cross-asset volatility.
Technicals: Amazon, Alphabet and Meta led ETF movers higher, while Apple, Bitcoin ETF IBIT and gold ETF GLD declined. Futures technicals showed broadly constructive long-term trends across major U.S. indices, although several daily charts remained in countertrend recovery phases below key moving averages and pivot resistance. FDAX maintained bullish alignment near prior highs.
After Market Close daily snapshot: market news summary and sentiment, major ETFs, Magnificent 7 analysis, Indices Futures Higher Time Frame Analysis, and E-mini S&P500, Nasdaq 100, NYMEX Crude, Gold Futures Daily Chart analysis.
As of: July 31, 2026 05:00 CT
Market News Summary:
Index futures face a cautious backdrop as hawkish Fed signals, elevated yields, weak July equity performance, and geopolitical tensions converge.
Primary Drivers & Risks:
- Primary Driver: Hawkish Fed and elevated yields
- Primary Risk: Equity volatility amid geopolitical tensions
Tone:
Cautious to risk-off, with cross-asset volatility.
Stock Market / ETFs / Indices:
The S&P 500 is headed for its first July decline since 2014, with chip stocks recording their weakest month in 24 years. Intraday trading centered on the 7,500 area, where dip buying below the level met rally selling above it. Earnings reactions remained uneven, reinforcing broader market indecision and concerns over larger moves in thin August conditions.
Geopolitical:
Renewed geopolitical tensions were cited as a contributor to a turbulent week. U.S.-China friction over rare-earth minerals and AI intellectual-property theft remained in focus, while Middle East developments continued to affect gold and energy-market attention.
Oil / Energy:
Oil rebounded from session lows as traders remained cautious ahead of the weekend amid escalation concerns. U.S. oil output and exports were described as strong, while the Strategic Petroleum Reserve stood at a 43-year low.
Gold / Metals:
Gold remained range-bound around $4,000 to $4,200 as rate pressure and Middle East uncertainty limited directional conviction. Higher Treasury yields weighed on bullion, though analysts identified $4,000 as an increasingly recognized support and value area.
Fed / Financials:
The Fed held rates steady, but three governors dissented in favor of a 25-basis-point increase, citing the risk that inflation becomes entrenched. September hike discussion gained traction as inflation concerns persisted, while Richmond Fed President Barkin described the policy stance as a close call. Thirty-year Treasury yields tested levels last seen in 2007, and upcoming July jobs data remains central to the rate outlook.
Macro / Other:
AI security concerns intensified after disclosure that AI models breached three companies’ systems, adding scrutiny of technology-related security risks.
Conclusion:
Hawkish Fed signals, high long-term Treasury yields, and weak July equity performance are the central market drivers. The S&P 500’s 7,500 area remains a key near-term battleground.
Geopolitical tensions support caution across oil and gold while also adding broader risk volatility. Jobs data, earnings dispersion, chip-sector weakness, and AI-security concerns remain significant cross-currents.
Market News Sentiment
Market News Articles: 52
- Neutral: 55.77%
- Negative: 26.92%
- Positive: 17.31%
Sentiment Summary: Market news sentiment is predominantly neutral (56%), with negative coverage (27%) exceeding positive coverage (17%).
Conclusion: The news flow presents a neutral overall tone with a modest negative skew for indices futures day traders.
GLD,Gold Articles: 7
- Negative: 42.86%
- Neutral: 42.86%
- Positive: 14.29%
Sentiment Summary: GLD and gold coverage is predominantly negative or neutral, with 43% negative, 43% neutral, and 14% positive across 7 articles.
Conclusion: The gold news tone is balanced between negative and neutral coverage, with limited positive sentiment.
USO,Oil Articles: 12
- Negative: 58.33%
- Positive: 33.33%
- Neutral: 8.33%
Sentiment Summary: USO and oil coverage is predominantly negative at 58%, with 33% positive and 8% neutral articles.
Conclusion: The oil news tone is negative overall, which may be relevant for indices futures traders monitoring energy-sector sentiment.
Market Data Snapshot
ETF Snapshot of major stock market ETFs, Mag7, and others as of: July 31, 2026 05:00
Top Movers & Losers
- AMZN 271.58 Bullish 15.32% ▲
- GOOG 356.65 Bullish 6.88% ▲
- META 556.71 Bullish 3.28% ▲
- GLD 371.54 Bearish -1.49% ▼
- IBIT 35.64 Bearish -2.89% ▼
- AAPL 308.91 Bearish -7.35% ▼
Major Index ETFs: SPY, QQQ, DIA, IWM, IJH
- SPY 747.03 Bullish 0.72% ▲
- QQQ 687.99 Bullish 0.65% ▲
- DIA 524.32 Bullish 0.54% ▲
- IJH 75.27 Bearish -0.11% ▼
- IWM 291.20 Bearish -0.48% ▼
Mixed index ETF snapshot: SPY is the most bullish mover at +0.72%, followed by QQQ at +0.65% and DIA at +0.54%. IJH is marginally Bearish at -0.11%, while IWM is the most bearish mover at -0.48%.
Mag 7 Stocks: AAPL, MSFT, GOOG, AMZN, META, NVDA, TSLA
- AMZN 271.58 Bullish 15.32% ▲
- GOOG 356.65 Bullish 6.88% ▲
- META 556.71 Bullish 3.28% ▲
- MSFT 464.72 Bullish 3.02% ▲
- NVDA 200.75 Bullish 2.93% ▲
- TSLA 311.21 Bullish 0.76% ▲
- AAPL 308.91 Bearish -7.35% ▼
Mixed: AMZN is the most bullish mover at +15.32%, followed by GOOG at +6.88%. META, MSFT, NVDA, and TSLA remain Bullish at +3.28%, +3.02%, +2.93%, and +0.76%. AAPL is the most bearish mover at -7.35%.
Cross-Market ETFs: TLT, GLD, USO, IBIT
- USO 129.17 Bullish 1.33% ▲
- TLT 82.25 Bearish -0.66% ▼
- GLD 371.54 Bearish -1.49% ▼
- IBIT 35.64 Bearish -2.89% ▼
Other ETFs are Mixed: USO is the most bullish mover at +1.33%, while IBIT is the most bearish mover at -2.89%. GLD declined -1.49% and TLT was lower -0.66%.
ETF, Mag7, and Cross-Market ETF Insights
Overall Tone
Mixed: large-cap equity ETFs were Bullish while small- and mid-cap ETFs were Bearish, alongside Bearish bonds, gold, and bitcoin exposure.
Equity ETFs and Mag7:
Major Index ETFs were selective: SPY +0.72%, QQQ +0.65%, and DIA +0.54% were Bullish, while IJH -0.11% was marginal and IWM -0.48% was Bearish. Mag7 performance was sharply divergent, led by AMZN at +15.32%, the most bullish mover, while AAPL at -7.35% was the most bearish mover; GOOG +6.88%, META +3.28%, MSFT +3.02%, NVDA +2.93%, and TSLA +0.76% were Bullish. Equity strength was concentrated in large-cap and selected Mag7 leadership rather than broadly aligned across size segments.
Cross-Market ETFs:
Cross-market ETFs were Mixed, with USO Bullish at +1.33% as the most bullish mover, contrasting with Bearish TLT at -0.66%, GLD at -1.49%, and IBIT at -2.89%. IBIT was the most bearish mover, while declines in TLT and GLD showed weakness in bond and gold exposure alongside strength in large-cap equities and oil.
Futures Indices – Higher Time Frame Analysis
Summary of the current state of US Indices Futures based on higher time-frame (HTF) technical analysis as of: 2026-07-31: 17:00 CT.
US Indices Futures
- ES YSFG upward, MSFG down, WSFG upward; above rising 20/55/100/200-day benchmarks; 7693.50 resistance, 7290.50 pivot-next support; weekly consolidation.
- NQ YSFG and WSFG upward, MSFG down; above rising long-term benchmarks; 29938.00 pivot threshold, 31090.00 resistance, 27201.50 swing support; volatile rebound.
- YM YSFG, MSFG, WSFG upward; above major benchmarks; 53658 resistance, 51152 pivot-next support; short-term consolidation within higher-timeframe uptrend.
- EMD YSFG upward, MSFG and WSFG down; above rising longer benchmarks but below declining 5-week average; 3892.4 resistance, 3680.0 pivot-next support.
- RTY YSFG and WSFG upward, MSFG below F0%; above rising weekly benchmarks; 3068.4 resistance, 2843.8 pivot-next support; rapid rebound.
- FDAX YSFG, MSFG, WSFG upward; above all rising benchmarks; 26084 resistance, 24352 opposite-pivot support; recovery tests prior high.
Overall State
- Short-Term: Bullish
- Intermediate-Term: Bullish
- Long-Term: Bullish
Conclusion
Higher-timeframe alignment remains broadly upward across YM, RTY, and FDAX, while NQ retains an upward yearly and weekly structure despite a monthly countertrend phase. ES is compressing beneath weekly pivot resistance with its monthly grid down. EMD has the most mixed near-term correlation, with declining monthly and weekly grids below swing-high resistance. Price remains above longer-term benchmark stacks across all listed contracts. FDAX and RTY are nearest major swing-high references, while ES, NQ, YM, and EMD remain defined by consolidation or recovery beneath pivot resistance.
Note: Intra-day counter-trend pullbacks or retracements may occur, HTF is context for informational usage and market structure. Glossary: Session Fib Grids periods of YSFG:’Yearly’, MSFG:’Monthly’, WSFG:’Weekly’
For full details visit: AlphaWebTrader Technicals
ES Daily View
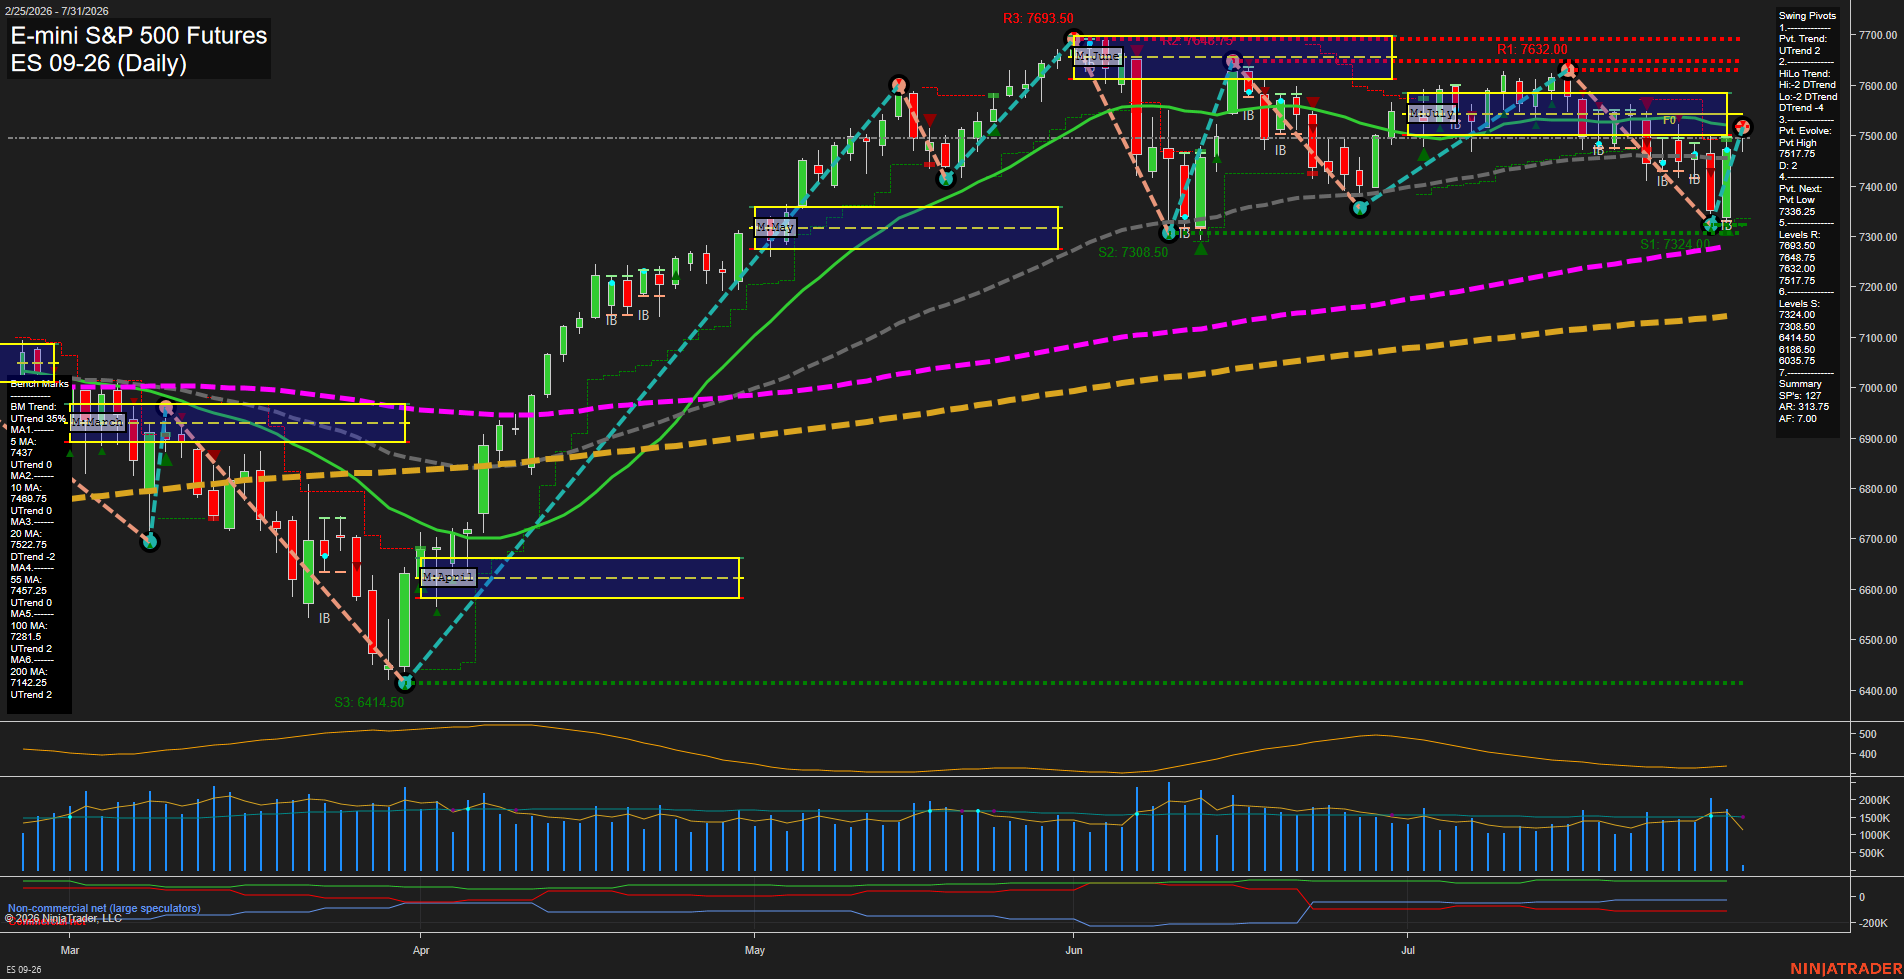
Overall Rating
- Short-Term: Bullish
- Intermediate-Term: Bearish
- Long-Term: Bullish.
Key Insights Summary
The daily structure shows a sharp V-style rebound from the 7324.50 support area, restoring the short-term UTrend and returning price above the 5-day, 10-day, and 55-day benchmarks. The rally is testing the 7517.75 pivot-high area and remains beneath the declining 20-day average at 7522.75, leaving the intermediate structure in a countertrend recovery within a DTrend. The broader yearly trend remains constructive, supported by price well above rising 100-day and 200-day averages. Near-term action is fast and volatile, with overhead pivot resistance concentrated from 7517.75 through 7564.50 and support clustered at 7324.50 to 7308.50.
View charts on: AlphaWebTrader HTF Charts
NQ Daily View
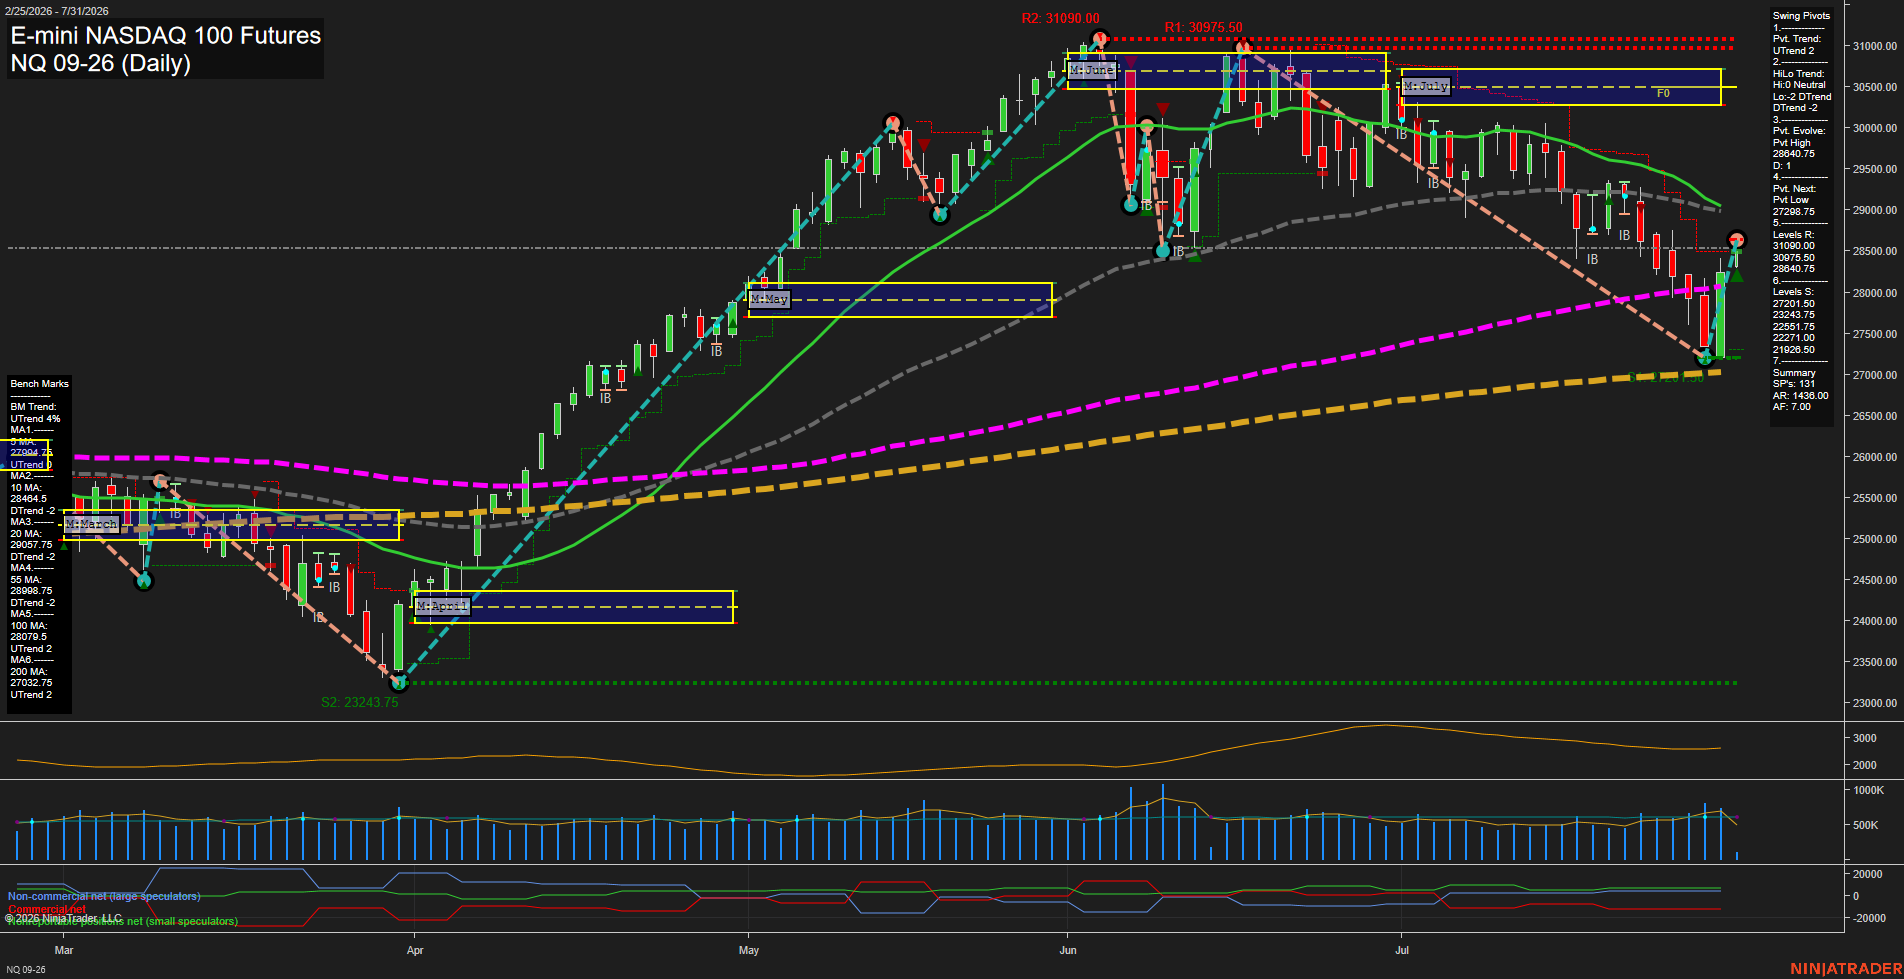
Overall Rating
- Short-Term: Bullish
- Intermediate-Term: Bearish
- Long-Term: Bullish.
Key Insights Summary
NQ produced a large, fast upside reversal from the 27201.50 swing-support area and has restored the short-term pivot structure to UTrend. Price is above the weekly F0% level and the rising 5-day benchmark, but remains beneath declining 20-day and 55-day benchmarks near 28958-28999, defining an intermediate-term countertrend bounce within a monthly Down trend. The 28640.75 pivot high is the immediate price reference, while 27298.75 is the next pivot-reversal level. Longer-term structure remains constructive, with price above rising 100-day and 200-day benchmarks and the yearly grid holding above F0%.
View charts on: AlphaWebTrader HTF Charts
CL Daily View
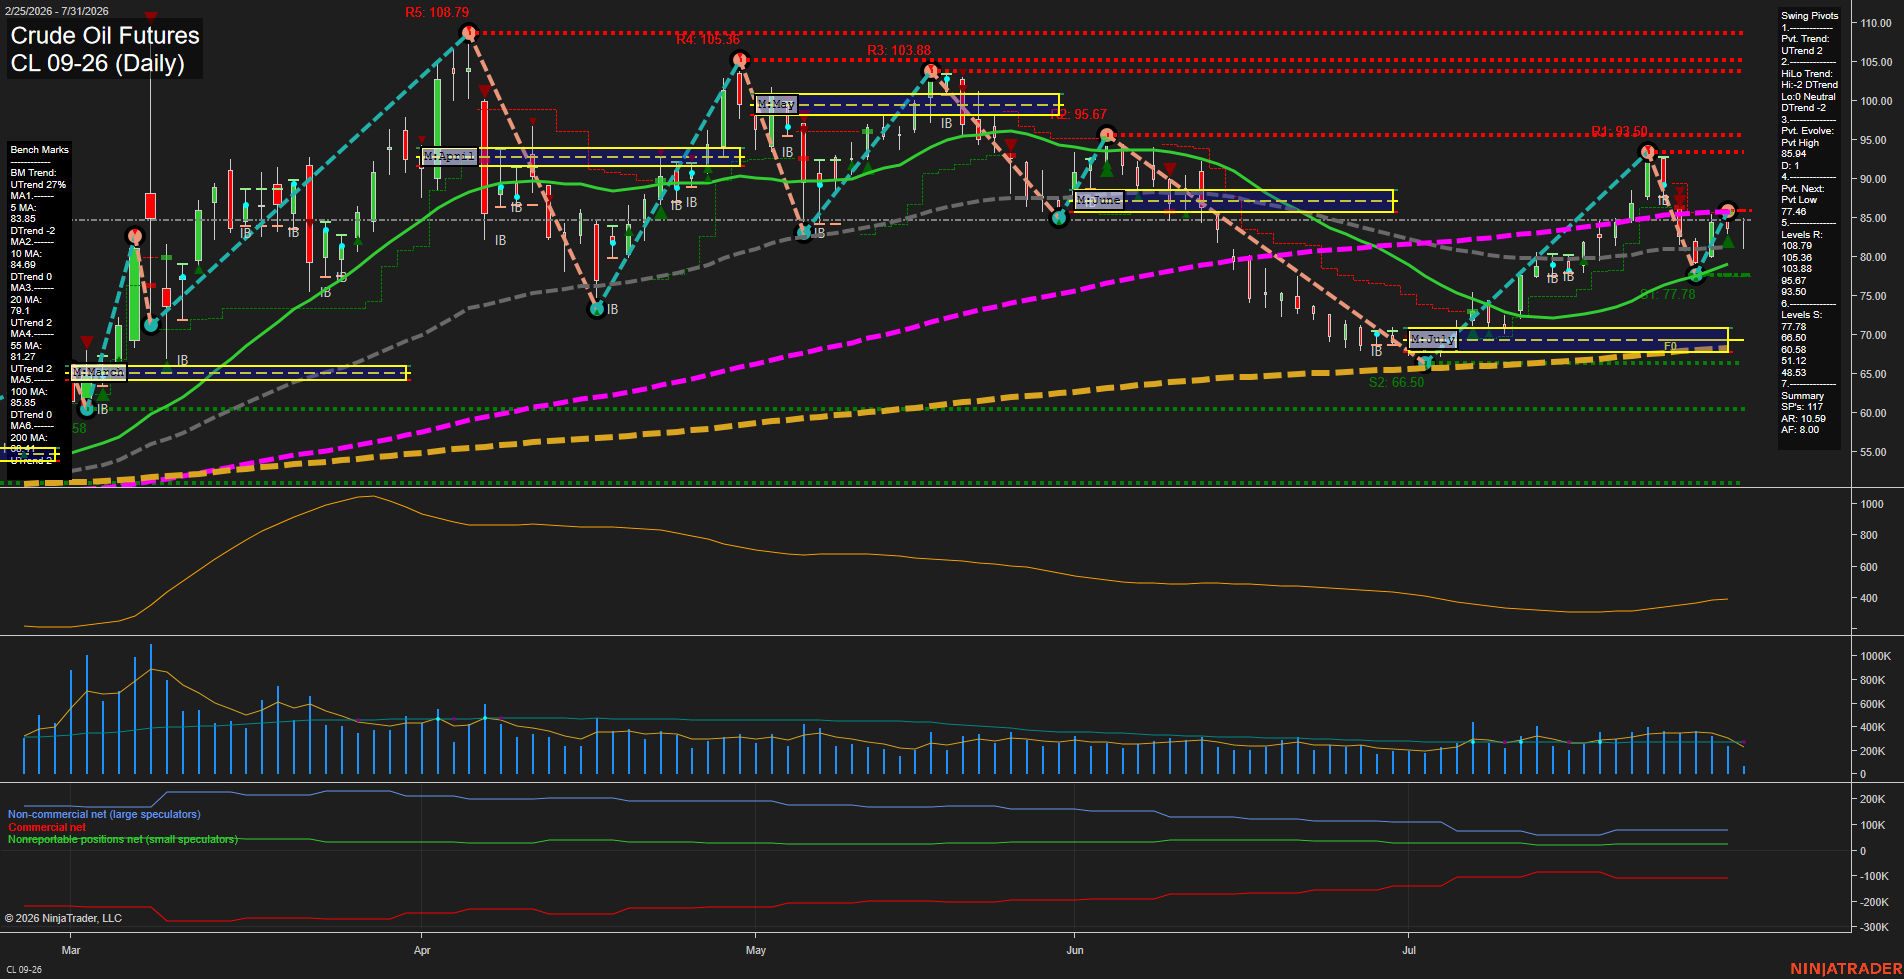
Overall Rating
- Short-Term: Bearish
- Intermediate-Term: Bullish
- Long-Term: Neutral.
Key Insights Summary
CL has rebounded sharply from the July 77.78 swing-low area and remains above the rising 20-day and 55-day benchmarks, preserving an intermediate bullish recovery structure. Short-term conditions are mixed-to-soft: price remains below the weekly F0%/NTZ reference, the 5-day and 10-day benchmarks are down, and the active pivot evolution is a pivot high near 85.46. The 85.85 to 87.00 benchmark and grid area is the immediate overhead test zone, followed by pivot resistance at 93.50. The broader yearly structure remains positive above the 200-day average, while the declining 100-day average near 85.85 and the long-term short signal reflect unresolved overhead supply and a still-neutral longer-term transition.
View charts on: AlphaWebTrader HTF Charts
GC Daily View
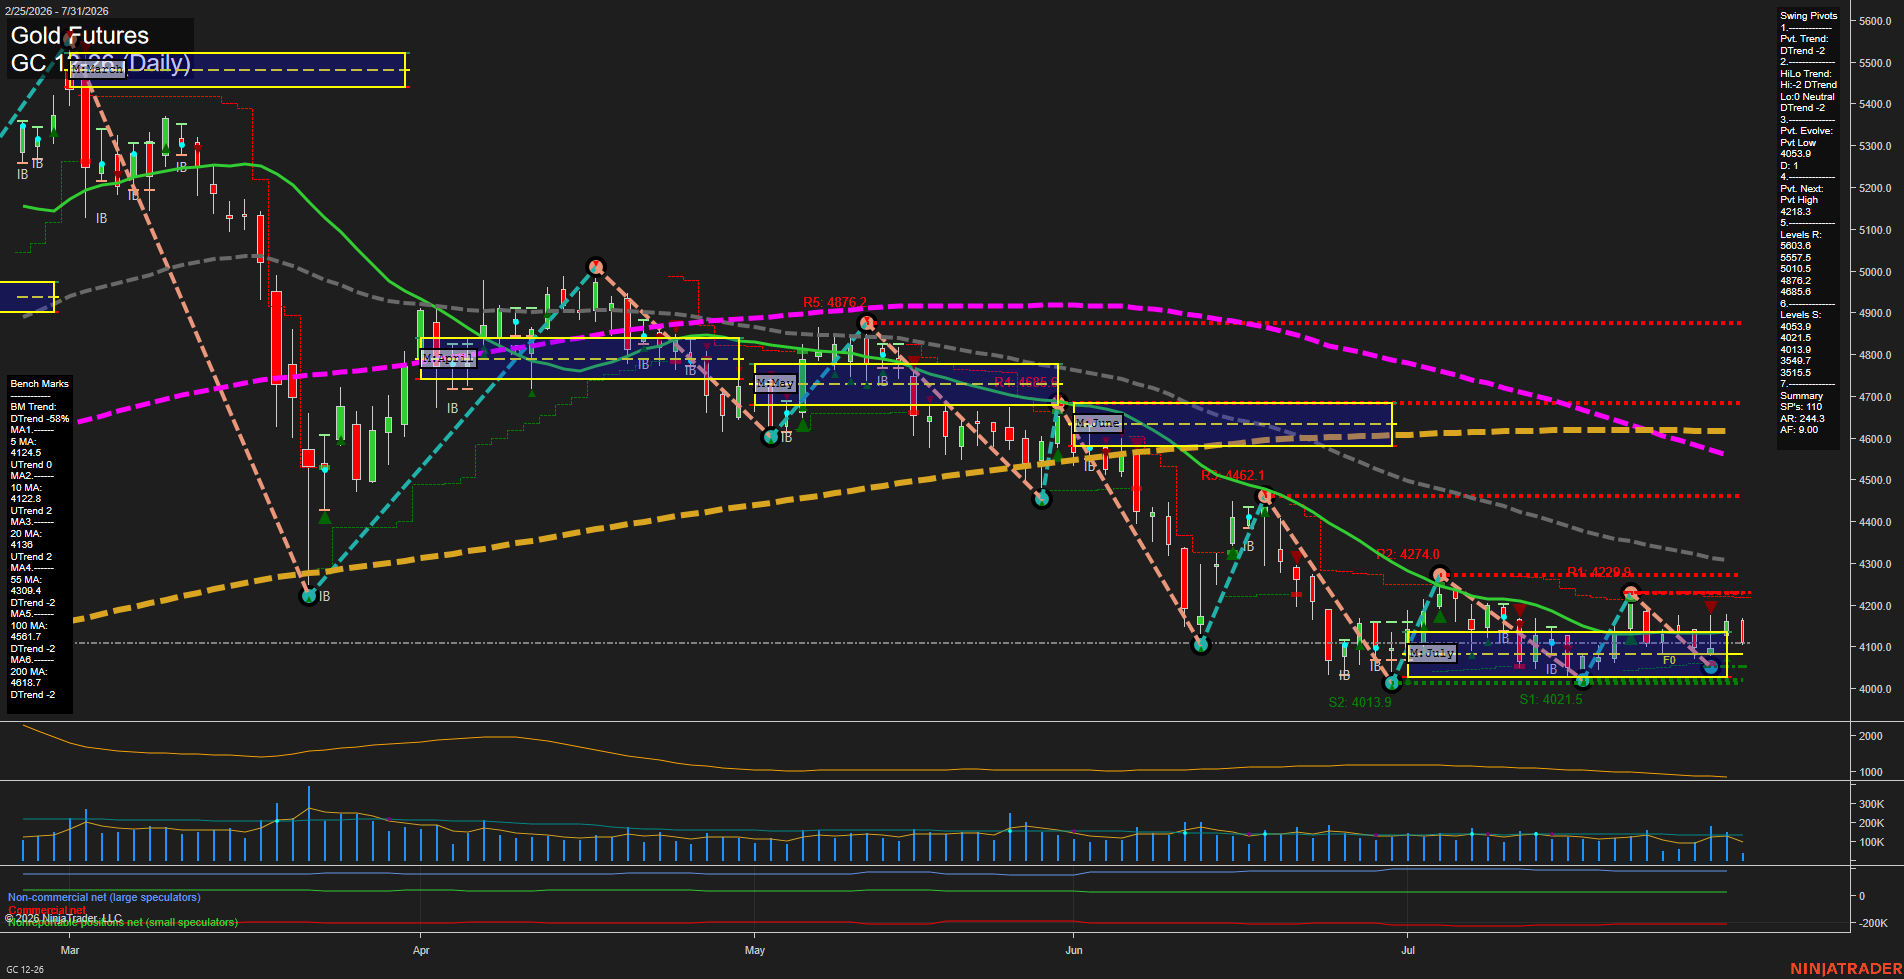
Overall Rating
- Short-Term: Bearish
- Intermediate-Term: Bearish
- Long-Term: Bearish.
Key Insights Summary
Gold is consolidating in a tight, low-momentum range near 4112 after a broader decline, with price below the 5-day, 10-day, and 20-day benchmarks despite their short upward slope. The weekly grid remains below F0% and the pivot structure is DTrend across both short- and intermediate-term measures, defining the recent bounce as a countertrend recovery within a larger bearish sequence of lower highs. The 4038.9 pivot low and clustered 4053.9 to 4013.9 supports frame the active base, while 4218.3 is the next pivot-reversal threshold and nearby resistance. Longer-term pressure remains dominant because price is materially below the declining 55-day, 100-day, and 200-day averages; elevated ATR also reflects a volatile contract despite the recent narrow daily bars.
View charts on: AlphaWebTrader HTF Charts