U.S. stocks rallied as Iran peace hopes pushed oil lower and earnings supported sentiment, while inflation risks and elevated Treasury yields persisted.
Fundamentals: U.S. equities rose as signs of potential U.S.-Iran talks and a possible reopening of the Strait of Hormuz helped send WTI crude down more than 6%, easing immediate energy-supply concerns. Strong earnings and improved S&P 500 valuation commentary supported risk appetite, while resilient manufacturing data, pricing pressures and a 5.28% 30-year Treasury yield kept inflation and rate risks in focus.
Technicals: U.S. equity ETFs saw gains in META, Microsoft and Amazon, while Apple and oil-linked USO declined. Futures analysis showed bullish multi-timeframe structures in ES, YM and FDAX, with price near key resistance areas. NQ remained long-term constructive but faced an intermediate correction, while EMD and RTY reflected short-term consolidation within broader upward trends.
After Market Close daily snapshot: market news summary and sentiment, major ETFs, Magnificent 7 analysis, Indices Futures Higher Time Frame Analysis, and E-mini S&P500, Nasdaq 100, NYMEX Crude, Gold Futures Daily Chart analysis.
As of: August 3, 2026 05:00 CT
Market News Summary:
U.S. equities rallied as Iran peace hopes drove a sharp oil decline, while strong earnings supported the S&P 500 amid inflation and rate concerns.
Primary Drivers & Risks:
- Primary Driver: Oil plunge and equity earnings strength
- Primary Risk: Inflation pressure and elevated bond yields
Tone:
Constructive for equities, with notable macro and geopolitical cross-currents.
Stock Market / ETFs / Indices:
Stocks rallied during the session as Iran peace hopes improved risk sentiment and crude prices fell. Deutsche Bank raised its 2026 S&P 500 earnings outlook, while reports cited strong corporate results, falling valuations, and healthy market breadth. Semiconductor trading remained pressured by AI-capex headline anxiety despite no reported production slowdown.
Geopolitical:
Signals of potential U.S.-Iran talks and reopening the Strait of Hormuz reduced immediate oil-supply concerns. Iran war risk remained a background issue, particularly through its potential effect on fuel supplies.
Oil / Energy:
WTI crude fell more than 6% after delayed Iran strikes and diplomacy signals eased disruption fears. U.S. oil exports fell to an eight-month low in July after Middle Eastern supply had increased, while Williams announced a $5.5 billion Momentum Midstream acquisition and raised its profit outlook.
Gold / Metals:
Gold steadied around the $4,000 area as lower crude prices and Treasury yields eased inflation concerns, although reduced safe-haven demand and a firmer dollar limited gains. Strong manufacturing data and persistent inflation concerns maintained pressure on the metal through Fed-rate expectations.
Fed / Financials:
July ISM manufacturing conditions reached their strongest level since May 2022, while surveyed companies reported pricing volatility exceeding pandemic-era concerns. Long-dated Treasury selling pushed the 30-year yield to 5.28%, a 19-year high, as markets reassessed the Fed response to inflation.
Macro / Other:
Commodities outperformed major asset classes in July following a rebound from June’s sharp selloff. Currency markets remained focused on the yen after joint U.S.-Japan intervention.
Conclusion:
Equity sentiment was supported by strong corporate earnings, improved valuation commentary, and reduced immediate Middle East oil-disruption concerns. The crude-oil selloff also eased inflation pressure across markets.
Strong manufacturing activity, persistent pricing concerns, and high long-term Treasury yields remained important rate-sensitive risks. Iran-related developments and oil-market headlines continued to provide a significant cross-current.
Market News Sentiment
Market News Articles: 31
- Neutral: 45.16%
- Positive: 29.03%
- Negative: 25.81%
Sentiment Summary: Market news sentiment is predominantly neutral (45%), with positive coverage (29%) slightly exceeding negative coverage (26%).
Conclusion: Indices futures traders face a broadly balanced news backdrop, with no dominant directional sentiment signal.
GLD,Gold Articles: 13
- Neutral: 38.46%
- Positive: 38.46%
- Negative: 23.08%
Sentiment Summary: GLD and gold coverage is balanced, with 38% positive, 38% neutral, and 23% negative sentiment across 13 articles.
Conclusion: Gold-related news tone is mixed-to-neutral, with positive and neutral coverage equally represented.
USO,Oil Articles: 10
- Negative: 40.00%
- Neutral: 30.00%
- Positive: 30.00%
Sentiment Summary: Oil coverage is mixed with a negative tilt, with 40% negative, 30% neutral, and 30% positive articles.
Conclusion: For indices futures day traders, oil-related news tone is slightly negative overall, while neutral and positive coverage each represent 30% of articles.
Market Data Snapshot
ETF Snapshot of major stock market ETFs, Mag7, and others as of: August 3, 2026 05:00
Top Movers & Losers
- META 590.24 Bullish 6.02% ▲
- MSFT 487.65 Bullish 4.93% ▲
- AMZN 284.02 Bullish 4.58% ▲
- TLT 82.19 Bearish -0.07% ▼
- AAPL 303.42 Bearish -1.78% ▼
- USO 122.12 Bearish -5.46% ▼
Major Index ETFs: SPY, QQQ, DIA, IWM, IJH
- QQQ 700.07 Bullish 1.76% ▲
- IWM 296.22 Bullish 1.72% ▲
- SPY 757.67 Bullish 1.42% ▲
- DIA 531.22 Bullish 1.32% ▲
- IJH 76.11 Bullish 1.12% ▲
Major index ETFs were Bullish across the board: QQQ led with +1.76%, followed by IWM at +1.72% and SPY at +1.42%. DIA gained +1.32%, while IJH was the least positive mover at +1.12%.
Mag 7 Stocks: AAPL, MSFT, GOOG, AMZN, META, NVDA, TSLA
- META 590.24 Bullish 6.02% ▲
- MSFT 487.65 Bullish 4.93% ▲
- AMZN 284.02 Bullish 4.58% ▲
- GOOG 372.47 Bullish 4.44% ▲
- TSLA 322.08 Bullish 3.49% ▲
- NVDA 206.64 Bullish 2.93% ▲
- AAPL 303.42 Bearish -1.78% ▼
Mixed: META is the most bullish mover at +6.02%, followed by MSFT +4.93%, AMZN +4.58%, GOOG +4.44%, TSLA +3.49%, and NVDA +2.93%. AAPL is the most bearish mover at -1.78%, contrasting with broad Bullish strength across the remaining names.
Cross-Market ETFs: TLT, GLD, USO, IBIT
- IBIT 36.16 Bullish 1.46% ▲
- GLD 371.71 Bullish 0.05% ▲
- TLT 82.19 Bearish -0.07% ▼
- USO 122.12 Bearish -5.46% ▼
Mixed cross-market snapshot: IBIT is the most bullish mover at +1.46%, while USO is the most bearish mover at -5.46%. GLD is marginally Bullish at +0.05%, and TLT is near-flat Bearish at -0.07%.
ETF, Mag7, and Cross-Market ETF Insights
Overall Tone
Overall tone is Bullish, led by broad gains across major equity ETFs and most Mag7 names, while cross-market action is Mixed.
Equity ETFs and Mag7:
Major equity ETFs were broadly Bullish: QQQ +1.76% led, followed by IWM +1.72%, SPY +1.42%, DIA +1.32%, and IJH +1.12% as the least positive index ETF. Mag7 participation was mostly Bullish, led by META +6.02%, the most bullish mover, with MSFT +4.93%, AMZN +4.58%, GOOG +4.44%, TSLA +3.49%, and NVDA +2.93%; AAPL -1.78% was the most bearish mover. Equities were broadly aligned Bullish, though Mag7 leadership was selective because AAPL was Bearish.
Cross-Market ETFs:
Cross-market ETFs were Mixed: IBIT +1.46% was the most bullish mover, while GLD +0.05% was marginally Bullish. TLT -0.07% was near-flat and Bearish, while USO -5.46% was the most bearish mover, diverging sharply from Bullish equities.
Futures Indices – Higher Time Frame Analysis
Summary of the current state of US Indices Futures based on higher time-frame (HTF) technical analysis as of: 2026-08-03: 17:00 CT.
US Indices Futures
- ES Weekly/Daily bullish, YSFG/MSFG/WSFG above F0%, benchmarks rising, UTrend, 7693.50 resistance, 7303.50 pivot support.
- NQ Long-term bullish above YSFG, weekly corrective below MSFG/WSFG, daily rebound tests 28725.75; 29938.00 resistance, 27231.50 support.
- YM Weekly/Daily bullish, YSFG/MSFG/WSFG above F0%, all benchmarks rising, higher-high structure, 53656 resistance, 51630 support.
- EMD Intermediate/long-term bullish above MSFG/YSFG and major benchmarks; short-term consolidation, 3892.4 resistance, 3733.7 pivot, 3667.8 support.
- RTY Weekly bullish above Fib grids and benchmarks; daily DTrend consolidation, 3068.4 resistance, 2902.3 support, 2852.8 reversal threshold.
- FDAX Weekly/Daily bullish, YSFG/MSFG/WSFG above F0%, all benchmarks rising, UTrend, 26117 resistance, 25391 pivot support.
Overall State
- Short-Term: Neutral
- Intermediate-Term: Bullish
- Long-Term: Bullish
Conclusion
ES, YM, and FDAX retain aligned bullish HTF structures, holding above rising benchmarks and Fib-grid balance zones. EMD and RTY remain bullish on intermediate and long-term measures while daily consolidation persists. NQ maintains long-term upside structure above YSFG and major benchmarks, though weekly correction and daily countertrend conditions remain active. Key resistance is concentrated near recent pivot highs, while nearby pivot-low and benchmark areas define structural support.
Note: Intra-day counter-trend pullbacks or retracements may occur, HTF is context for informational usage and market structure. Glossary: Session Fib Grids periods of YSFG:’Yearly’, MSFG:’Monthly’, WSFG:’Weekly’
For full details visit: AlphaWebTrader Technicals
ES Daily View
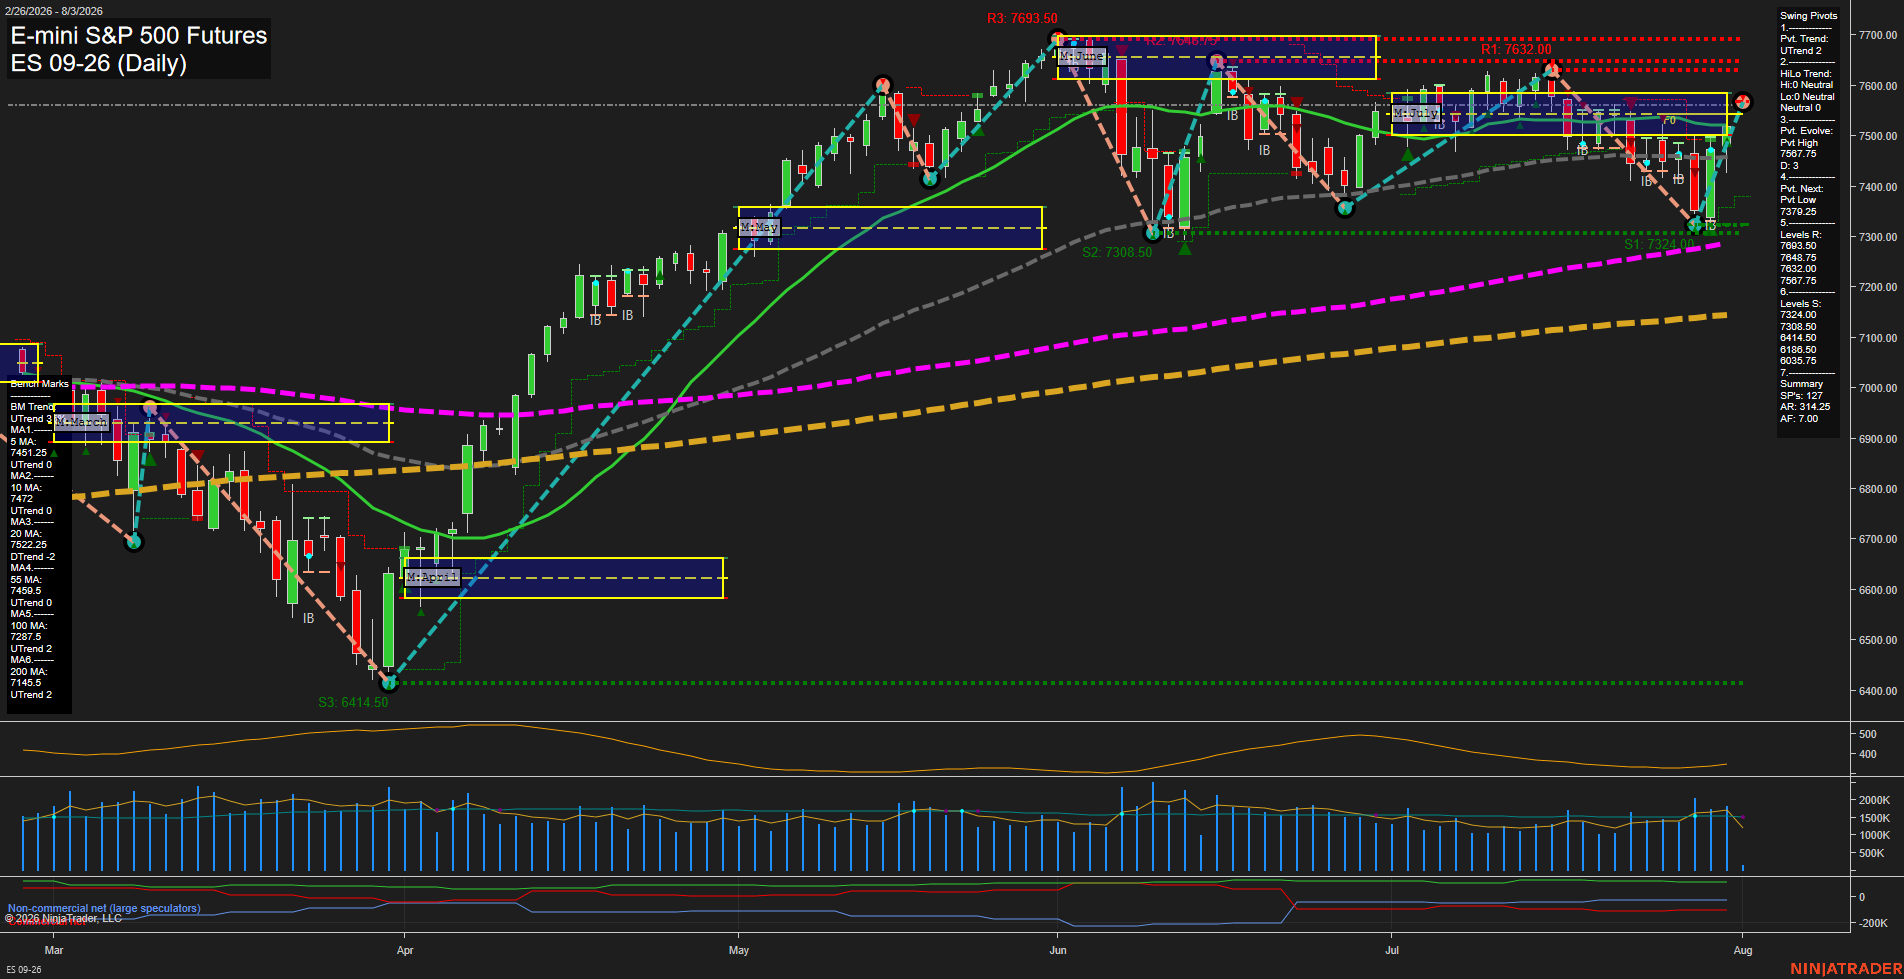
Overall Rating
- Short-Term: Bullish
- Intermediate-Term: Bullish
- Long-Term: Bullish.
Key Insights Summary
Price has staged a sharp V-style recovery from the late-July swing low and has reclaimed the 5, 10, 20, and 55-day benchmarks. The short-term pivot structure is up, weekly and monthly Fib-grid biases remain above F0%, and price is pressing beneath nearby 7587.75 resistance. Intermediate pivot structure remains neutral after the recent two-way rotation, but the rising benchmark alignment and price location above the monthly grid support the broader bullish trend. Resistance is layered at 7587.75, 7632.00, 7648.75, and 7693.50, while the 7348.50 to 7308.50 area defines the principal lower swing-support zone.
View charts on: AlphaWebTrader HTF Charts
NQ Daily View
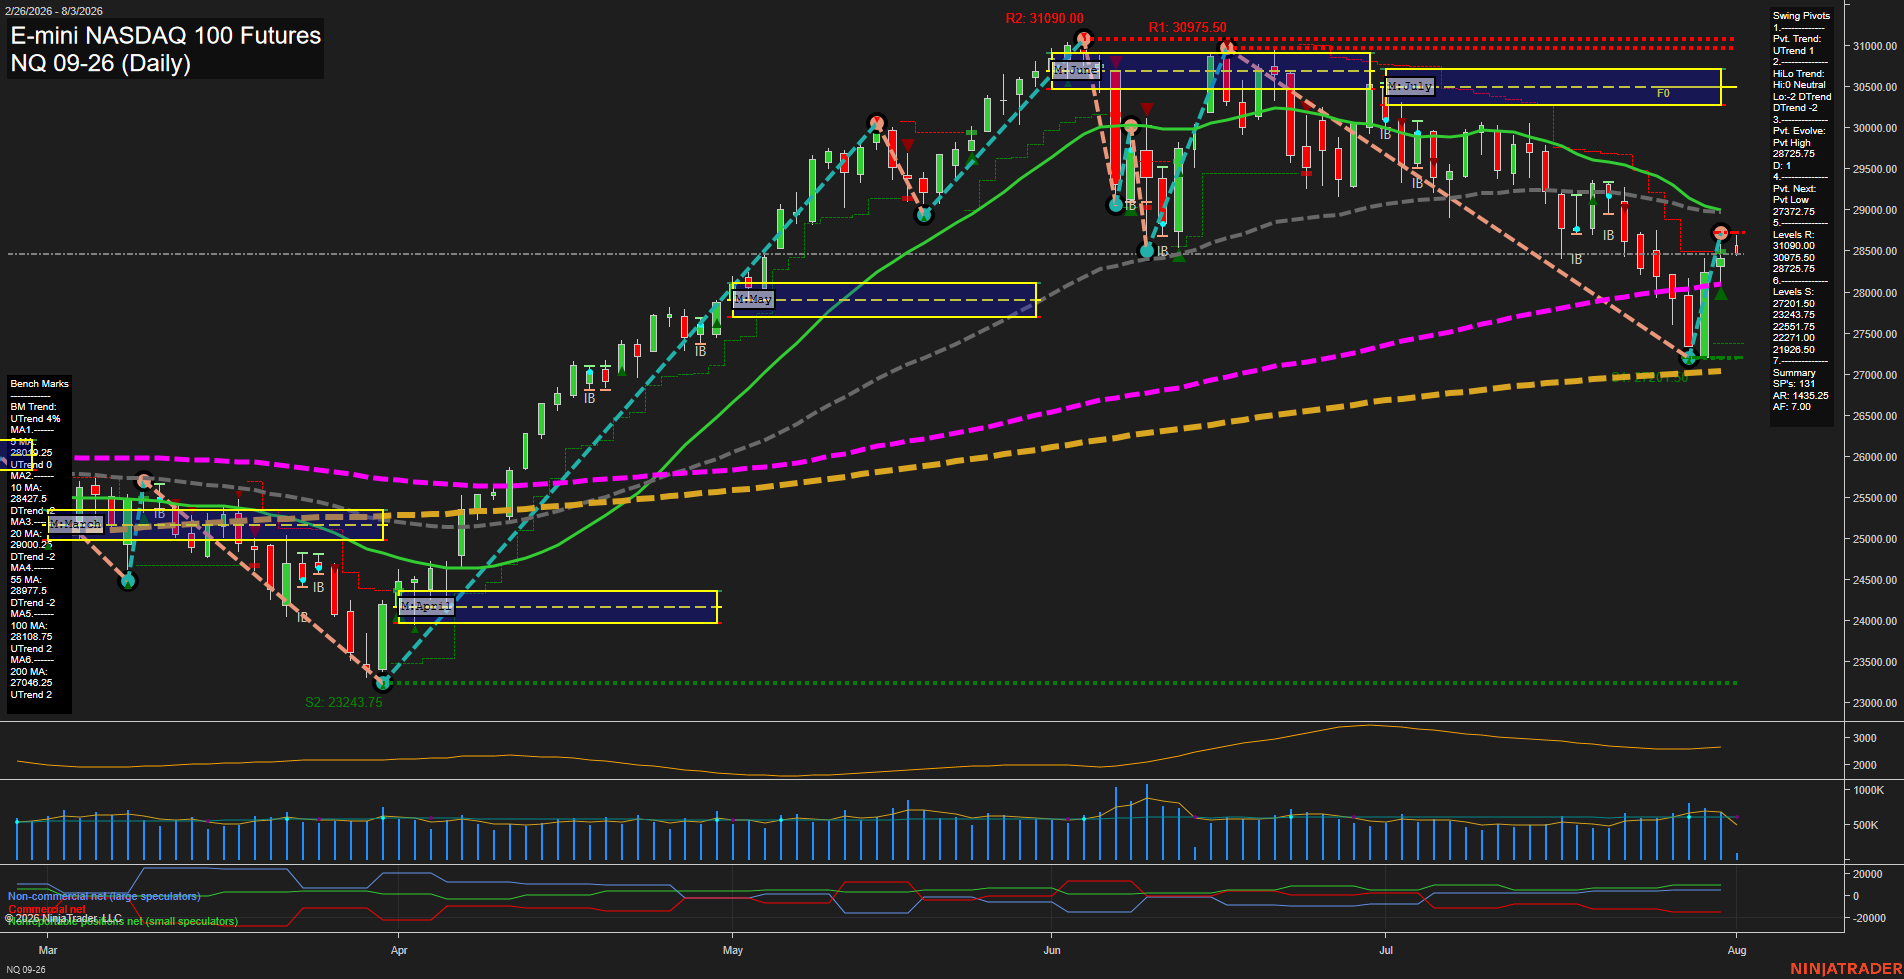
Overall Rating
- Short-Term: Bullish
- Intermediate-Term: Bearish
- Long-Term: Bullish.
Key Insights Summary
NQ is showing a fast, high-range rebound from the late-July 27201.50 pivot low, restoring the short-term pivot trend and placing price above the rising 5-day and 10-day benchmarks. The recovery remains an intermediate-term countertrend bounce because price is still below declining 20-day and 55-day averages and remains below the August monthly F0%/NTZ area. The 28725.75 pivot resistance is being tested, while 30975.50 to 31090.00 remains the higher resistance zone. The broader 100-day and 200-day uptrends, together with price above the annual grid, preserve the long-term bullish structure despite the active intermediate correction.
View charts on: AlphaWebTrader HTF Charts
CL Daily View
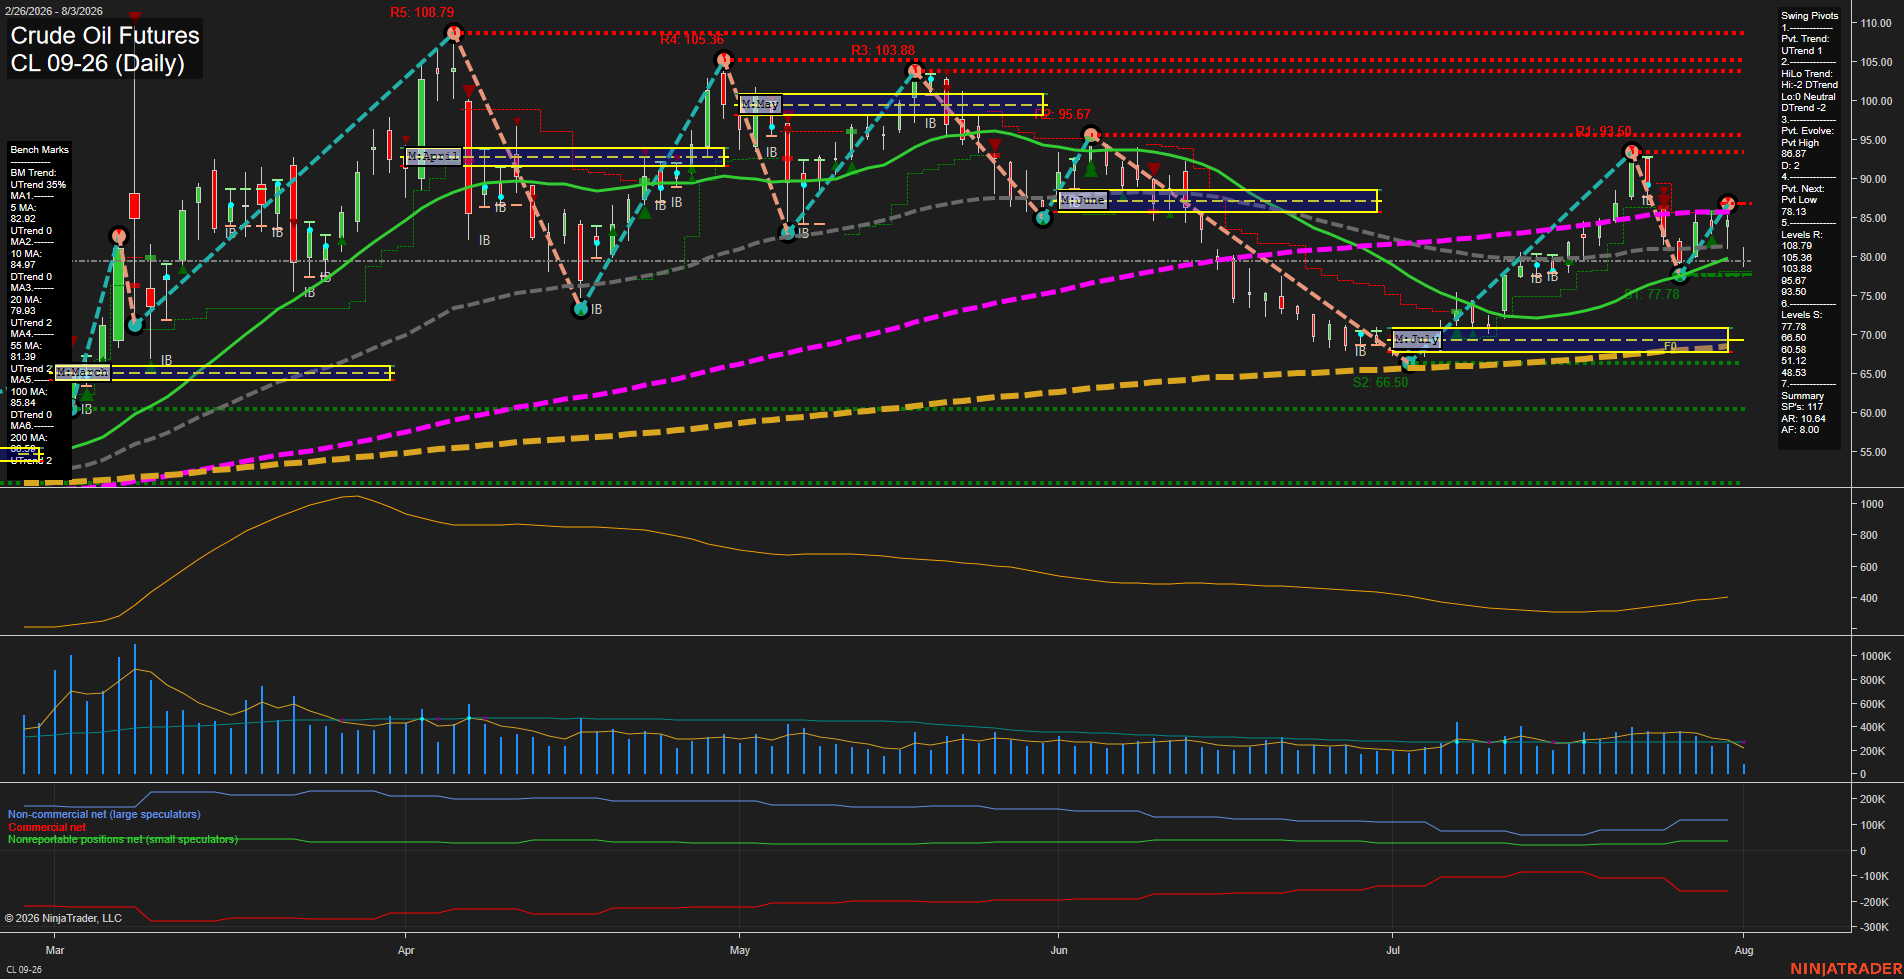
Overall Rating
- Short-Term: Bullish
- Intermediate-Term: Neutral
- Long-Term: Bullish.
Key Insights Summary
Price has staged a sharp V-shaped recovery from the July low near 66.50 and is holding above the rising 5, 20, 55, and 200-day benchmarks. Short-term pivot structure is upward, although the intermediate HiLo structure remains downward following the prior sequence of lower highs. The 85.84 to 86.87 area is a near-term congestion and pivot-high zone, while 93.50 and 95.67 remain the larger overhead resistance levels. The August monthly and weekly Fib grids remain below their F0% reference, indicating that the recovery is occurring within a broader intermediate-term retracement. Volume is moderate and ATR remains elevated, supporting continued wide daily swings.
View charts on: AlphaWebTrader HTF Charts
GC Daily View
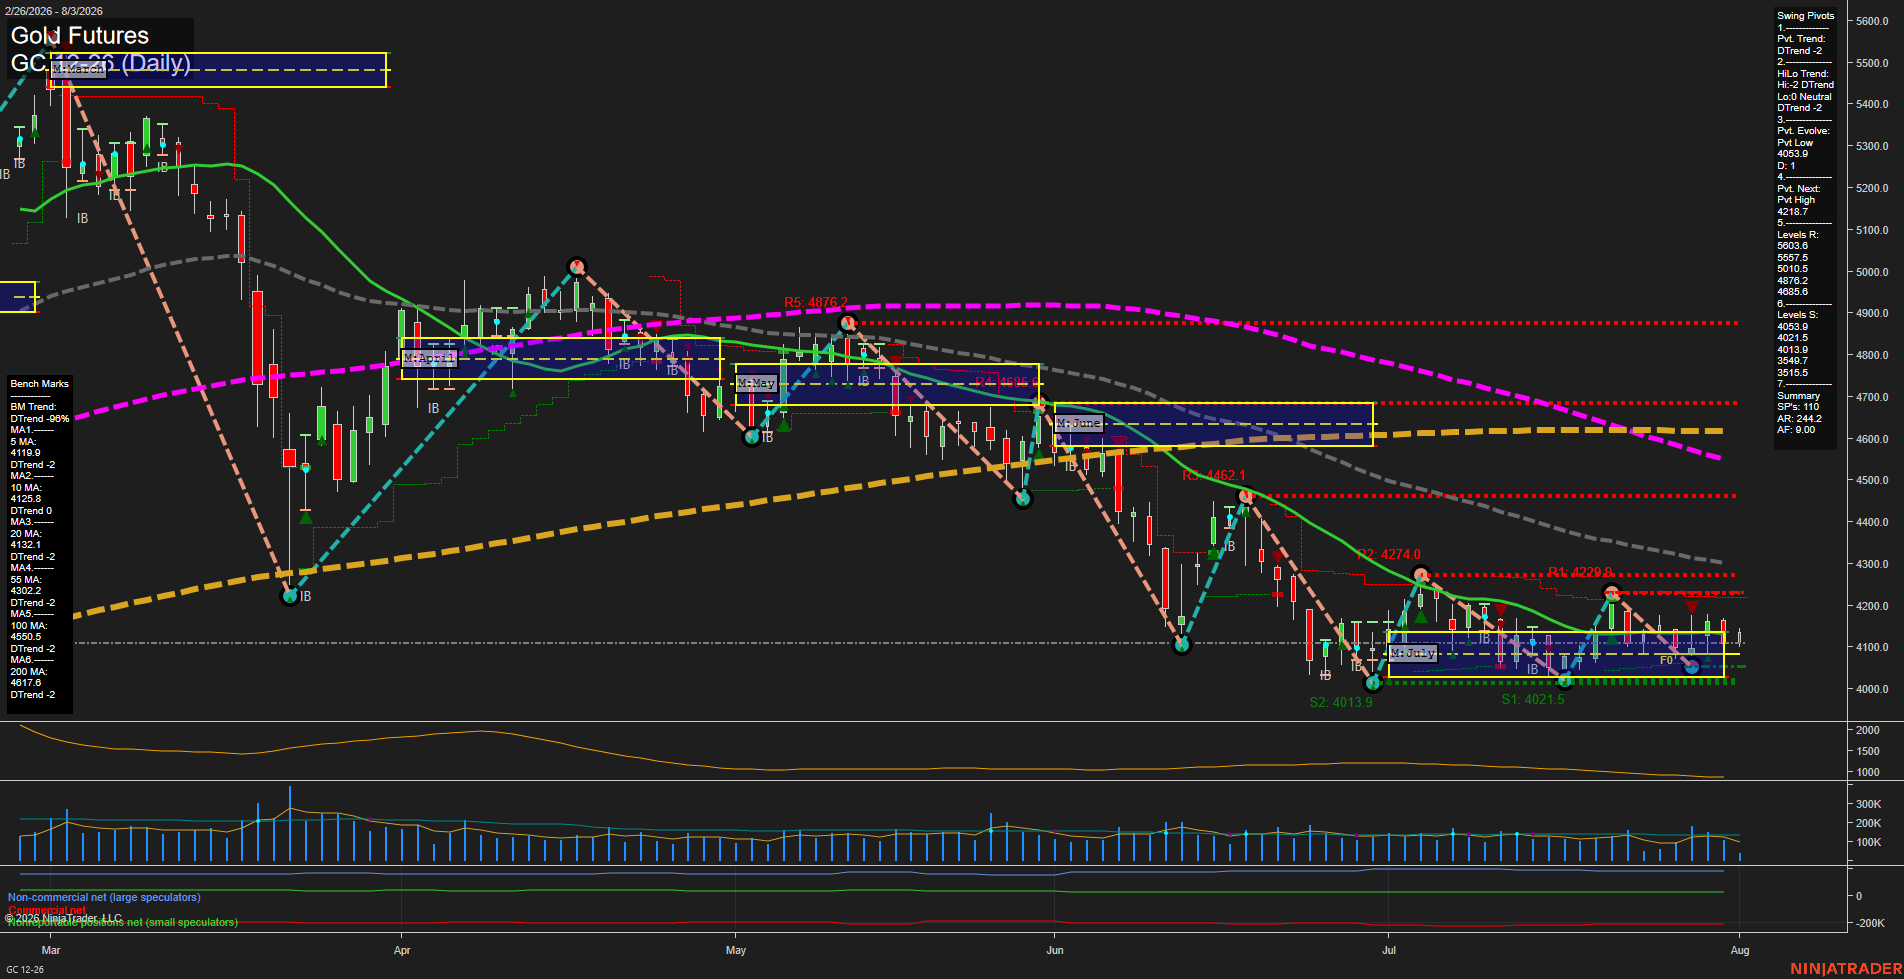
Overall Rating
- Short-Term: Bearish
- Intermediate-Term: Bearish
- Long-Term: Bearish.
Key Insights Summary
Price is consolidating near the July lows around the 4014 to 4054 support zone, but the broader structure remains bearish: pivots are lower, price is below the weekly and monthly F0% areas, and all six benchmark averages are declining. Small daily bars and slowing momentum show compression following the June-to-July selloff, while 4218.7 is the active pivot-reversal level defining the nearby countertrend ceiling. The 5-day through 200-day alignment remains negatively stacked, with the 4302, 4550, and 4618 benchmark areas marking substantial overhead trend resistance.
View charts on: AlphaWebTrader HTF Charts