U.S. stocks closed at records as Iran deal hopes eased Hormuz oil risks, while technology rallied, crude fell, gold held near $4,000 and rate risks lingered.
Fundamentals: U.S. equities finished at record or near-record levels as reports of progress toward reopening the Strait of Hormuz reduced oil-supply concerns and supported a broad technology-led rally. The S&P 500 rose 1.79%, while the Nasdaq gained 2.59%. Crude and energy shares declined, gold remained supported by central-bank demand, and hawkish policy, valuations and geopolitical risks stayed in focus.
Technicals: U.S. index futures maintained broadly bullish short-, intermediate- and long-term technical readings, with ES, YM, EMD, RTY and FDAX holding above key benchmark averages. NQ showed a bullish short-term recovery but a neutral intermediate-term reading as it tested resistance. QQQ, Nvidia and Apple led ETF gains, while Amazon and USO declined.
After Market Close daily snapshot: market news summary and sentiment, major ETFs, Magnificent 7 analysis, Indices Futures Higher Time Frame Analysis, and E-mini S&P500, Nasdaq 100, NYMEX Crude, Gold Futures Daily Chart analysis.
As of: August 4, 2026 05:00 CT
Market News Summary:
U.S. equities reached record highs as reported progress toward reopening the Strait of Hormuz eased oil-supply concerns, while technology strength added to the advance.
Primary Drivers & Risks:
- Primary Driver: Iran deal hopes lift equities
- Primary Risk: Hawkish rate and Hormuz risks
Tone:
Risk-on for equities, with unresolved policy and geopolitical cross-currents.
Stock Market / ETFs / Indices:
The S&P 500 closed at a record 7,737, up 1.79%, while the Nasdaq gained 2.59% and the Dow rose 1.71% to 54,086. Big Tech, software, AI-related shares, chips, and small caps supported the advance; Palantir’s strong results helped software-sector performance. Bullish options activity accompanied a four-session stock rebound, while valuation debate, weak seasonality, and semiconductor bear-market commentary remained counterpoints.
Geopolitical:
Treasury Secretary Scott Bessent said a U.S.-Iran agreement to reopen the Strait of Hormuz was near, easing concerns over the major supply disruption. Reports of cooling Middle East tensions were the central catalyst behind the broad equity rally and lower crude prices.
Oil / Energy:
Oil and energy stocks declined as prospects for a Hormuz reopening reduced disruption premiums. WTI broke below key moving-average support, while Energy Transfer reported an earnings beat, record NGL volumes, stronger crude activity, and a higher 2026 EBITDA outlook.
Gold / Metals:
Central-bank demand remained supportive after the Bank of Korea began a long-term domestic gold-buying program. Gold held near $4,000 despite higher real yields and inflation-driven rate pressures; technical commentary identified $4,166 and $4,203 as resistance levels.
Fed / Financials:
Weaker-than-expected JOLTs job openings supported gold. A hawkish policy risk was identified around Kevin Warsh’s emphasis on balance-sheet reduction and less ample reserves, conditions associated with higher yields and equity-market pressure.
Macro / Other:
The yen’s ability to strengthen beyond 155 per dollar became a key test after Japan’s joint intervention with the United States. Bitcoin security concerns resurfaced after hackers reportedly took more than $100 million from thousands of accounts.
Conclusion:
Equity index gains were led by reports of an imminent Hormuz reopening agreement and broad technology-sector strength. Major U.S. benchmarks finished at or near record levels.
Falling crude prices reduced energy-sector support, while gold retained central-bank-demand backing. Hawkish rate concerns, seasonal equity weakness, elevated valuation debate, and unresolved geopolitical developments remained cross-currents.
Market News Sentiment
Market News Articles: 47
- Neutral: 44.68%
- Positive: 38.30%
- Negative: 17.02%
Sentiment Summary: Market news sentiment is mixed-to-neutral, with 45% neutral, 38% positive, and 17% negative coverage across 47 articles.
Conclusion: Neutral coverage leads, while positive articles outnumber negative articles, indicating a modestly constructive news balance without a dominant directional tone.
GLD,Gold Articles: 10
- Positive: 40.00%
- Neutral: 30.00%
- Negative: 30.00%
Sentiment Summary: GLD/Gold coverage is mixed, with 40% positive, 30% neutral, and 30% negative sentiment across 10 articles.
Conclusion: Gold-related news tone is slightly positive overall, while neutral and negative coverage remain significant.
USO,Oil Articles: 14
- Negative: 42.86%
- Positive: 35.71%
- Neutral: 21.43%
Sentiment Summary: USO and oil coverage is mixed with a negative tilt: 43% negative, 36% positive, and 21% neutral across 14 articles.
Conclusion: For indices futures day traders, oil-related news tone is modestly negative overall, with meaningful positive and neutral coverage also present.
Market Data Snapshot
ETF Snapshot of major stock market ETFs, Mag7, and others as of: August 4, 2026 05:00
Top Movers & Losers
- QQQ 723.85 Bullish 3.40% ▲
- NVDA 211.94 Bullish 2.56% ▲
- AAPL 309.38 Bullish 1.96% ▲
- META 587.94 Bearish -0.39% ▼
- AMZN 277.42 Bearish -2.32% ▼
- USO 115.78 Bearish -5.19% ▼
Major Index ETFs: SPY, QQQ, DIA, IWM, IJH
- QQQ 723.85 Bullish 3.40% ▲
- IWM 301.71 Bullish 1.85% ▲
- SPY 771.33 Bullish 1.80% ▲
- IJH 77.48 Bullish 1.80% ▲
- DIA 540.43 Bullish 1.73% ▲
Major index ETFs were Bullish across the board. QQQ led as the most bullish mover at +3.40%, while IWM gained +1.85%, SPY and IJH each rose +1.80%, and DIA was the least positive mover at +1.73%.
Mag 7 Stocks: AAPL, MSFT, GOOG, AMZN, META, NVDA, TSLA
- NVDA 211.94 Bullish 2.56% ▲
- AAPL 309.38 Bullish 1.96% ▲
- TSLA 327.35 Bullish 1.64% ▲
- MSFT 492.81 Bullish 1.06% ▲
- GOOG 375.35 Bullish 0.77% ▲
- META 587.94 Bearish -0.39% ▼
- AMZN 277.42 Bearish -2.32% ▼
Mixed Mag7 context: NVDA is the most bullish mover at +2.56%, followed by AAPL at +1.96% and TSLA at +1.64%. MSFT and GOOG remain Bullish at +1.06% and +0.77%. META is Bearish at -0.39%, while AMZN is the most bearish mover at -2.32%.
Cross-Market ETFs: TLT, GLD, USO, IBIT
- TLT 82.82 Bullish 0.77% ▲
- GLD 374.16 Bullish 0.66% ▲
- IBIT 36.39 Bullish 0.64% ▲
- USO 115.78 Bearish -5.19% ▼
Other ETFs were Mixed: TLT was the most bullish mover at +0.77%, followed by GLD at +0.66% and IBIT at +0.64%. USO was the most bearish mover, down -5.19%.
ETF, Mag7, and Cross-Market ETF Insights
Overall Tone
Bullish equity leadership signals a Risk On tone, although the sharp USO decline adds cross-market divergence.
Equity ETFs and Mag7:
Major Index ETFs were broadly Bullish, led by QQQ at +3.40%, followed by IWM at +1.85%, SPY and IJH at +1.80%, and DIA at +1.73%. Mag7 participation was selective: NVDA gained +2.56%, AAPL +1.96%, TSLA +1.64%, MSFT +1.06%, and GOOG +0.77%, while META fell -0.39% and AMZN was the most bearish mover at -2.32%. QQQ was the most bullish mover at +3.40%, showing technology-led strength alongside broad index gains.
Cross-Market ETFs:
Cross-market ETFs were Mixed: TLT rose +0.77%, GLD gained +0.66%, and IBIT added +0.64%, while USO declined -5.19%. TLT was the most bullish cross-market mover at +0.77%, while USO was the most bearish mover at -5.19%, contrasting sharply with Bullish equities.
Futures Indices – Higher Time Frame Analysis
Summary of the current state of US Indices Futures based on higher time-frame (HTF) technical analysis as of: 2026-08-04: 17:00 CT.
US Indices Futures
- ES YSFG/MSFG/WSFG upward, above six rising benchmarks, UTrend pivots, 7665-7693.50 resistance, 7490.50 reversal pivot, 7030 major weekly threshold.
- NQ YSFG/MSFG/WSFG upward, above longer benchmarks, recovery below 10-week average, 29203.50/29938 resistance, 27807.50 and 27218.50 supports.
- YM YSFG/MSFG/WSFG upward, above six rising benchmarks, new 53810-54000 highs, 53656 cleared resistance, 52593 reversal pivot.
- EMD YSFG/MSFG/WSFG upward, above longer benchmarks, UTrend pivots, 3834.1-3847.2 and 3892.4 resistance, 3730.5-3724 support, 3688.2 weekly pivot.
- RTY YSFG/MSFG/WSFG upward, above rising longer benchmarks, consolidation below 3068.4 resistance, 3002.2 pivot area, 2914.0-2902.3 support.
- FDAX YSFG/MSFG/WSFG upward, above six rising benchmarks, fresh 26354 pivot high, 26330 reversal pivot, 25723-25144 layered support.
Overall State
- Short-Term: Bullish
- Intermediate-Term: Bullish
- Long-Term: Bullish
Conclusion
All six contracts retain upward YSFG, MSFG, and WSFG alignment, with broad higher-high and higher-low structures and price generally above rising benchmark averages. ES, YM, EMD, RTY, and FDAX are pressing or holding near pivot-high resistance; NQ remains in an intermediate repair phase despite its short-term recovery. Nearby pivot supports define the current pullback structure across the group.
Note: Intra-day counter-trend pullbacks or retracements may occur, HTF is context for informational usage and market structure. Glossary: Session Fib Grids periods of YSFG:’Yearly’, MSFG:’Monthly’, WSFG:’Weekly’
For full details visit: AlphaWebTrader Technicals
ES Daily View
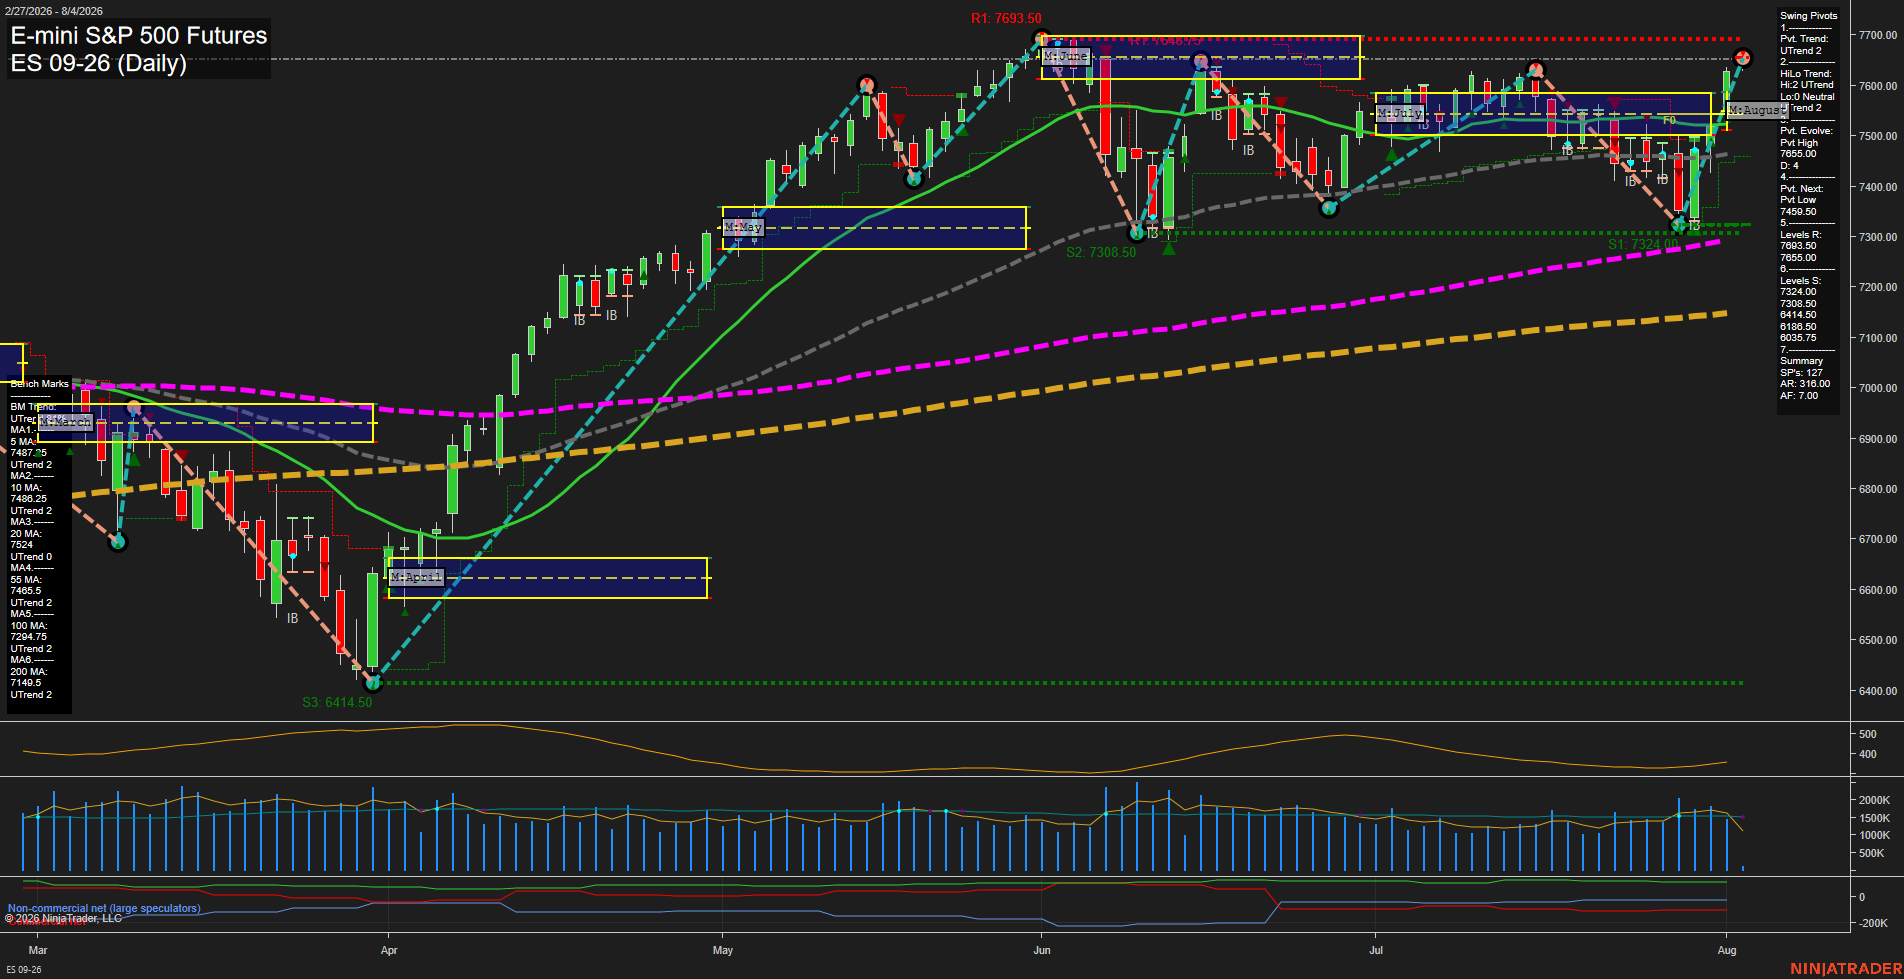
Overall Rating
- Short-Term: Bullish
- Intermediate-Term: Bullish
- Long-Term: Bullish.
Key Insights Summary
ES is extending its recovery leg with price above the weekly, monthly, and yearly Fib-grid centers and above all six rising benchmark averages. The daily pivot structure remains in UTrend on both short-term and intermediate-term measures, with the latest advance clearing the 7665.00 pivot-high level and pressing toward 7693.50 resistance. The July pullback held well above the major 55, 100, and 200-day trend references, creating a higher-low continuation structure. Fast momentum and elevated ATR characterize an active upside expansion rather than a low-volatility consolidation, while 7490.50 remains the defined opposite-pivot threshold beneath the current advance.
View charts on: AlphaWebTrader HTF Charts
NQ Daily View
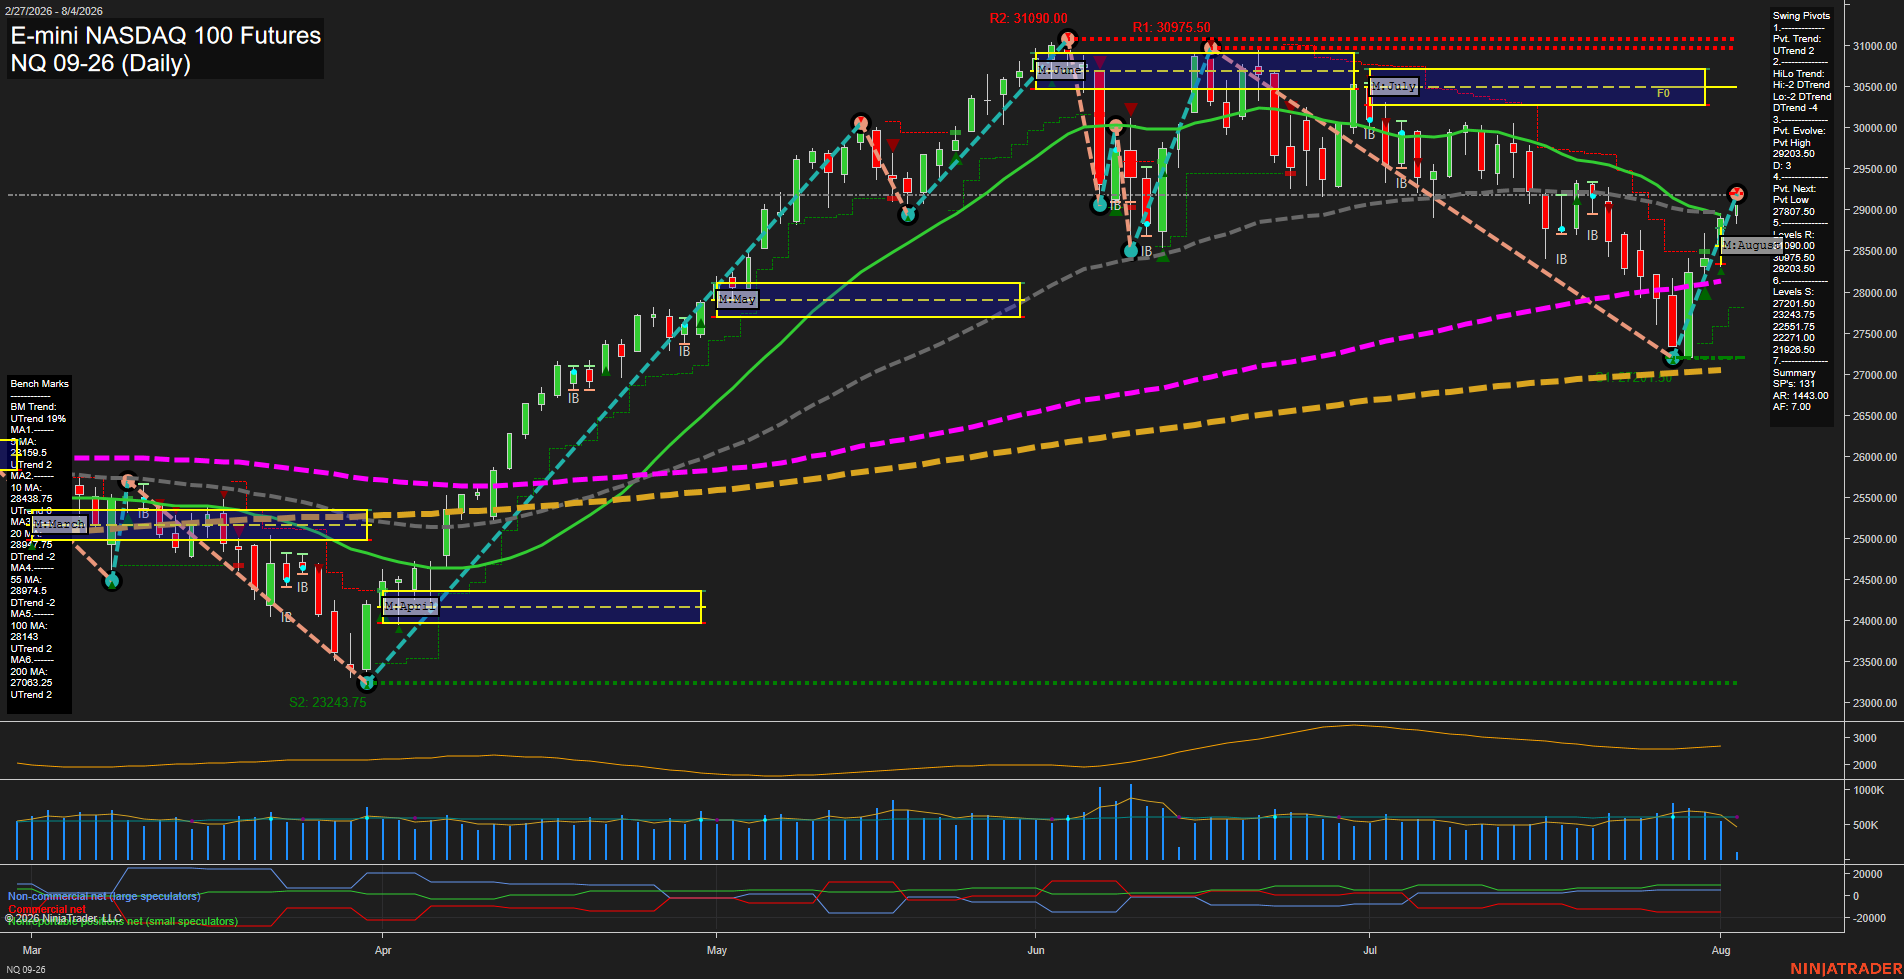
Overall Rating
- Short-Term: Bullish
- Intermediate-Term: Neutral
- Long-Term: Bullish.
Key Insights Summary
Price has produced a fast V-recovery from the late-July 27201.50 swing low and is trading above the rising 5-, 10-, 100-, and 200-day benchmarks. The short-term pivot trend, weekly grid, and August monthly grid are upward, although price is testing the 29203.50 pivot-high resistance area while the 20- and 55-day benchmark trends remain down. This creates a bullish short-term recovery within an intermediate-term repair phase; 27807.50 is the key new-pivot reversal level, while 30975.50 to 31090.00 marks the major overhead swing-resistance zone.
View charts on: AlphaWebTrader HTF Charts
CL Daily View
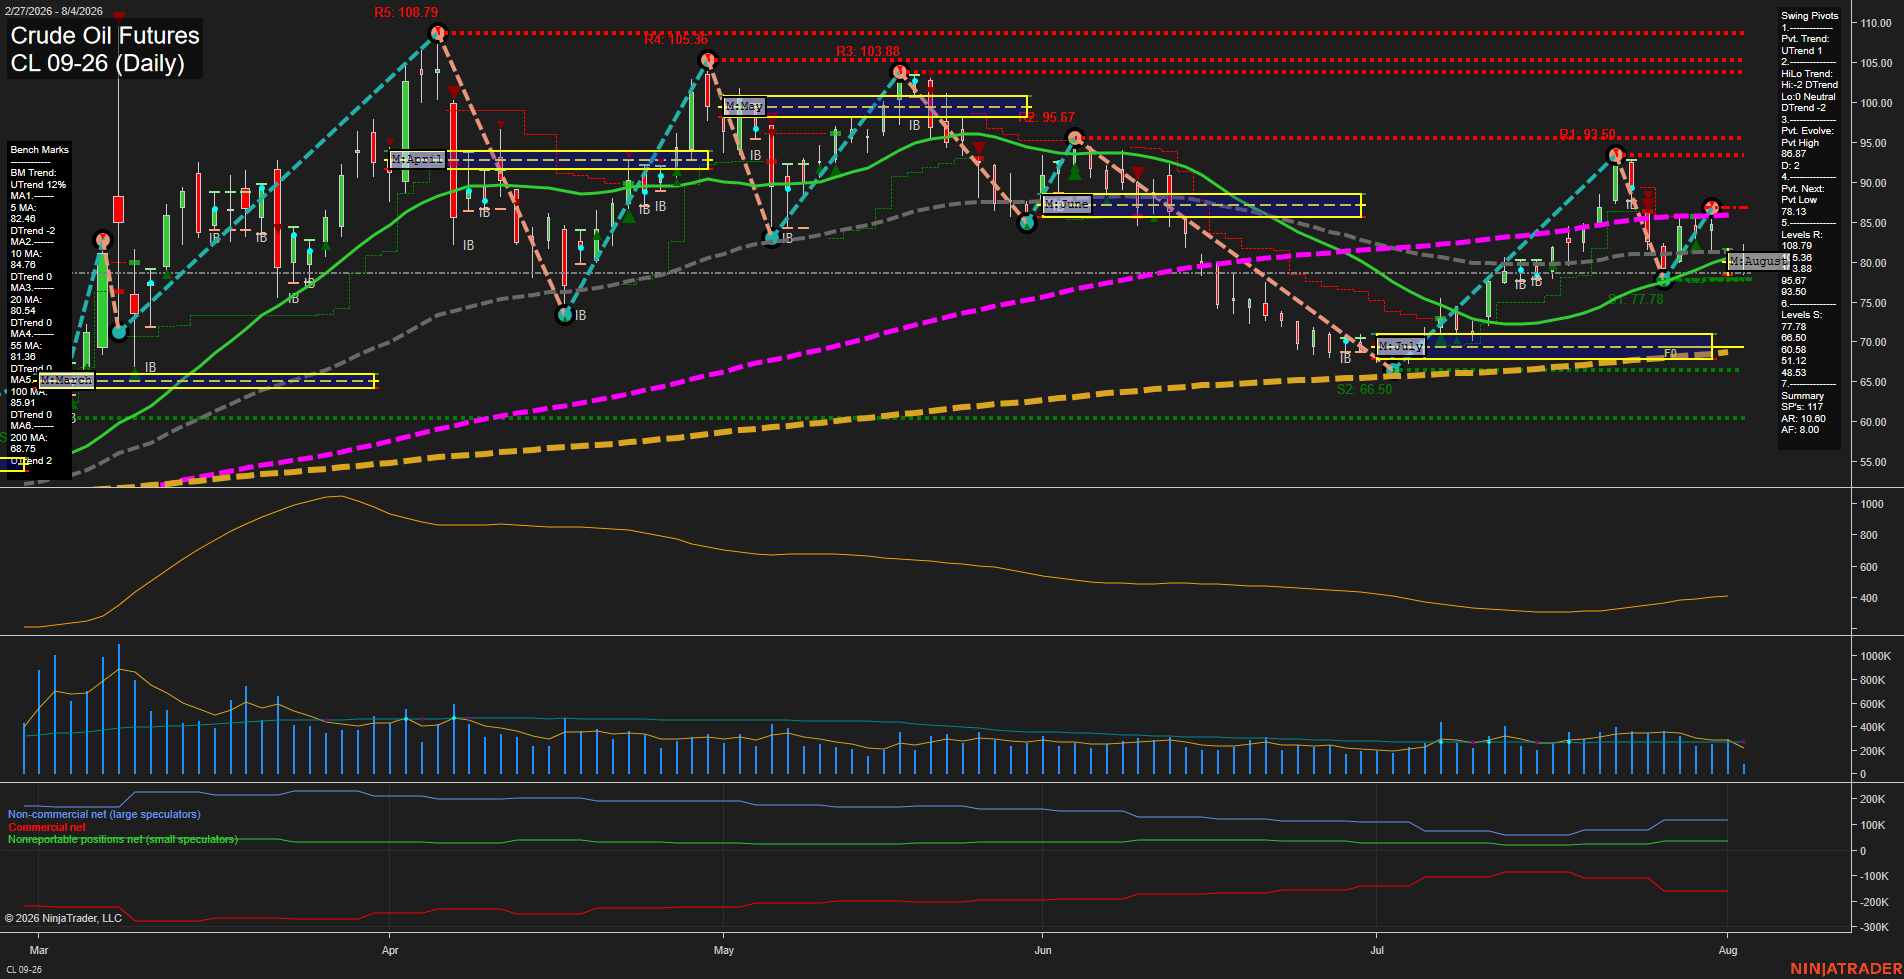
Overall Rating
- Short-Term: Bearish
- Intermediate-Term: Bearish
- Long-Term: Bullish.
Key Insights Summary
CL is consolidating near 80.00 after a sharp late-July rejection from the 93.50 pivot resistance area. The short-term pivot sequence remains upward, but price is below the weekly and monthly Fib centers and beneath the 5-, 10-, 20-, and 55-day benchmarks, reflecting a bearish countertrend phase. The 77.78 support area and 78.38 next-pivot level define the near-term downside structure, while 80.54 to 84.76 is an overhead moving-average congestion zone. The broader 2026 structure remains constructive because price is well above the rising 200-day benchmark and the yearly Fib grid remains positive, although the 100-day average near 85.91 remains a major longer-term recovery threshold.
View charts on: AlphaWebTrader HTF Charts
GC Daily View
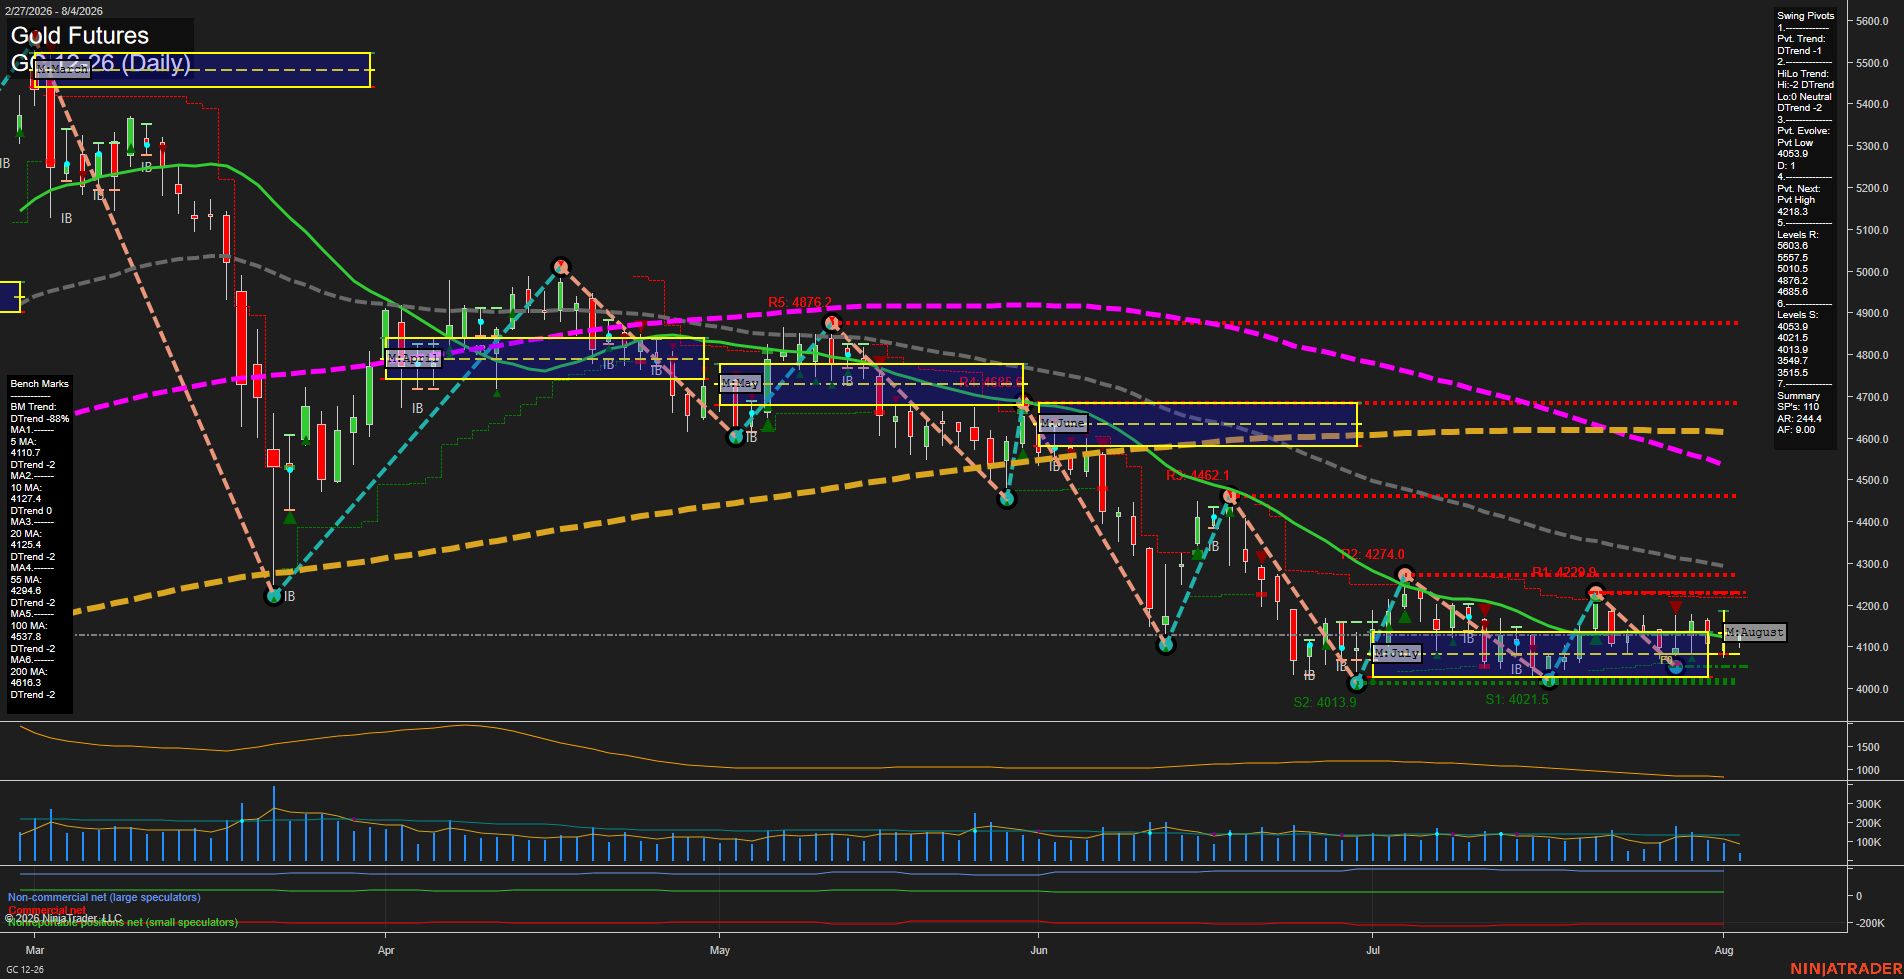
Overall Rating
- Short-Term: Bearish
- Intermediate-Term: Bearish
- Long-Term: Bearish.
Key Insights Summary
Gold remains in a broad bearish swing structure, with both pivot trend measures down and price positioned below every daily benchmark from the 5-day through the 200-day average. Recent price action is compressed into a small-bar consolidation around 4110.7, bounded by pivot support near 4053.9 and the next pivot-high level at 4218.3. The July-August range reflects a countertrend pause following the June selloff rather than a confirmed trend reversal, while declining momentum and downward WSFG, MSFG, and YSFG alignment maintain the dominant lower-high, lower-low market character.
View charts on: AlphaWebTrader HTF Charts