NYSE pre-market update: U.S. futures rise on AI earnings as Strait of Hormuz shipping risks support oil and gold ahead of JOLTS data report.
Fundamentals: U.S. index futures moved higher as AI-related earnings improved technology sentiment, while shipping disruption concerns in the Strait of Hormuz kept oil and safe-haven demand elevated. Markets are also tracking AMD earnings after the close and the JOLTS job openings report. Fed expectations, yen-support measures and upcoming labor data remain key factors across equities, energy and metals.
Technicals: NYSE pre-market conditions follow strong prior-session gains in Meta, Microsoft and Amazon, while Apple and USO declined. Major equity-index futures retain predominantly bullish short-, intermediate- and long-term structures, supported by rising benchmark averages and higher-low patterns. ES, YM, EMD and FDAX are testing or setting swing highs, while NQ and RTY approach notable resistance zones.
Pre-Market Trading 360° view Market Radar of: holidays, earnings, eco-news, market-news summary, news sentiment, prior session major ETFs, MAG7, Higher Time Frame Analysis Indices Futures Summary, and E-mini S&P500, Nasdaq 100, NYMEX Crude, Gold Futures Daily Chart analysis.
As of: August 4, 2026 07:16 CT
Earnings Radar
Monitoring for earnings releases by the Magnificent 7, AI-tech-related firms, and major financial institutions.
- MCHP Release: 2026-08-06 T:AMC
- AMD Release: 2026-08-04 T:AMC
Conclusion: AMD reports after the close on Aug. 4, placing AI and semiconductor earnings at the center of near-term index-futures attention; MCHP follows after the close on Aug. 6, extending chip-sector event risk. Market momentum and volume can slow ahead of these major semiconductor releases.
For full details visit: Yahoo Earnings Calendar
EcoNews Radar U.S. Events
| Day | Time | Impact | Event |
|---|---|---|---|
| Tue | 10:00 | Medium | JOLTS Job Openings |
| Wed | 08:15 | Medium | ADP Non-Farm Employment Change |
| Wed | 10:00 | Medium | ISM Services PMI |
| Wed | 10:30 | Low | Crude Oil Inventories |
| Thu | 08:30 | Medium | Unemployment Claims |
| Fri | 08:30 | High | Average Hourly Earnings m/m |
| Fri | 08:30 | High | Non-Farm Employment Change |
| Fri | 08:30 | High | Unemployment Rate |
EcoNews Summary
Friday’s 08:30 USD employment releases are the week’s listed high-impact market events. The combined data set provides a broad reading of labor-market conditions, wage growth, and employment conditions, key inputs for index-futures market reactions.
Event Notes:
- Friday 08:30 – Average Hourly Earnings m/m: Measures the monthly change in average employee pay. Traders monitor wage growth as an indicator of labor-cost pressure and inflation conditions.
- Friday 08:30 – Non-Farm Employment Change: Measures the change in payroll employment outside the farm sector. Traders monitor it for a broad snapshot of employment growth and economic activity.
- Friday 08:30 – Unemployment Rate: Measures the percentage of the labor force actively seeking work but without employment. Traders monitor it for labor-market slack and changes in employment conditions.
Conclusion:
The single most important event is Friday at 08:30, led by Non-Farm Employment Change alongside Average Hourly Earnings and the Unemployment Rate. Market momentum and volume often slow ahead of major employment releases, with increased volatility at release time.
For full details visit: Forex Factory EcoNews
Market News Summary:
U.S. index futures advanced as AI-related earnings lifted technology sentiment, while Middle East shipping disruption kept energy and safe-haven markets active.
Primary Drivers & Risks:
- Primary Driver: AI earnings lift index futures
- Primary Risk: Strait of Hormuz supply disruption
Tone:
Constructive for equities, with elevated geopolitical cross-currents.
Stock Market / ETFs / Indices:
Dow futures rose 342 points, Nasdaq 100 futures gained 0.76%, and S&P 500 futures added 0.19% before the U.S. open. Palantir results renewed confidence in AI spending, while the Dow had closed at a record high and Japanese chip shares moved higher. Recent leadership centered on Consumer Discretionary and technology, although small caps lagged broader benchmarks.
Geopolitical:
U.S.-Iran diplomacy remained unclear as statements from Washington and Tehran conflicted. A vessel reported an unknown-projectile strike in the Strait of Hormuz, while Bessent cited discussions to restore freedom of movement through the waterway.
Oil / Energy:
Oil rebounded after a prior selloff as uncertainty surrounding U.S.-Iran talks and Hormuz shipping risks sustained supply concerns. Goldman Sachs cited an $80-$90 Brent range pending confirmation of a U.S.-Iran deal or significant conflict escalation; another Goldman commentary highlighted upside oil risks. Saudi Aramco reported a 33% profit increase as higher crude prices offset lower sales volumes.
Gold / Metals:
Gold and silver strengthened on safe-haven demand ahead of U.S. labor data. Middle East tensions and changing Fed expectations remained key influences on precious metals.
Fed / Financials:
The U.S. joined Japan in foreign-exchange intervention after the yen reached 40-year lows. Bessent sought expansion of the Fed’s FIMA Repo Facility, enabling Japan to raise dollars without outright Treasury sales. Fed expectations also remained a focus ahead of Friday’s nonfarm payrolls report.
Macro / Other:
AI investment continued to support U.S. growth through data-center spending, capital investment, and market wealth effects, while also increasing concentration risk. Commentary also described a developing rotation toward cyclical value, energy, materials, and industrials.
Conclusion:
AI earnings momentum supported U.S. equity futures and technology-linked risk appetite. Record Dow performance and strength in consumer discretionary added to the constructive equity backdrop.
Hormuz security developments remained the central cross-market risk, affecting oil, inflation-sensitive assets, and safe-haven demand. Yen-support measures, Fed liquidity discussions, and upcoming U.S. labor data added financial-market sensitivity.
Market News Sentiment
Market News Articles: 36
- Neutral: 58.33%
- Positive: 27.78%
- Negative: 13.89%
Sentiment Summary: Of 36 market news articles, 58% were neutral, 28% positive, and 14% negative, indicating predominantly neutral coverage with a positive skew over negative items.
Conclusion: News sentiment for indices futures is broadly balanced, with neutral reporting dominant and positive articles outnumbering negative articles.
GLD,Gold Articles: 12
- Positive: 50.00%
- Neutral: 33.33%
- Negative: 16.67%
Sentiment Summary: GLD/Gold coverage is 50% positive, 33% neutral, and 17% negative across 12 articles, indicating a net-positive tone.
Conclusion: For indices futures day traders, gold-related news sentiment is moderately positive with limited negative coverage.
USO,Oil Articles: 11
- Neutral: 45.45%
- Negative: 36.36%
- Positive: 18.18%
Sentiment Summary: USO/Oil coverage is neutral-to-negative, with 45% neutral, 36% negative, and 18% positive articles.
Conclusion: For indices futures day traders, oil-related news tone is mixed but weighted toward neutral and negative coverage.
Market Data Snapshot
ETF Snapshot of major stock market ETFs, Mag7, and others as of: August 4, 2026 07:16
Top Movers & Losers
- META 590.24 Bullish 6.02% ▲
- MSFT 487.65 Bullish 4.93% ▲
- AMZN 284.02 Bullish 4.58% ▲
- TLT 82.19 Bearish -0.07% ▼
- AAPL 303.42 Bearish -1.78% ▼
- USO 122.12 Bearish -5.46% ▼
Major Index ETFs: SPY, QQQ, DIA, IWM, IJH
- QQQ 700.07 Bullish 1.76% ▲
- IWM 296.22 Bullish 1.72% ▲
- SPY 757.67 Bullish 1.42% ▲
- DIA 531.22 Bullish 1.32% ▲
- IJH 76.11 Bullish 1.12% ▲
Major index ETFs are Bullish across the group: QQQ is the most bullish mover at +1.76%, followed by IWM at +1.72% and SPY at +1.42%. DIA gained +1.32%, while IJH is the least positive mover at +1.12%.
Mag 7 Stocks: AAPL, MSFT, GOOG, AMZN, META, NVDA, TSLA
- META 590.24 Bullish 6.02% ▲
- MSFT 487.65 Bullish 4.93% ▲
- AMZN 284.02 Bullish 4.58% ▲
- GOOG 372.47 Bullish 4.44% ▲
- TSLA 322.08 Bullish 3.49% ▲
- NVDA 206.64 Bullish 2.93% ▲
- AAPL 303.42 Bearish -1.78% ▼
Mixed Mag7 snapshot: META is the most bullish mover at +6.02%, followed by MSFT at +4.93%, AMZN at +4.58%, and GOOG at +4.44%. TSLA gained +3.49% and NVDA added +2.93%. AAPL is the most bearish mover at -1.78%.
Cross-Market ETFs: TLT, GLD, USO, IBIT
- IBIT 36.16 Bullish 1.46% ▲
- GLD 371.71 Bullish 0.05% ▲
- TLT 82.19 Bearish -0.07% ▼
- USO 122.12 Bearish -5.46% ▼
Mixed cross-market conditions: IBIT is the most bullish mover at +1.46%, while USO is the most bearish mover at -5.46%. GLD is marginally Bullish at +0.05%, and TLT is near-flat Bearish at -0.07%.
ETF, Mag7, and Cross-Market ETF Insights
Overall Tone
Bullish, with broad equity ETF gains, strong Mag7 participation excluding AAPL, and IBIT higher while USO posted the largest decline.
Equity ETFs and Mag7:
Major Index ETFs were broadly Bullish: QQQ +1.76% led, followed by IWM +1.72%, SPY +1.42%, DIA +1.32%, and IJH +1.12%. Mag7 performance was selective but predominantly Bullish, led by META +6.02%, the most bullish mover, followed by MSFT +4.93%, AMZN +4.58%, GOOG +4.44%, TSLA +3.49%, and NVDA +2.93%. AAPL -1.78% was the most bearish equity mover.
Cross-Market ETFs:
Cross-market ETFs were Mixed: IBIT +1.46% was the most bullish mover, while GLD +0.05% was marginally Bullish. TLT -0.07% was near-flat and Bearish, while USO -5.46% was the most bearish mover and diverged sharply from the Bullish equity ETFs.
Futures Indices – Higher Time Frame Analysis
Summary of the current state of US Indices Futures based on higher time-frame (HTF) technical analysis as of: 2026-08-04: 07:16 CT.
US Indices Futures
- ES YSFG/MSFG/WSFG upward, above six rising benchmarks, UTrend pivots; resistance 7669.50-7693.50, supports 7490.50 and 7030.00.
- NQ YSFG/MSFG/WSFG above centers, above major benchmarks; recovery tests 29203.50/29938.00, resistance 30975.50-31090.00, supports 27807.50 and 27218.50.
- YM YSFG/MSFG/WSFG upward, above six rising benchmarks, new pivot high near 54000; resistance 53810-54000, pivot support 52593.
- EMD YSFG/MSFG/WSFG upward, above major benchmarks, higher-low pivots; resistance 3834.10-3892.40, supports 3730.50-3724.00 and 3688.20.
- RTY YSFG/MSFG/WSFG upward, above six rising benchmarks, recovery toward pivot resistance; resistance 3002.20-3068.40, supports 2914.00, 2902.30, and 2851.40.
- FDAX YSFG/MSFG/WSFG upward, above six rising benchmarks, fresh 26354 pivot high; reversal pivot 26330, layered support 25723-25144.
Overall State
- Short-Term: Bullish
- Intermediate-Term: Bullish
- Long-Term: Bullish
Conclusion
Weekly and daily correlations remain broadly bullish across ES, YM, EMD, RTY, and FDAX, with aligned YSFG, MSFG, WSFG, rising benchmarks, and higher pivot structures. NQ maintains long-term alignment but retains intermediate repair characteristics below 20- and 55-day benchmarks. ES, YM, EMD, RTY, and FDAX are testing or extending near pivot-high resistance, while listed opposite pivots define structural support references.
Note: Intra-day counter-trend pullbacks or retracements may occur, HTF is context for informational usage and market structure. Glossary: Session Fib Grids periods of YSFG:’Yearly’, MSFG:’Monthly’, WSFG:’Weekly’
For full details visit: AlphaWebTrader Technicals
ES Daily View
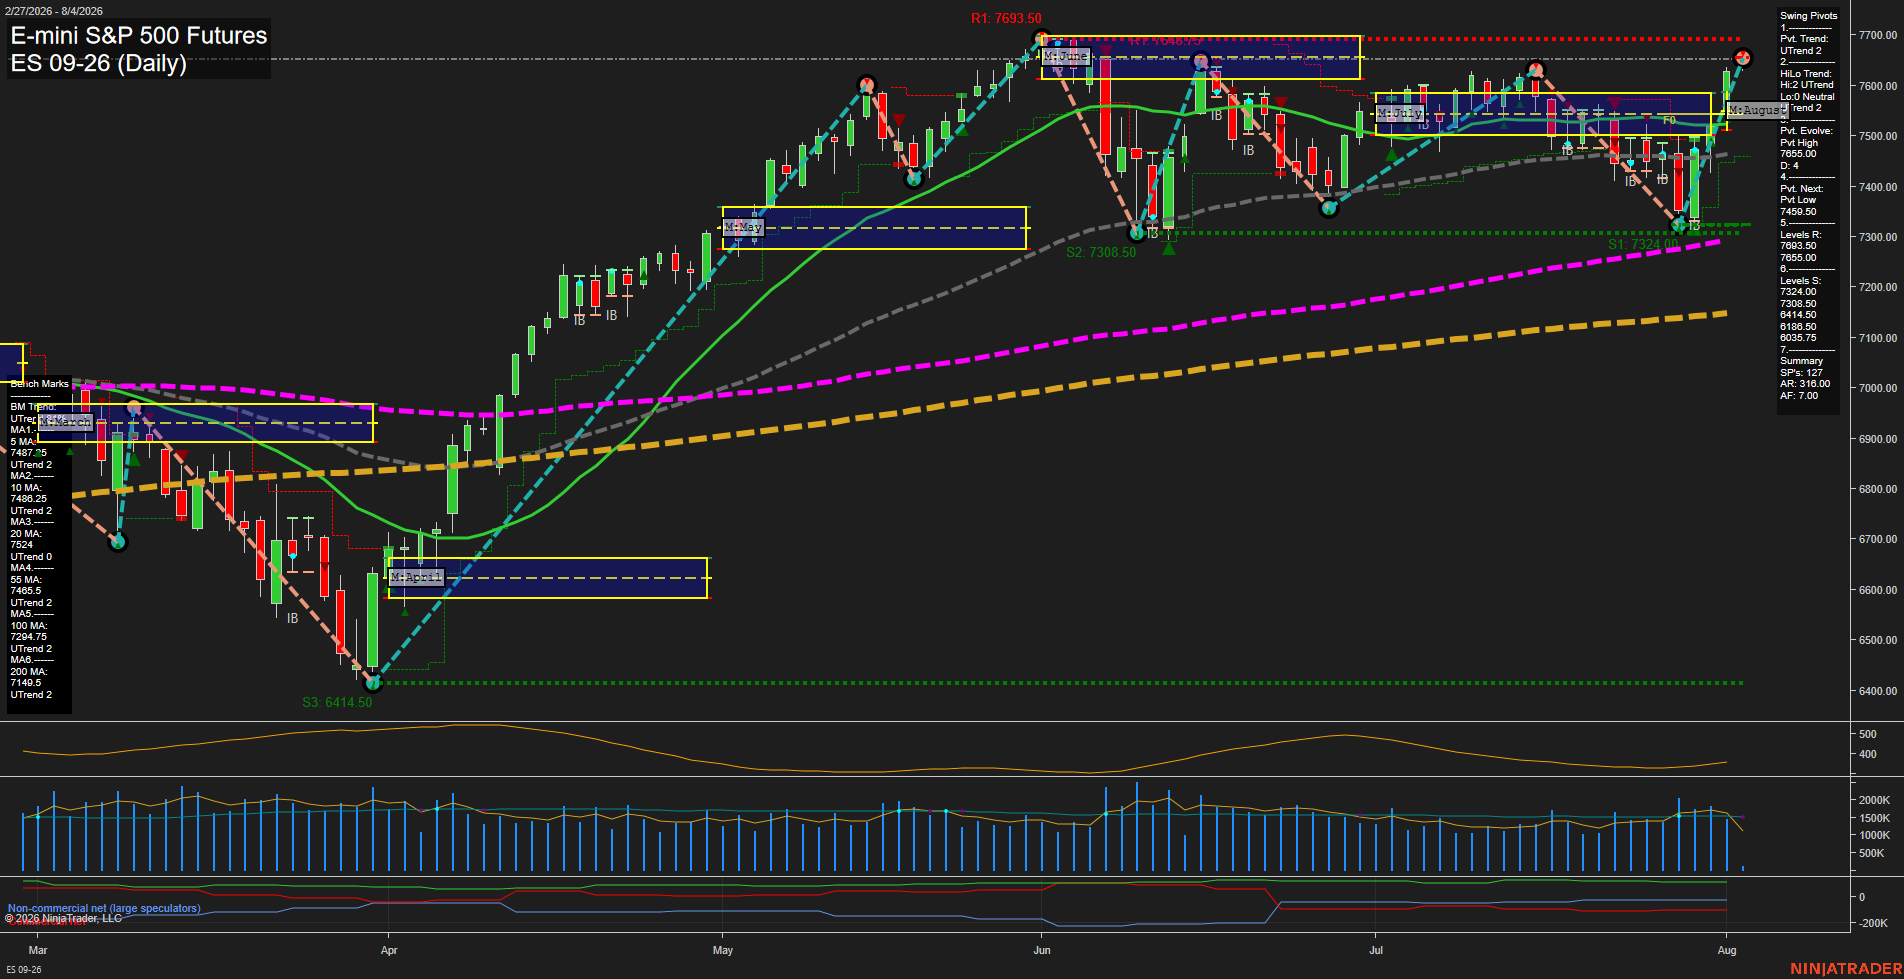
Overall Rating
- Short-Term: Bullish
- Intermediate-Term: Bullish
- Long-Term: Bullish.
Key Insights Summary
ES is extending its recovery leg with price above the weekly, monthly, and yearly Fib-grid centers and above all six rising benchmark averages. The daily pivot structure remains in UTrend on both short-term and intermediate-term measures, with the latest advance clearing the 7665.00 pivot-high level and pressing toward 7693.50 resistance. The July pullback held well above the major 55, 100, and 200-day trend references, creating a higher-low continuation structure. Fast momentum and elevated ATR characterize an active upside expansion rather than a low-volatility consolidation, while 7490.50 remains the defined opposite-pivot threshold beneath the current advance.
View charts on: AlphaWebTrader HTF Charts
NQ Daily View
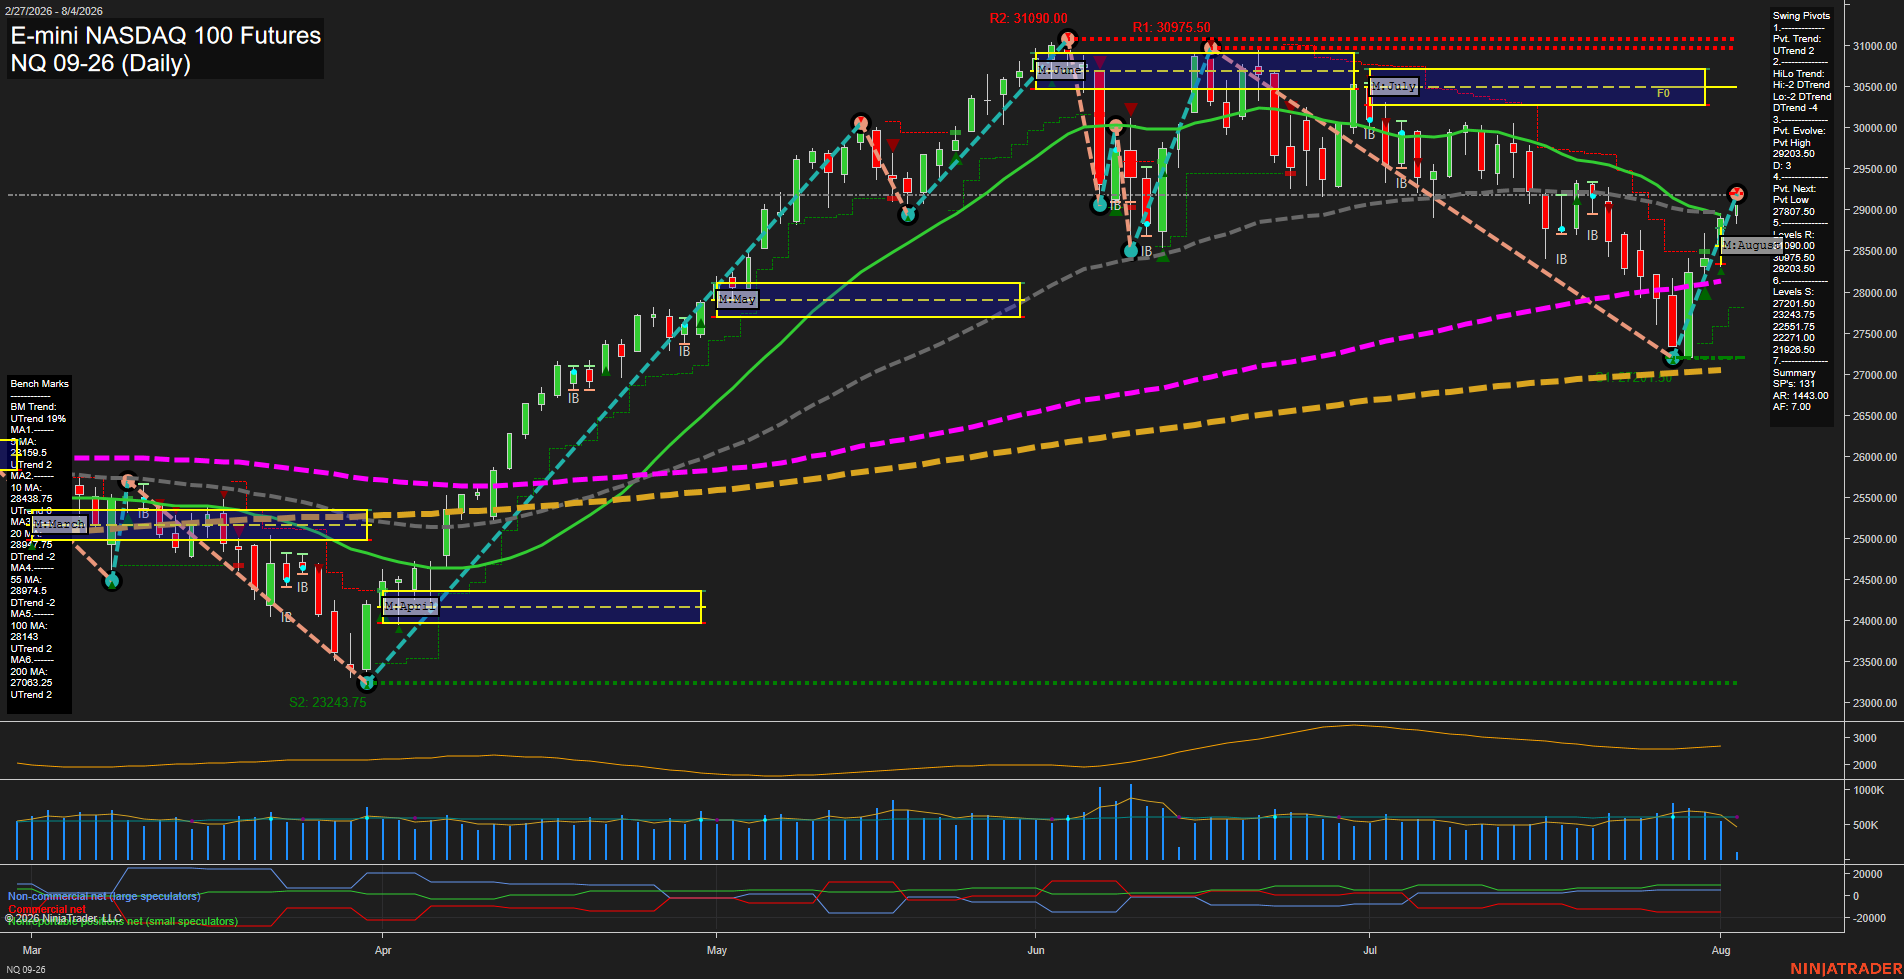
Overall Rating
- Short-Term: Bullish
- Intermediate-Term: Neutral
- Long-Term: Bullish.
Key Insights Summary
Price has produced a fast V-recovery from the late-July 27201.50 swing low and is trading above the rising 5-, 10-, 100-, and 200-day benchmarks. The short-term pivot trend, weekly grid, and August monthly grid are upward, although price is testing the 29203.50 pivot-high resistance area while the 20- and 55-day benchmark trends remain down. This creates a bullish short-term recovery within an intermediate-term repair phase; 27807.50 is the key new-pivot reversal level, while 30975.50 to 31090.00 marks the major overhead swing-resistance zone.
View charts on: AlphaWebTrader HTF Charts
CL Daily View
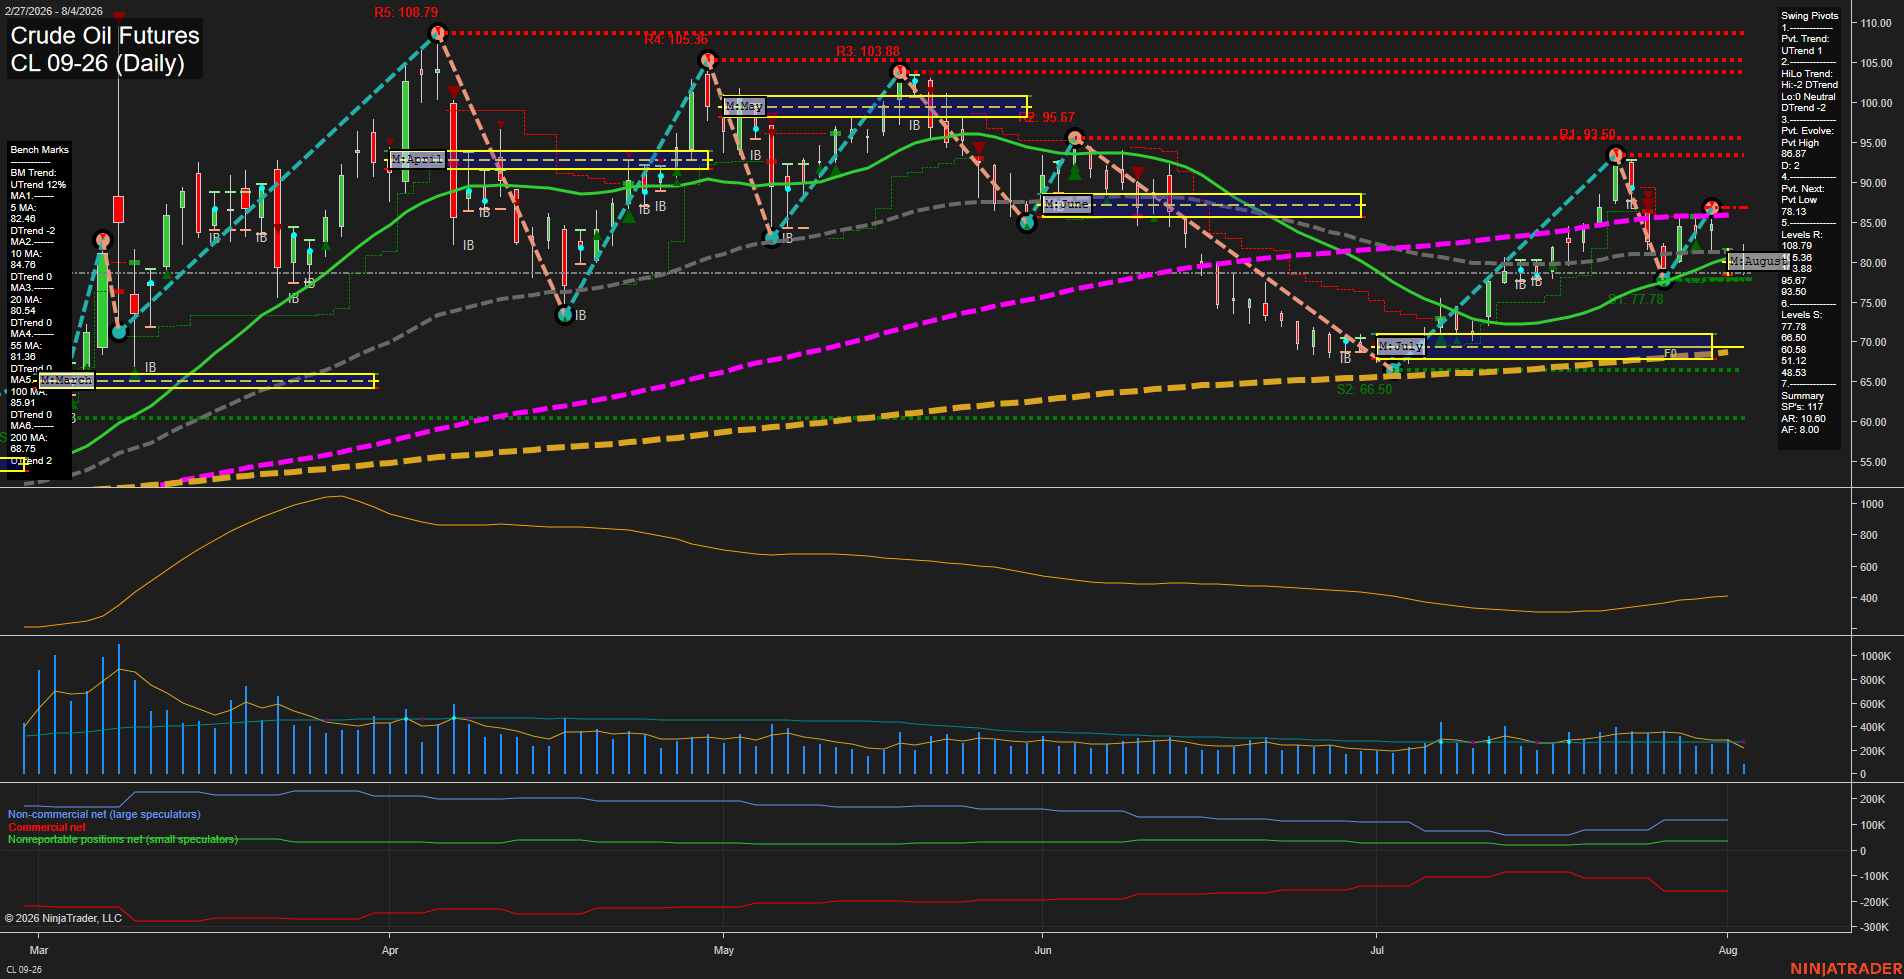
Overall Rating
- Short-Term: Bearish
- Intermediate-Term: Bearish
- Long-Term: Bullish.
Key Insights Summary
CL is consolidating near 80.00 after a sharp late-July rejection from the 93.50 pivot resistance area. The short-term pivot sequence remains upward, but price is below the weekly and monthly Fib centers and beneath the 5-, 10-, 20-, and 55-day benchmarks, reflecting a bearish countertrend phase. The 77.78 support area and 78.38 next-pivot level define the near-term downside structure, while 80.54 to 84.76 is an overhead moving-average congestion zone. The broader 2026 structure remains constructive because price is well above the rising 200-day benchmark and the yearly Fib grid remains positive, although the 100-day average near 85.91 remains a major longer-term recovery threshold.
View charts on: AlphaWebTrader HTF Charts
GC Daily View
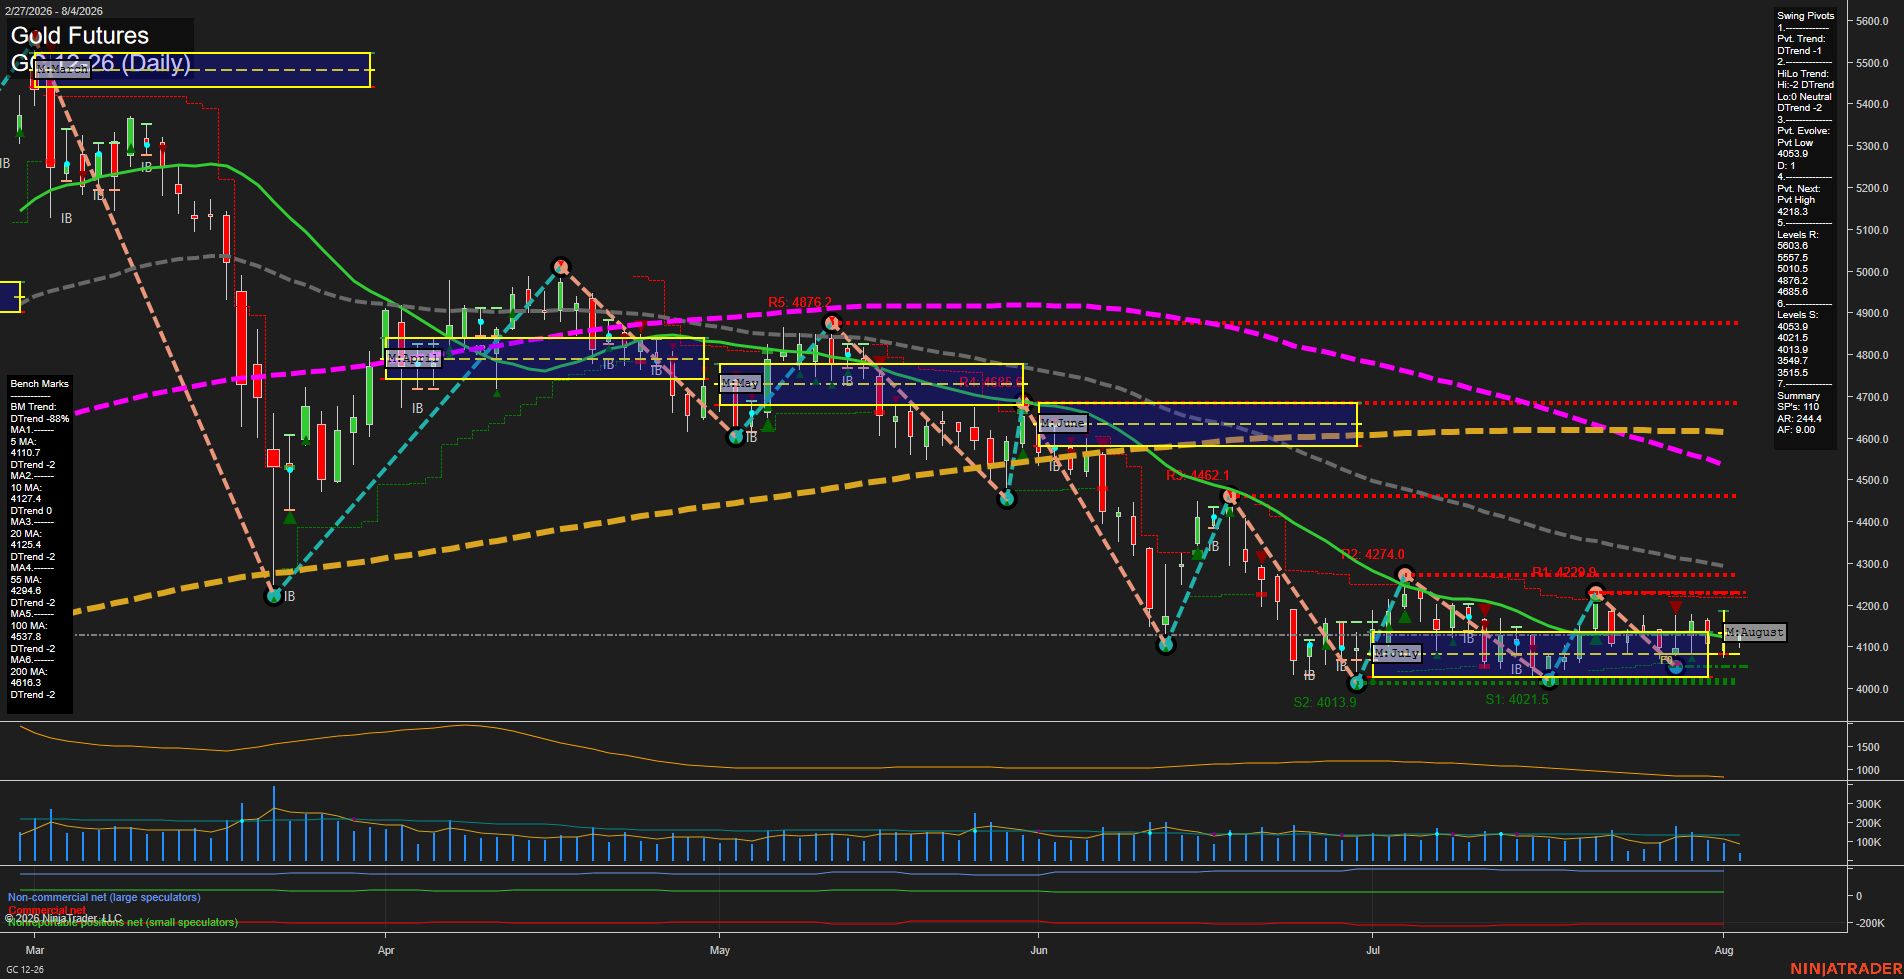
Overall Rating
- Short-Term: Bearish
- Intermediate-Term: Bearish
- Long-Term: Bearish.
Key Insights Summary
Gold remains in a broad bearish swing structure, with both pivot trend measures down and price positioned below every daily benchmark from the 5-day through the 200-day average. Recent price action is compressed into a small-bar consolidation around 4110.7, bounded by pivot support near 4053.9 and the next pivot-high level at 4218.3. The July-August range reflects a countertrend pause following the June selloff rather than a confirmed trend reversal, while declining momentum and downward WSFG, MSFG, and YSFG alignment maintain the dominant lower-high, lower-low market character.
View charts on: AlphaWebTrader HTF Charts