NYSE pre-market radar tracks ETF movers and bullish futures trends as Strait of Hormuz hopes lift U.S. indexes while tech, oil and gold diverge.
Fundamentals: U.S. index futures were mixed-to-firmer as discussions on restoring Strait of Hormuz shipping supported risk sentiment. Dow and S&P 500 futures gained while Nasdaq 100 futures lagged amid uneven technology earnings reactions. Oil steadied near $80, gold advanced on geopolitical and dollar factors, and markets awaited ISM Services PMI and crude inventory data.
Technicals: Pre-market focus includes gains in QQQ, Nvidia and Apple, alongside declines in Amazon and the U.S. Oil Fund. ES, NQ, YM, EMD, RTY and FDAX futures retain bullish short-, intermediate- and long-term technical ratings, with prices testing or exceeding key pivot resistance areas after sharp late-July recoveries.
Pre-Market Trading 360° view Market Radar of: holidays, earnings, eco-news, market-news summary, news sentiment, prior session major ETFs, MAG7, Higher Time Frame Analysis Indices Futures Summary, and E-mini S&P500, Nasdaq 100, NYMEX Crude, Gold Futures Daily Chart analysis.
As of: August 5, 2026 07:16 CT
Earnings Radar
Monitoring for earnings releases by the Magnificent 7, AI-tech-related firms, and major financial institutions.
- MCHP Release: 2026-08-06 T:AMC
Conclusion: Microchip Technology (MCHP) reports after the close on Aug. 6. As a semiconductor earnings event, it places chip-sector results and post-release price discovery on the near-term index-futures calendar; market momentum and volume can slow ahead of major earnings releases, especially MAG7, AI, semiconductors, and related tech names.
For full details visit: Yahoo Earnings Calendar
EcoNews Radar U.S. Events
| Day | Time | Impact | Event |
|---|---|---|---|
| Wed | 10:00 | Medium | ISM Services PMI |
| Wed | 10:30 | Low | Crude Oil Inventories |
| Thu | 08:30 | Medium | Unemployment Claims |
| Fri | 08:30 | High | Average Hourly Earnings m/m |
| Fri | 08:30 | High | Non-Farm Employment Change |
| Fri | 08:30 | High | Unemployment Rate |
EcoNews Summary
Friday’s 08:30 USD labor-market releases are the week’s primary high-impact focus for index futures, providing a broad read on employment conditions, wage growth, and labor-market slack. Wednesday’s crude oil inventories offer an energy-specific update relevant to oil prices and inflation context.
Event Notes:
- Wednesday 10:30 – USD Crude Oil Inventories: Reports the weekly change in U.S. commercial crude oil stockpiles. Traders monitor inventory draws and builds for their influence on petroleum supply perceptions, energy prices, and inflation-sensitive markets.
- Friday 08:30 – USD Average Hourly Earnings m/m: Measures the monthly change in average employee pay. It is monitored as an indicator of wage-pressure trends within the labor market.
- Friday 08:30 – USD Non-Farm Employment Change: Measures the monthly change in employment outside the farm sector. It provides a broad gauge of hiring activity and labor-market strength.
- Friday 08:30 – USD Unemployment Rate: Measures the percentage of the labor force that is unemployed and actively seeking work. It is monitored for evidence of labor-market tightness or weakening.
Conclusion:
The single most important event is Friday at 08:30, USD Non-Farm Employment Change, released alongside Average Hourly Earnings and the Unemployment Rate. This concentrated labor-market data release is a key catalyst for index-futures volatility at release time. Wednesday’s crude inventory data also provides energy-price and inflation context; high oil prices directly affect markets through inflation and geopolitical concerns.
For full details visit: Forex Factory EcoNews
Market News Summary:
Index futures were mixed-to-firmer as progress toward reopening the Strait of Hormuz supported risk sentiment, while technology earnings reactions capped Nasdaq strength.
Primary Drivers & Risks:
- Primary Driver: Hormuz reopening hopes lift risk assets
- Primary Risk: Middle East conflict and AI valuation concerns
Tone:
Cautiously constructive, with uneven technology leadership.
Stock Market / ETFs / Indices:
U.S. futures advanced modestly, with Dow futures up 195 points and S&P 500 futures gaining 0.41% in early trading, supported by Middle East agreement optimism. Nasdaq 100 futures lagged as investors sold shares tied to SpaceX and AMD despite upbeat forecasts. The S&P 500 reached a record high and faces a cited technical resistance test, while European Stoxx 600 also closed at a record.
Geopolitical:
U.S.-Iran discussions centered on restoring shipping through the Strait of Hormuz. U.S. officials described the southern route as open, while Iran considered permitting European mine-clearing activity; reports also cited a drafted interim proposal and comments that an agreement was close.
Oil / Energy:
Oil steadied near $80 after a two-day decline as traders monitored Hormuz traffic and negotiations. Energy markets also reflected a sharp EIA crude inventory draw, robust refinery activity, resilient LNG demand, and continuing supply-security concerns.
Gold / Metals:
Gold rose amid Middle East uncertainty, weaker-dollar support, and softer labor-market data. Gold traded toward the $4,200 technical resistance area, while silver also rebounded ahead of U.S. employment data.
Fed / Financials:
Kansas City Fed President Jeff Schmid said inflation pressures extend beyond energy and that returning inflation to 2% requires tighter policy. Schmid also flagged the financial implications of the AI buildout for monitoring.
Conclusion:
Hormuz reopening discussions supported global equities and helped stabilize oil after its recent retreat. Record levels in the S&P 500 and Stoxx 600 reflected continued broad risk appetite.
Technology remained divided, with AI spending returns driving differentiation among megacaps and post-earnings pressure weighing on parts of the Nasdaq. Middle East developments, inflation-focused Fed remarks, gold strength, and elevated equity technical concerns remained active cross-currents.
Market News Sentiment
Market News Articles: 54
- Neutral: 48.15%
- Positive: 33.33%
- Negative: 18.52%
Sentiment Summary: Market news sentiment is predominantly neutral (48%), with positive coverage (33%) exceeding negative coverage (19%).
Conclusion: Indices futures day traders are facing a largely balanced news backdrop with a modestly positive tilt.
GLD,Gold Articles: 13
- Positive: 53.85%
- Neutral: 23.08%
- Negative: 23.08%
Sentiment Summary: GLD/Gold coverage is moderately positive, with 54% positive, 23% neutral, and 23% negative articles.
Conclusion: Gold-related news tone is positive overall, while nearly half of coverage remains neutral or negative.
USO,Oil Articles: 8
- Negative: 37.50%
- Neutral: 37.50%
- Positive: 25.00%
Sentiment Summary: USO/Oil coverage is mixed to slightly negative, with 38% negative, 38% neutral, and 25% positive articles.
Conclusion: Oil-related news tone presents a modest negative skew, while neutral coverage remains equally represented.
Market Data Snapshot
ETF Snapshot of major stock market ETFs, Mag7, and others as of: August 5, 2026 07:16
Top Movers & Losers
- QQQ 723.85 Bullish 3.40% ▲
- NVDA 211.94 Bullish 2.56% ▲
- AAPL 309.38 Bullish 1.96% ▲
- META 587.94 Bearish -0.39% ▼
- AMZN 277.42 Bearish -2.32% ▼
- USO 115.78 Bearish -5.19% ▼
Major Index ETFs: SPY, QQQ, DIA, IWM, IJH
- QQQ 723.85 Bullish 3.40% ▲
- IWM 301.71 Bullish 1.85% ▲
- SPY 771.33 Bullish 1.80% ▲
- IJH 77.48 Bullish 1.80% ▲
- DIA 540.43 Bullish 1.73% ▲
Major index ETFs are Bullish across the group: QQQ is the most bullish mover at +3.40%, followed by IWM at +1.85%. SPY and IJH each gained +1.80%, while DIA is the least positive mover at +1.73%.
Mag 7 Stocks: AAPL, MSFT, GOOG, AMZN, META, NVDA, TSLA
- NVDA 211.94 Bullish 2.56% ▲
- AAPL 309.38 Bullish 1.96% ▲
- TSLA 327.35 Bullish 1.64% ▲
- MSFT 492.81 Bullish 1.06% ▲
- GOOG 375.35 Bullish 0.77% ▲
- META 587.94 Bearish -0.39% ▼
- AMZN 277.42 Bearish -2.32% ▼
Mixed Mag7 snapshot: NVDA is the most bullish mover at +2.56%, followed by AAPL at +1.96% and TSLA at +1.64%. AMZN is the most bearish mover at -2.32%, while META is modestly Bearish at -0.39%.
Cross-Market ETFs: TLT, GLD, USO, IBIT
- TLT 82.82 Bullish 0.77% ▲
- GLD 374.16 Bullish 0.66% ▲
- IBIT 36.39 Bullish 0.64% ▲
- USO 115.78 Bearish -5.19% ▼
Mixed cross-market snapshot: TLT is the most bullish mover at +0.77%, followed by GLD at +0.66% and IBIT at +0.64%. USO is the most bearish mover, down -5.19%.
ETF, Mag7, and Cross-Market ETF Insights
Overall Tone
Bullish equity participation is broad, led by QQQ at +3.40%, while USO at -5.19% creates notable cross-market divergence.
Equity ETFs and Mag7:
Major Index ETFs were broadly Bullish: QQQ was the most bullish index ETF at +3.40%, followed by IWM at +1.85%, while DIA was the least positive at +1.73%; SPY and IJH both gained +1.80%. Mag7 participation was Mixed, with NVDA up +2.56% as the most bullish Mag7 mover and AMZN down -2.32% as the most bearish mover. AAPL rose +1.96% and TSLA gained +1.64%, while META slipped -0.39%, showing selective leadership despite broad Bullish index ETF moves.
Cross-Market ETFs:
Cross-market ETFs were Mixed: TLT gained +0.77% as the most bullish mover, with GLD up +0.66% and IBIT higher by +0.64%. USO was the most bearish cross-market mover at -5.19%, sharply diverging from Bullish equities and modest Bullish bond, gold, and bitcoin ETF moves.
Futures Indices – Higher Time Frame Analysis
Summary of the current state of US Indices Futures based on higher time-frame (HTF) technical analysis as of: 2026-08-05: 07:16 CT.
US Indices Futures
- ES: YSFG/MSFG/WSFG above F0%/NTZ, 20-200 benchmarks rising; 5/10-day trends down weekly, resistance 7808-7830, pivot support 7401.50.
- NQ: YSFG/MSFG/WSFG upward, above all benchmarks, higher pivots; resistance 29990 then 30975.50-31090, pivot support 28537.50 and 27201.50.
- YM: YSFG/MSFG/WSFG above centers, all six benchmarks rising, higher pivots; price above 54504 resistance, support/reversal references 53096, 52018, and 51630.
- EMD: YSFG/MSFG/WSFG above F0%/NTZ, 20-200 benchmarks rising; pivot resistance 3899.2-3899.9, next-pivot reference 3793.3/3671.1, established support 3304.7.
- RTY: YSFG/MSFG/WSFG aligned upward, above benchmarks and higher pivots; resistance cluster 3057.7-3068.4, primary swing support 2902.3.
- FDAX: MSFG/WSFG above F0%/NTZ, all benchmarks rising, higher pivots; resistance 26524, nearest next-pivot retracement reference 25800, reversal threshold 24880.
Overall State
- Short-Term: Bullish
- Intermediate-Term: Bullish
- Long-Term: Bullish
Conclusion
All six contracts retain bullish HTF alignment: Fib-grid positioning is above key F0%/NTZ or center references, benchmarks are predominantly rising, and pivot structures are higher-high/higher-low. ES, NQ, EMD, RTY, and FDAX are testing active pivot resistance, while YM is above 54504. Fast momentum and expanded ranges characterize the current phase; listed pivot references define nearby structural support.
Note: Intra-day counter-trend pullbacks or retracements may occur, HTF is context for informational usage and market structure. Glossary: Session Fib Grids periods of YSFG:’Yearly’, MSFG:’Monthly’, WSFG:’Weekly’
For full details visit: AlphaWebTrader Technicals
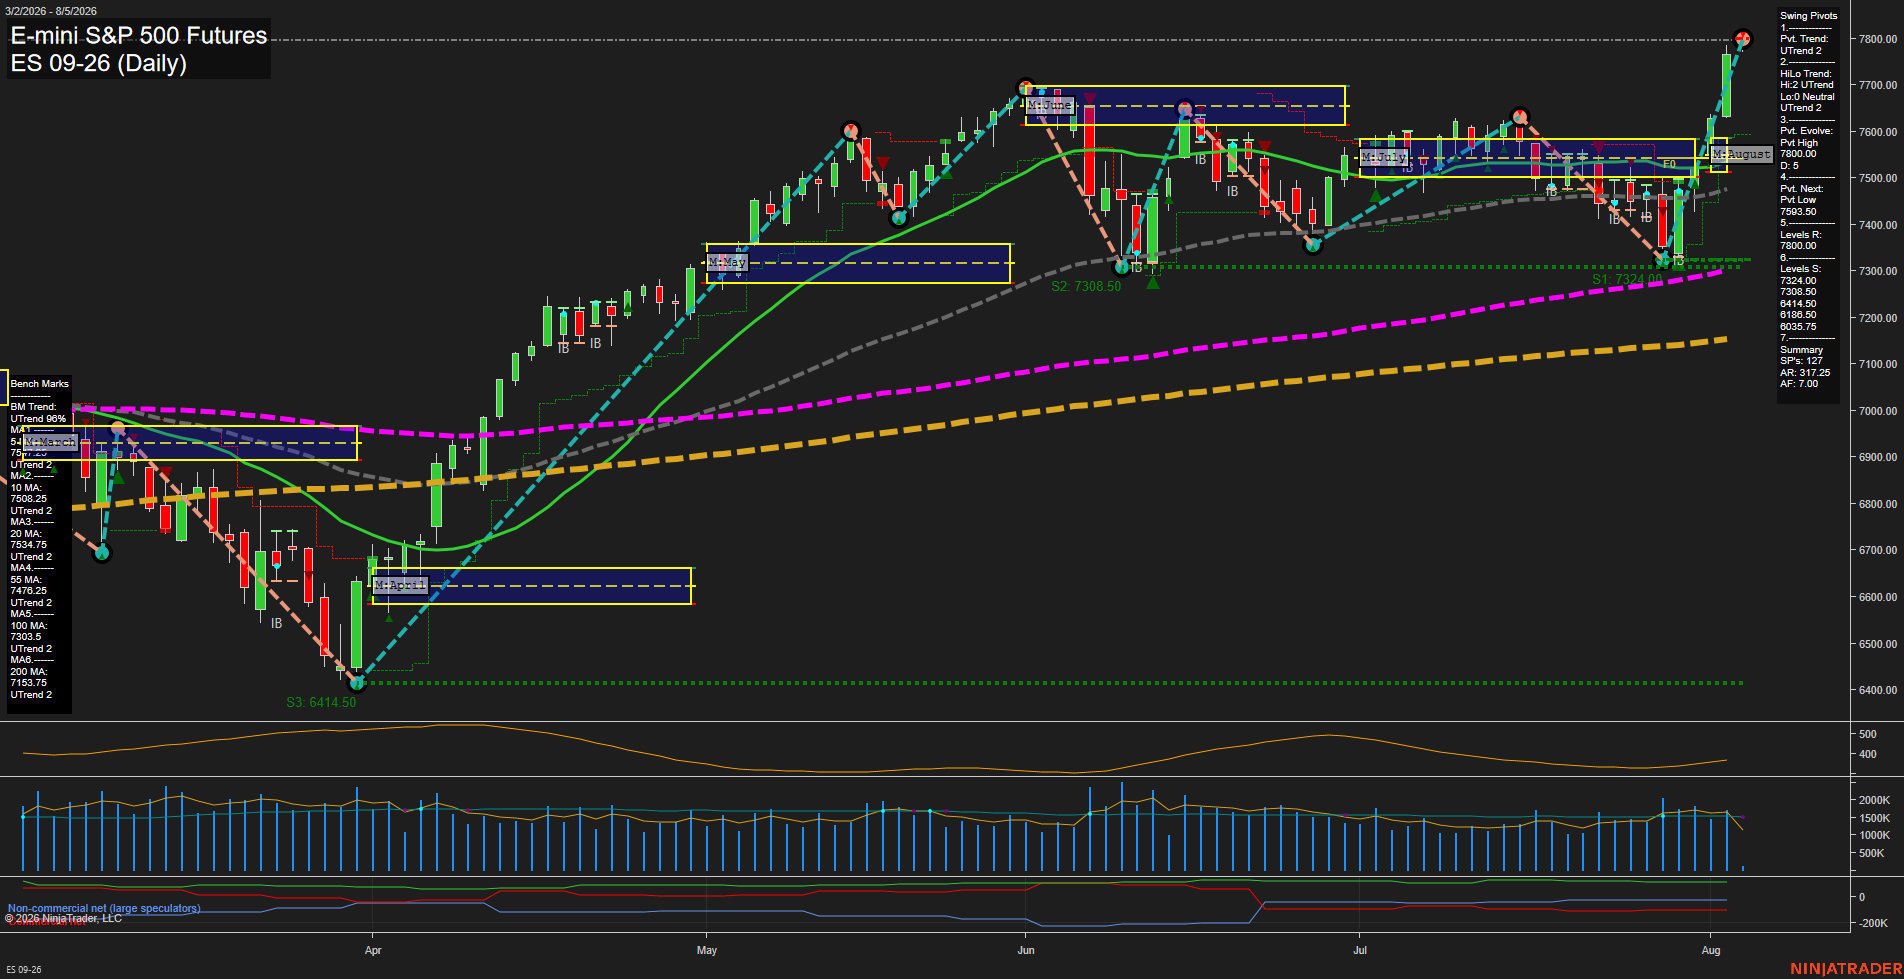
ES Daily View
Overall Rating
- Short-Term: Bullish
- Intermediate-Term: Bullish
- Long-Term: Bullish.
Key Insights Summary
ES is in a broad multi-timeframe uptrend, with price decisively above every daily benchmark and above the weekly, monthly, and yearly F0%/NTZ structures. The latest large-range advance is a fast momentum expansion through the late-July consolidation and into the 7800 area, leaving the active 7830.00 pivot-high resistance as the immediate structural reference. Higher swing lows and the UTrend reading in both pivot measures confirm trend continuation, while the distance above the short-term averages reflects a strong, extended upside impulse. Volume is firm near its moving-average measure and ATR reflects an elevated daily range environment; the 7353.50 pivot-next level and clustered 7324.00-7308.50 supports remain the principal lower swing structure.
View charts on: AlphaWebTrader HTF Charts
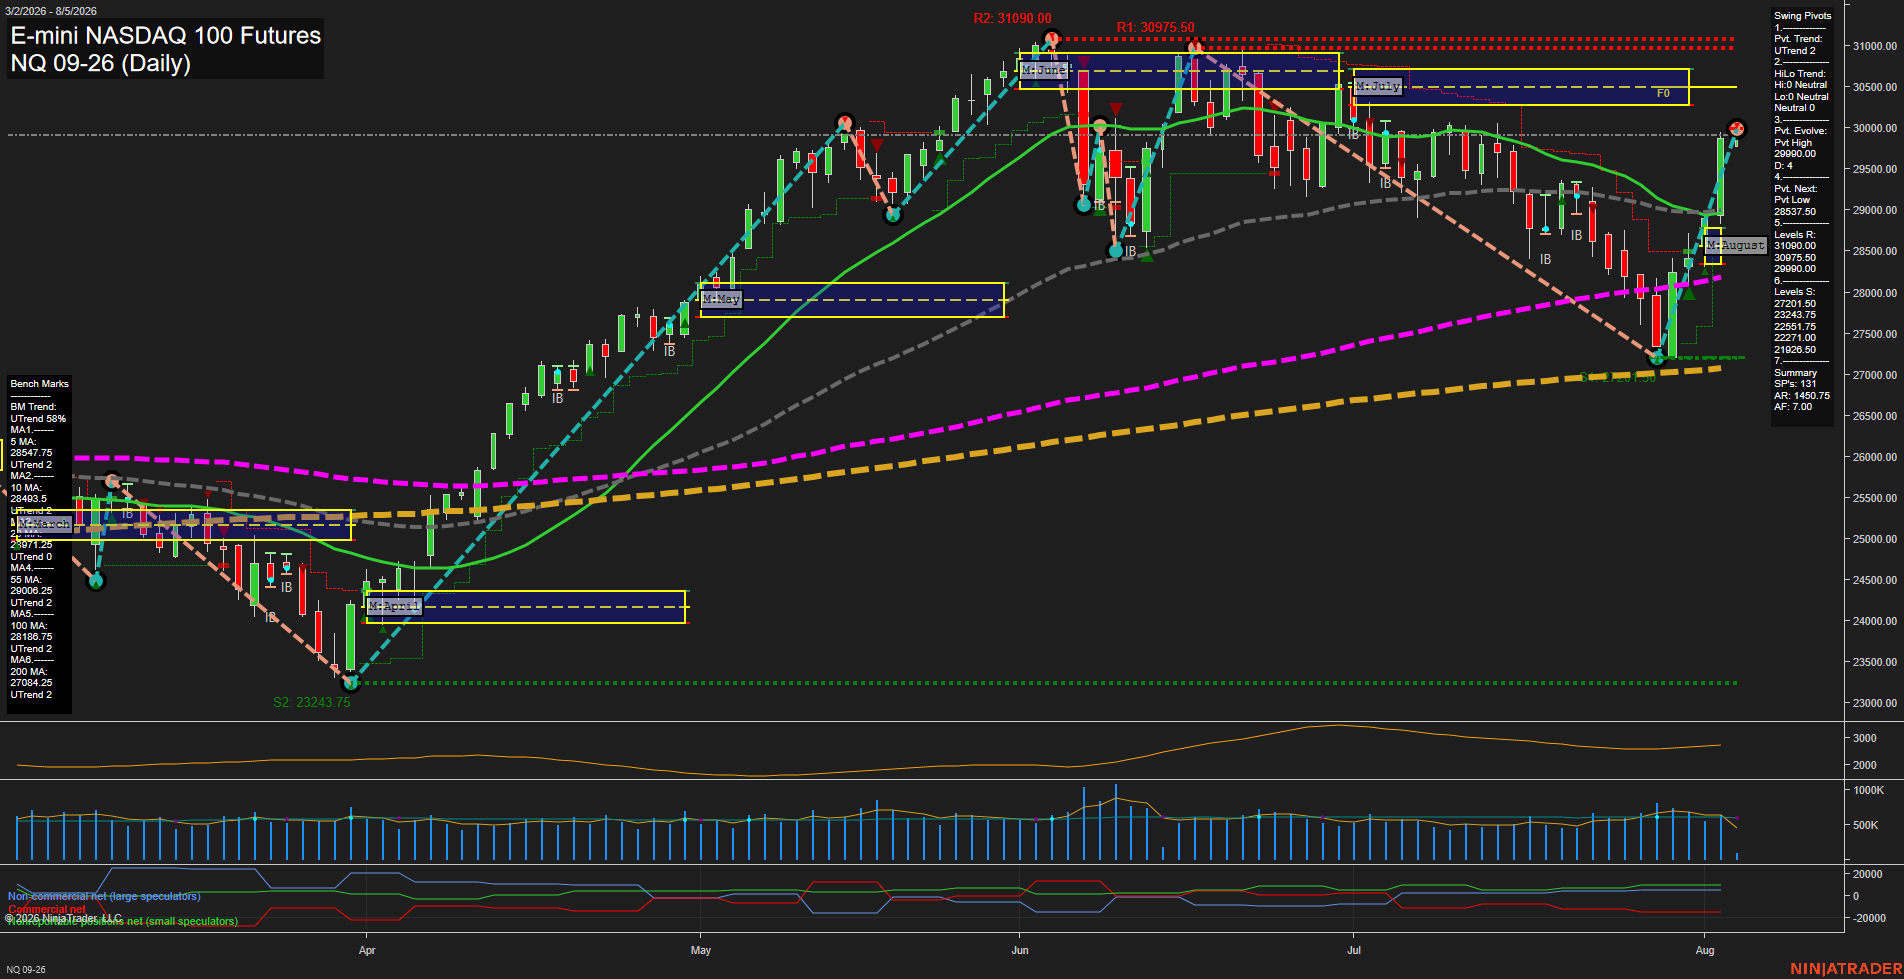
NQ Daily View
Overall Rating
- Short-Term: Bullish
- Intermediate-Term: Bullish
- Long-Term: Bullish.
Key Insights Summary
The daily structure reflects a sharp V-recovery from the late-July swing low, with large-range upside price action restoring the short-term pivot trend to UTrend. Price has reclaimed the 20-day and 55-day benchmarks and remains above all longer-term moving averages, maintaining alignment with the broader uptrend. The 29990 pivot-high area is the immediate structural reference, while 30975.50 to 31090.00 marks the principal overhead resistance band. The 28537.50 pivot-low reversal level defines the nearby swing support reference beneath the recovery.
View charts on: AlphaWebTrader HTF Charts
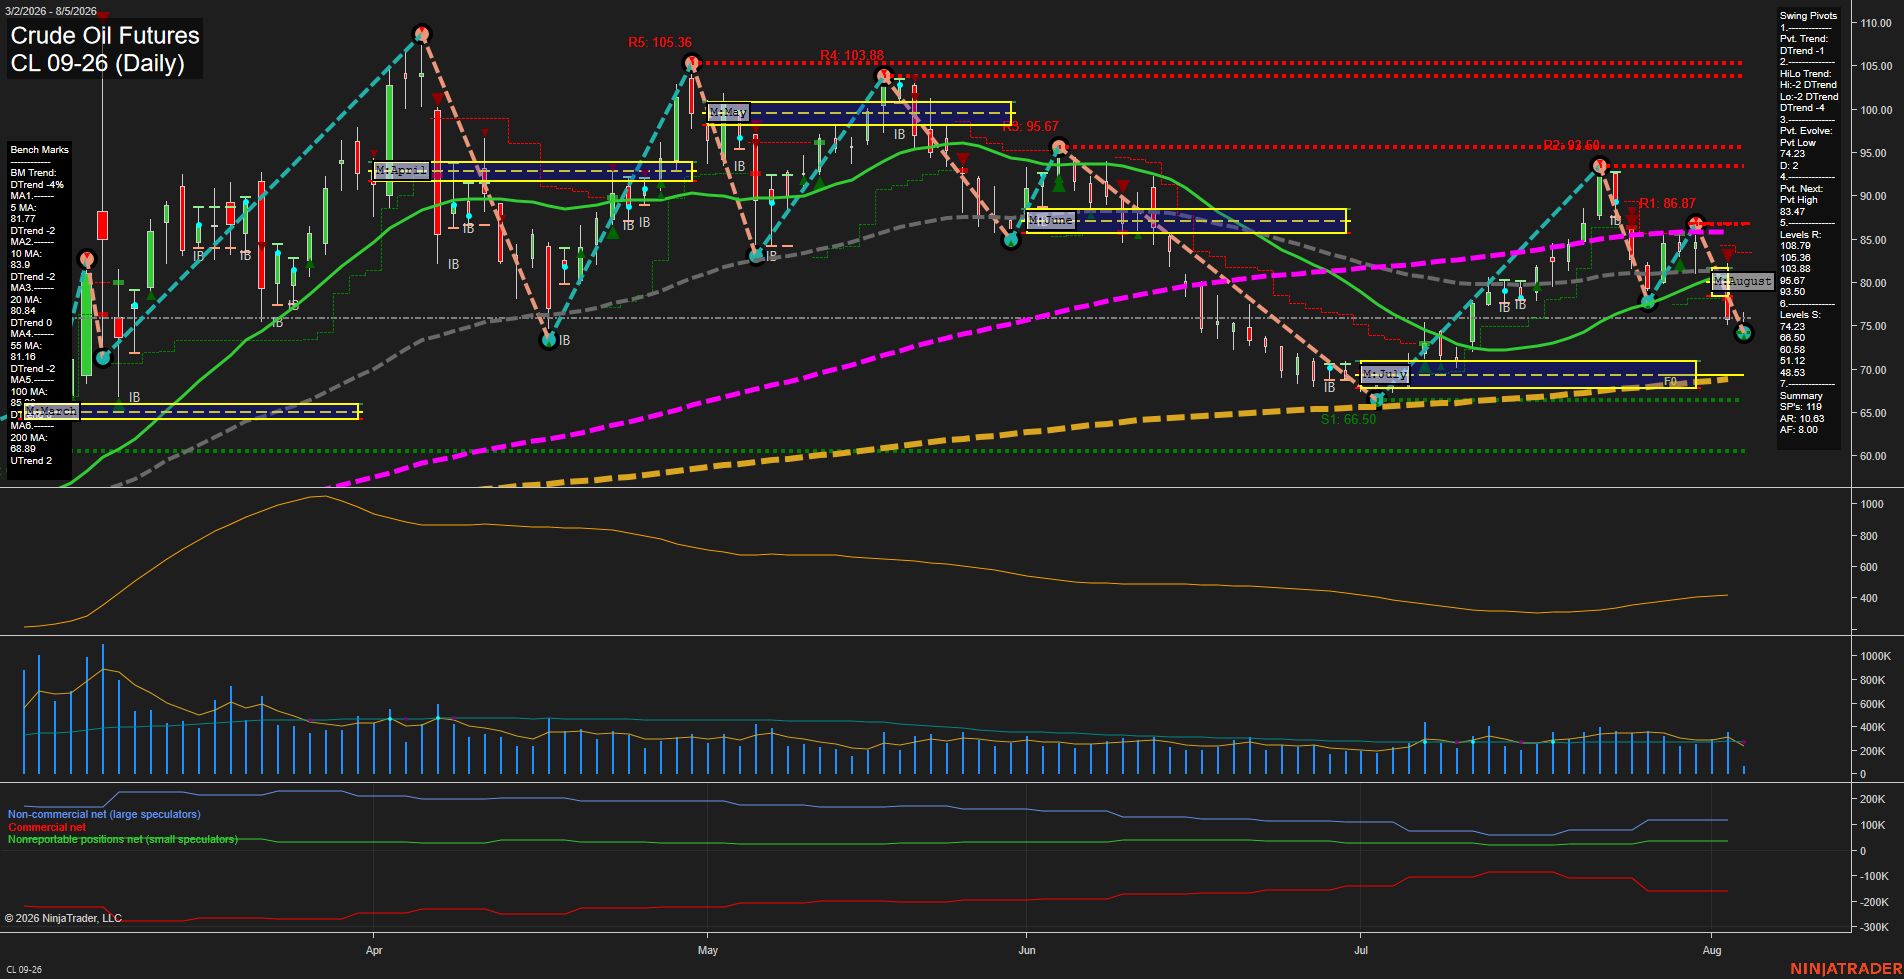
CL Daily View
Overall Rating
- Short-Term: Bearish
- Intermediate-Term: Bearish
- Long-Term: Bullish.
Key Insights Summary
CL has shifted into a sharp short-term selloff, with large downside bars and price below the weekly and August monthly F0%/NTZ areas. Both pivot trend measures are down, while price is beneath the 5-, 10-, 20-, and 55-day benchmarks, confirming broad near- and intermediate-term downside alignment. The 74.23 pivot low is the immediate structural support, with 66.50 representing the larger support zone; 83.47 is the reversal threshold for a new short-term pivot high. The yearly grid and rising 100- and 200-day long-term benchmarks preserve a broader bullish backdrop, making the current decline a pronounced countertrend retracement within that longer-term structure.
View charts on: AlphaWebTrader HTF Charts
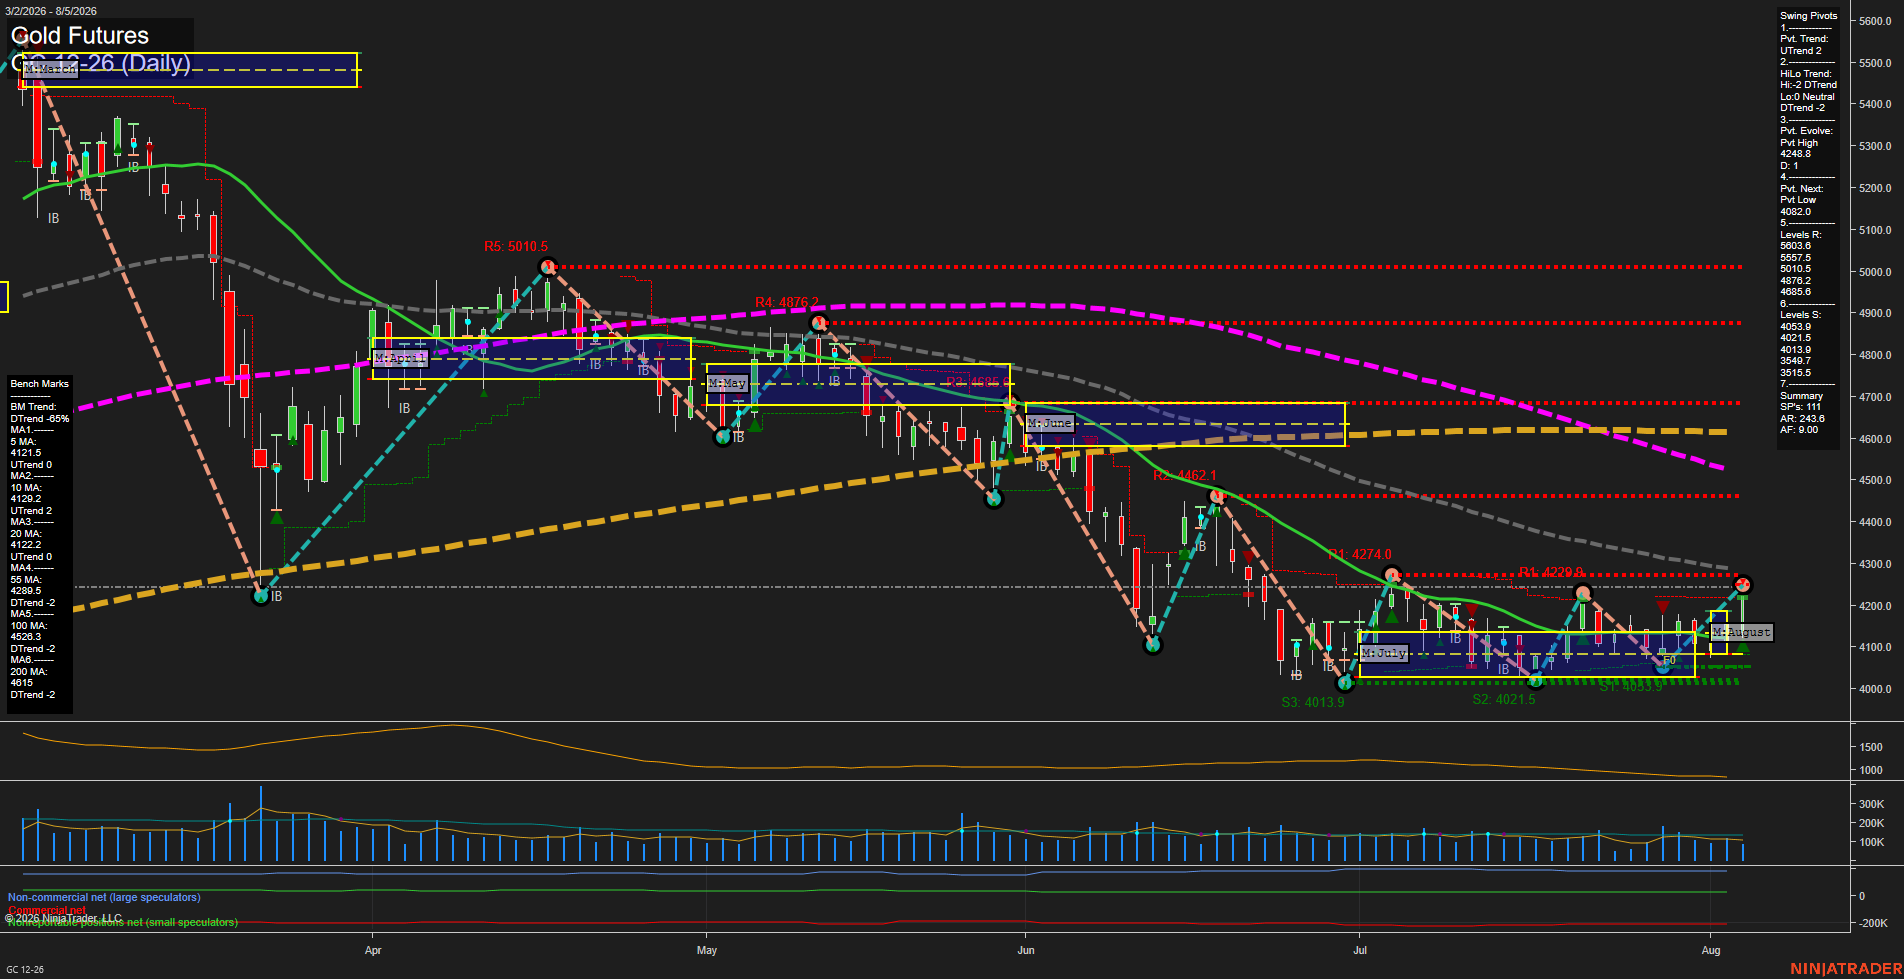
GC Daily View
Overall Rating
- Short-Term: Bullish
- Intermediate-Term: Neutral
- Long-Term: Bearish.
Key Insights Summary
Gold has produced a sharp, large-range upside recovery from the 4013.9-4053.9 support cluster, restoring the short-term pivot structure to UTrend and lifting price above the weekly and monthly F0%/NTZ areas. The 5-, 10-, and 20-day benchmarks have turned upward, while the developing pivot high at 4248.8 and declining 55-day average near 4289.5 define the immediate overhead test zone. The intermediate structure remains mixed because the HiLo trend is still DTrend, and the longer-term backdrop remains bearish beneath the 100- and 200-day averages. Elevated ATR reflects a volatile rebound phase rather than a settled trend continuation.
View charts on: AlphaWebTrader HTF Charts