NYSE close roundup: Hormuz shipping restrictions lifted oil, while AI spending concerns hit technology shares and higher yields pressured metals.
Fundamentals: Markets closed with mixed signals as uncertainty over Strait of Hormuz access supported crude prices, while persistent AI-spending concerns pressured major technology shares. Higher Treasury yields and a firmer dollar weighed on gold and silver. Semiconductor strength, including Nvidia's rebound, contrasted with weakness in housing-related and rocket shares amid Middle East supply risks.
Technicals: The market close reflected uneven leadership, with USO, Microsoft and Apple among the notable gainers while IBIT, DIA and Google declined. Futures technical readings remained broadly bullish across ES, YM, EMD, RTY and FDAX, though several contracts were extended near resistance. Nasdaq futures showed a short-term pullback within a larger constructive trend.
After Market Close daily snapshot: market news summary and sentiment, major ETFs, Magnificent 7 analysis, Indices Futures Higher Time Frame Analysis, and E-mini S&P500, Nasdaq 100, NYMEX Crude, Gold Futures Daily Chart analysis.
As of: August 6, 2026 05:00 CT
Market News Summary:
Strait of Hormuz uncertainty lifted energy concerns while AI-related equity pressure and higher yields shaped cross-asset trading.
Primary Drivers & Risks:
- Primary Driver: Hormuz shipping restrictions lift oil
- Primary Risk: AI spending concerns pressure technology
Tone:
Mixed, with geopolitical supply concerns offsetting risk-asset pressure.
Stock Market / ETFs / Indices:
Nasdaq and S&P 500 technology shares faced pressure as AI spending concerns persisted, while sharp intraday rebounds in SpaceX-related trading and Sandisk faded. Nvidia regained momentum amid continued semiconductor-sector tailwinds. Rocket shares fell after earnings and difficult housing-market conditions.
Geopolitical:
Iran and Oman reported an agreement in principle on most terms for partially reopening the Strait of Hormuz, including maritime entry and exit routes. Iranian draft restrictions on ship traffic and Houthi attacks on Saudi-backed forces in Yemen sustained regional supply-security concerns. U.S. actions also targeted domestic polysilicon and critical-mineral supply chains.
Oil / Energy:
Crude prices rose after Iran published restrictive Strait of Hormuz traffic conditions, with Yemen conflict developments adding to supply-disruption concerns. A separate technical report described a WTI reversal that put its 200-day moving average in focus.
Gold / Metals:
Gold and silver declined during the session as stronger Treasury yields, a firmer dollar, and higher oil prices prompted profit-taking. Longer-term bullion commentary remained constructive, citing investor confidence concerns, inflation and Fed sensitivity, and peaking real yields; fund disclosures showed divergent GLD positioning.
Fed / Financials:
Higher Treasury yields and a stronger dollar weighed on precious metals. Discussion centered on a tightening spread environment and U.S.-Japan yen intervention aimed at limiting Treasury selling pressure. Bank of Mexico held its benchmark rate at 6.5%.
Macro / Other:
July layoffs fell to their lowest level in two years, although artificial intelligence accounted for 33% of announced job cuts and remained the leading stated reason for a fifth consecutive month.
Conclusion:
Hormuz access and Middle East supply security were the central cross-market drivers, supporting oil. AI-spending concerns weighed on major technology shares.
Higher yields and a stronger dollar pressured gold and silver despite broader bullish bullion narratives. Equity signals remained mixed as semiconductor strength contrasted with technology and housing-related weakness.
Market News Sentiment
Market News Articles: 53
- Neutral: 54.72%
- Positive: 28.30%
- Negative: 16.98%
Sentiment Summary: Of 53 market news articles, 55% were neutral, 28% positive, and 17% negative, indicating predominantly neutral coverage with a positive tilt over negative items.
Conclusion: Indices futures news sentiment is broadly neutral, with positive coverage exceeding negative coverage.
GLD,Gold Articles: 16
- Positive: 43.75%
- Neutral: 43.75%
- Negative: 12.50%
Sentiment Summary: GLD/Gold coverage is 44% positive, 44% neutral, and 13% negative across 16 articles, indicating balanced-to-positive media tone.
Conclusion: Gold-related sentiment is predominantly non-negative, with positive and neutral coverage equally represented.
USO,Oil Articles: 8
- Negative: 62.50%
- Neutral: 25.00%
- Positive: 12.50%
Sentiment Summary: Oil coverage is predominantly negative (63%), with 25% neutral and 13% positive articles.
Conclusion: The oil news tone is negative overall, providing a cautious cross-market sentiment input for indices futures day traders.
Market Data Snapshot
ETF Snapshot of major stock market ETFs, Mag7, and others as of: August 6, 2026 05:00
Top Movers & Losers
- USO 118.87 Bullish 3.47% ▲
- MSFT 499.86 Bullish 2.54% ▲
- AAPL 312.41 Bullish 0.45% ▲
- IBIT 36.49 Bearish -0.68% ▼
- DIA 538.19 Bearish -0.85% ▼
- GOOG 356.62 Bearish -0.97% ▼
Major Index ETFs: SPY, QQQ, DIA, IWM, IJH
- SPY 768.56 Bearish -0.16% ▼
- IJH 76.75 Bearish -0.32% ▼
- QQQ 714.65 Bearish -0.37% ▼
- IWM 298.25 Bearish -0.51% ▼
- DIA 538.19 Bearish -0.85% ▼
Major Index ETFs were Bearish across the group. DIA led declines at -0.85%, followed by IWM at -0.51% and QQQ at -0.37%. SPY was the least negative mover at -0.16%, while IJH declined -0.32%.
Mag 7 Stocks: AAPL, MSFT, GOOG, AMZN, META, NVDA, TSLA
- MSFT 499.86 Bullish 2.54% ▲
- AAPL 312.41 Bullish 0.45% ▲
- META 589.90 Bullish 0.19% ▲
- NVDA 218.99 Bearish -0.10% ▼
- AMZN 272.26 Bearish -0.14% ▼
- TSLA 319.53 Bearish -0.63% ▼
- GOOG 356.62 Bearish -0.97% ▼
Mixed: MSFT is the most bullish mover at +2.54%, followed by AAPL at +0.45% and META at +0.19%. GOOG is the most bearish mover at -0.97%, with TSLA at -0.63%; NVDA is marginally lower at -0.10%.
Cross-Market ETFs: TLT, GLD, USO, IBIT
- USO 118.87 Bullish 3.47% ▲
- GLD 389.67 Bullish 0.01% ▲
- TLT 82.52 Bearish -0.58% ▼
- IBIT 36.49 Bearish -0.68% ▼
Mixed cross-market snapshot: USO is the most bullish mover at +3.47%, while GLD is marginally Bullish at +0.01%. IBIT is the most bearish mover at -0.68%, with TLT also Bearish at -0.58%.
ETF, Mag7, and Cross-Market ETF Insights
Overall Tone
Mixed tone: broad equity ETFs were Bearish while strong MSFT gains and a sharp USO advance created selective Bullish leadership.
Equity ETFs and Mag7:
Major Index ETFs were broadly Bearish, led lower by DIA at -0.85%, while SPY at -0.16%, QQQ at -0.37%, IJH at -0.32%, and IWM at -0.51% also declined; SPY was the least negative index ETF. Mag7 performance was selective: MSFT was the most bullish mover at +2.54%, while GOOG was the most bearish mover at -0.97%. AAPL rose +0.45% and META gained +0.19%, while NVDA at -0.10% was marginally Bearish, alongside AMZN and TSLA declines.
Cross-Market ETFs:
Cross-market ETFs were Mixed, with USO showing the strongest Bullish move at +3.47%, standing apart from Bearish equity ETFs. GLD was near-flat and marginally Bullish at +0.01%, while TLT fell -0.58% and IBIT was the most bearish cross-market mover at -0.68%. Commodity strength contrasted with weakness in bonds and bitcoin exposure.
Futures Indices – Higher Time Frame Analysis
Summary of the current state of US Indices Futures based on higher time-frame (HTF) technical analysis as of: 2026-08-06: 17:00 CT.
US Indices Futures
- ES: Bullish YSFG/MSFG/WSFG, rising benchmarks below price, pivot high 7820.25, reversal 7420.75, 20-day benchmark 7311.00.
- NQ: Bullish YSFG/MSFG/WSFG, UTrend pivots, resistance 30074-30370 and 30740-31090, support 29028-28609.50, 10-day benchmark turning down.
- YM: Bullish YSFG/MSFG/WSFG, price above rising benchmarks, pivot high 54884, reversal 52384/53402, major support 51630-45430.
- EMD: Bullish YSFG/MSFG/WSFG, UTrend pivots and rising longer benchmarks, resistance 3906.8-3908.0, support 3789.8 and 3677.8, short benchmarks softer.
- RTY: YSFG/MSFG/WSFG above centers, intermediate/long-term bullish, short-term mixed, resistance 3053.8-3068.4, support 2926.7-2902.3, 5/10-week benchmarks down.
- FDAX: Bullish YSFG/MSFG/WSFG, rising benchmarks and UTrend pivots, resistance 26524, benchmark support 26008/25865, pivot reversal 25814.
Overall State
- Short-Term: Bullish
- Intermediate-Term: Bullish
- Long-Term: Bullish
Conclusion
The index complex retains aligned bullish higher-timeframe structure: ES, YM, EMD, RTY, and FDAX hold above YSFG, MSFG, and WSFG reference areas, while NQ remains above its broader grid levels. Rising intermediate- and long-term benchmarks and UTrend pivot structures correlate across the complex. NQ, EMD, RTY, and FDAX show short-term countertrend signals, softer short benchmarks, or consolidation near pivot-high resistance; ES and YM remain extended near new highs. Key resistance is concentrated at current pivot highs, while listed pivot reversals and benchmark clusters define structural support.
Note: Intra-day counter-trend pullbacks or retracements may occur, HTF is context for informational usage and market structure. Glossary: Session Fib Grids periods of YSFG:’Yearly’, MSFG:’Monthly’, WSFG:’Weekly’
For full details visit: AlphaWebTrader Technicals
ES Daily View
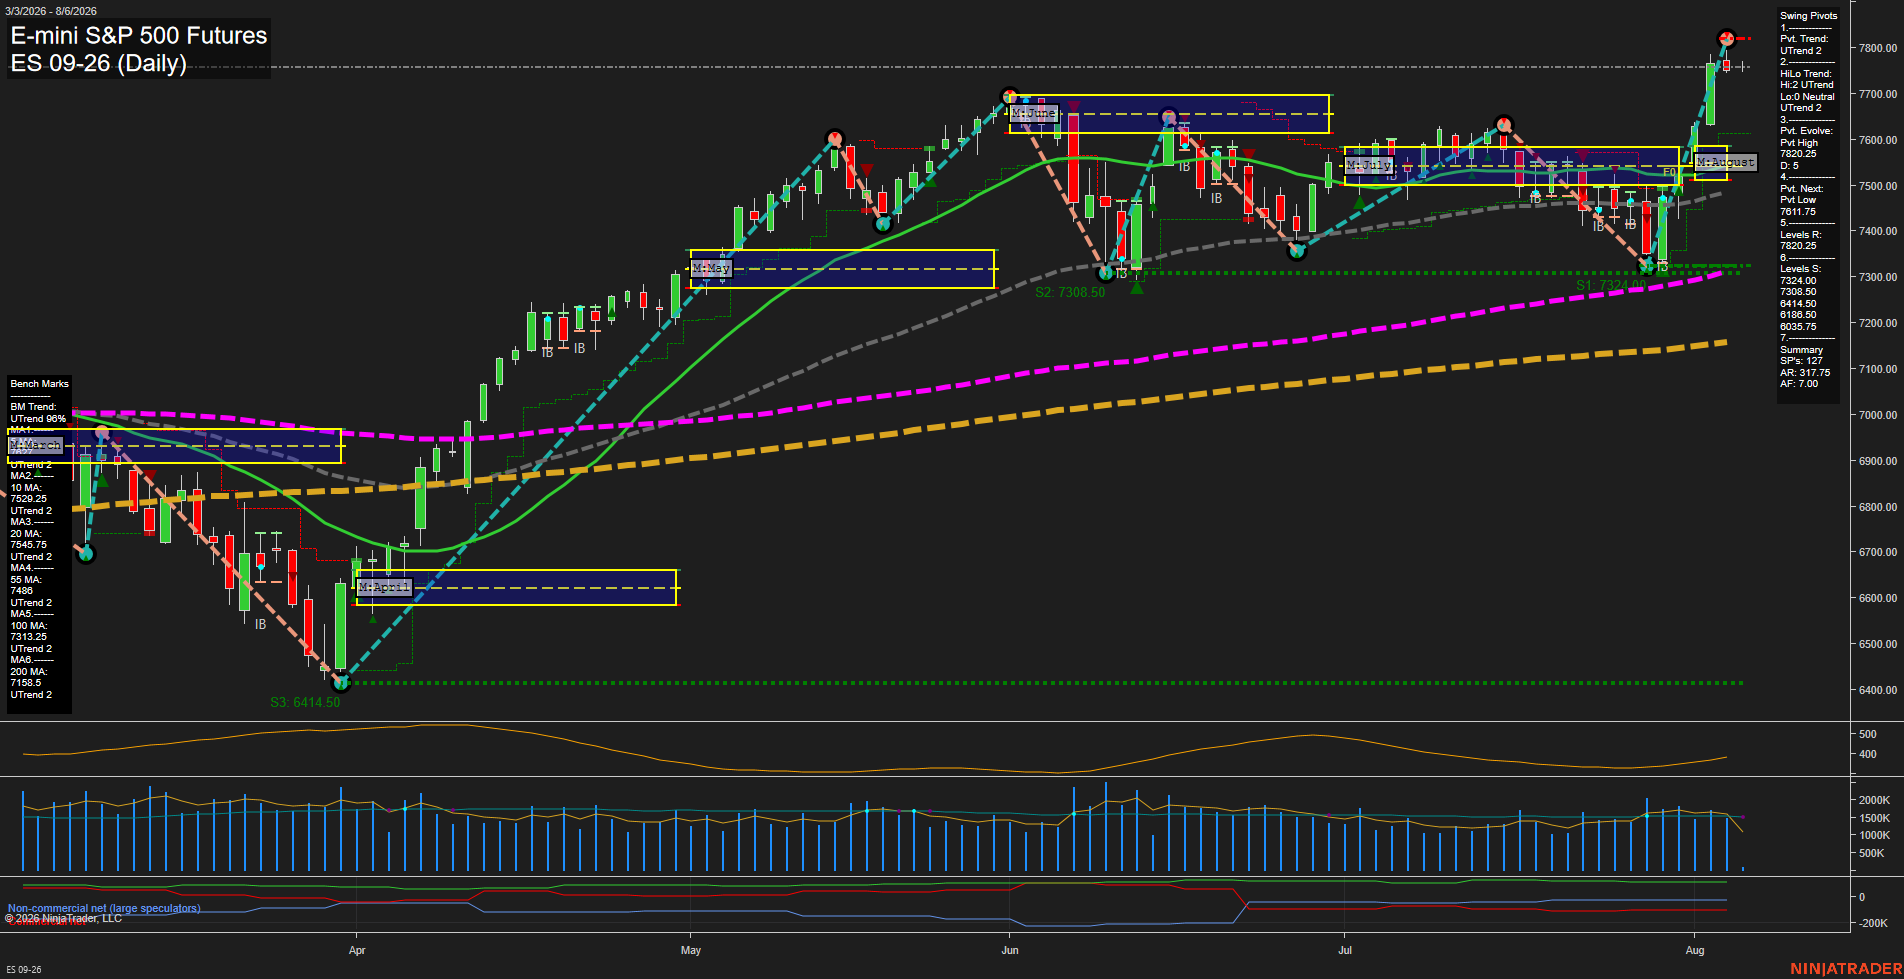
Overall Rating
- Short-Term: Bullish
- Intermediate-Term: Bullish
- Long-Term: Bullish.
Key Insights Summary
The daily swing structure remains broadly constructive, with price accelerating from the late-July 7308.50 support area into a test of the 7820.25 resistance zone and
View charts on: AlphaWebTrader HTF Charts
NQ Daily View
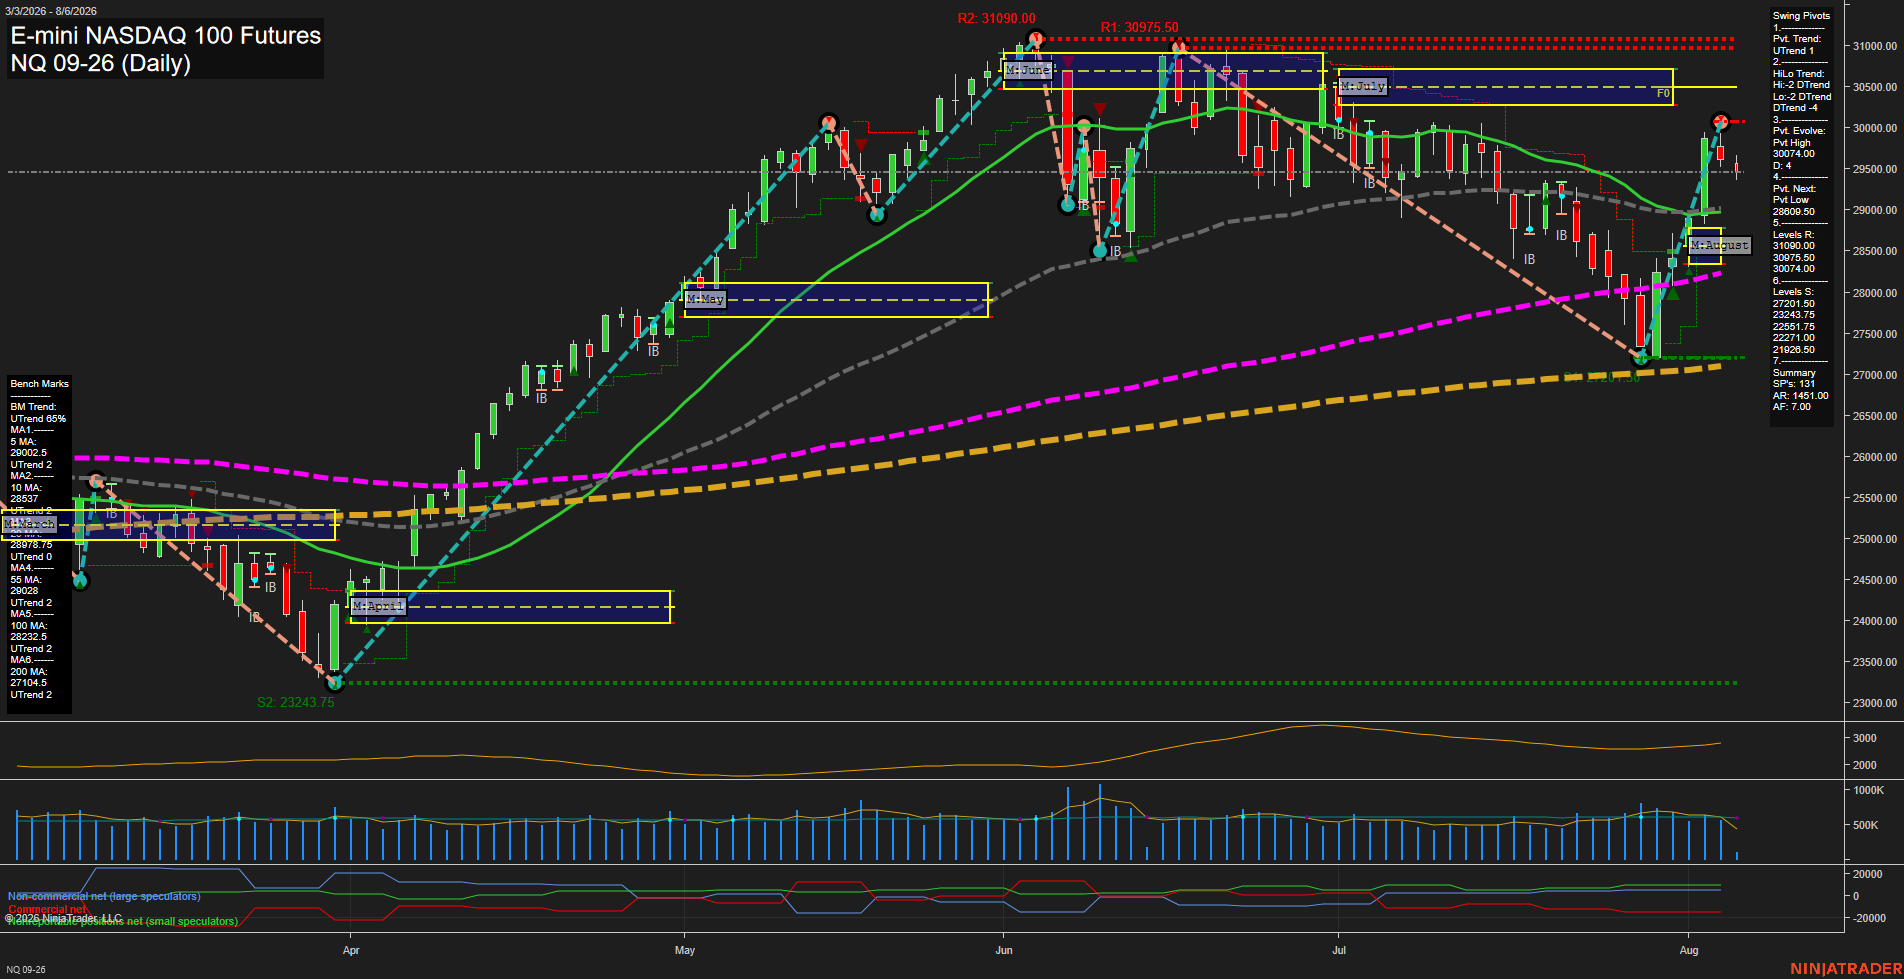
Overall Rating
- Short-Term: Bullish
- Intermediate-Term: Neutral
- Long-Term: Bullish.
Key Insights Summary
NQ completed a sharp V-style recovery from the late-July 27201.50 swing low and reclaimed the rising 5, 10, 20, and 55-day benchmarks. The short-term pivot structure is upward, although the latest medium red bar and TR120 short signal show a near-term countertrend reaction beneath the 30740 pivot-high resistance. Intermediate structure remains mixed because the HiLo pivot trend is still down despite August MSFG and price positioning above its F0% level. The broader 100-day, 200-day, and yearly grid trends remain constructive, while 30740 through 31090 defines the major overhead supply zone and 29028 to 28609.50 marks the principal nearby pivot and benchmark support area.
View charts on: AlphaWebTrader HTF Charts
CL Daily View
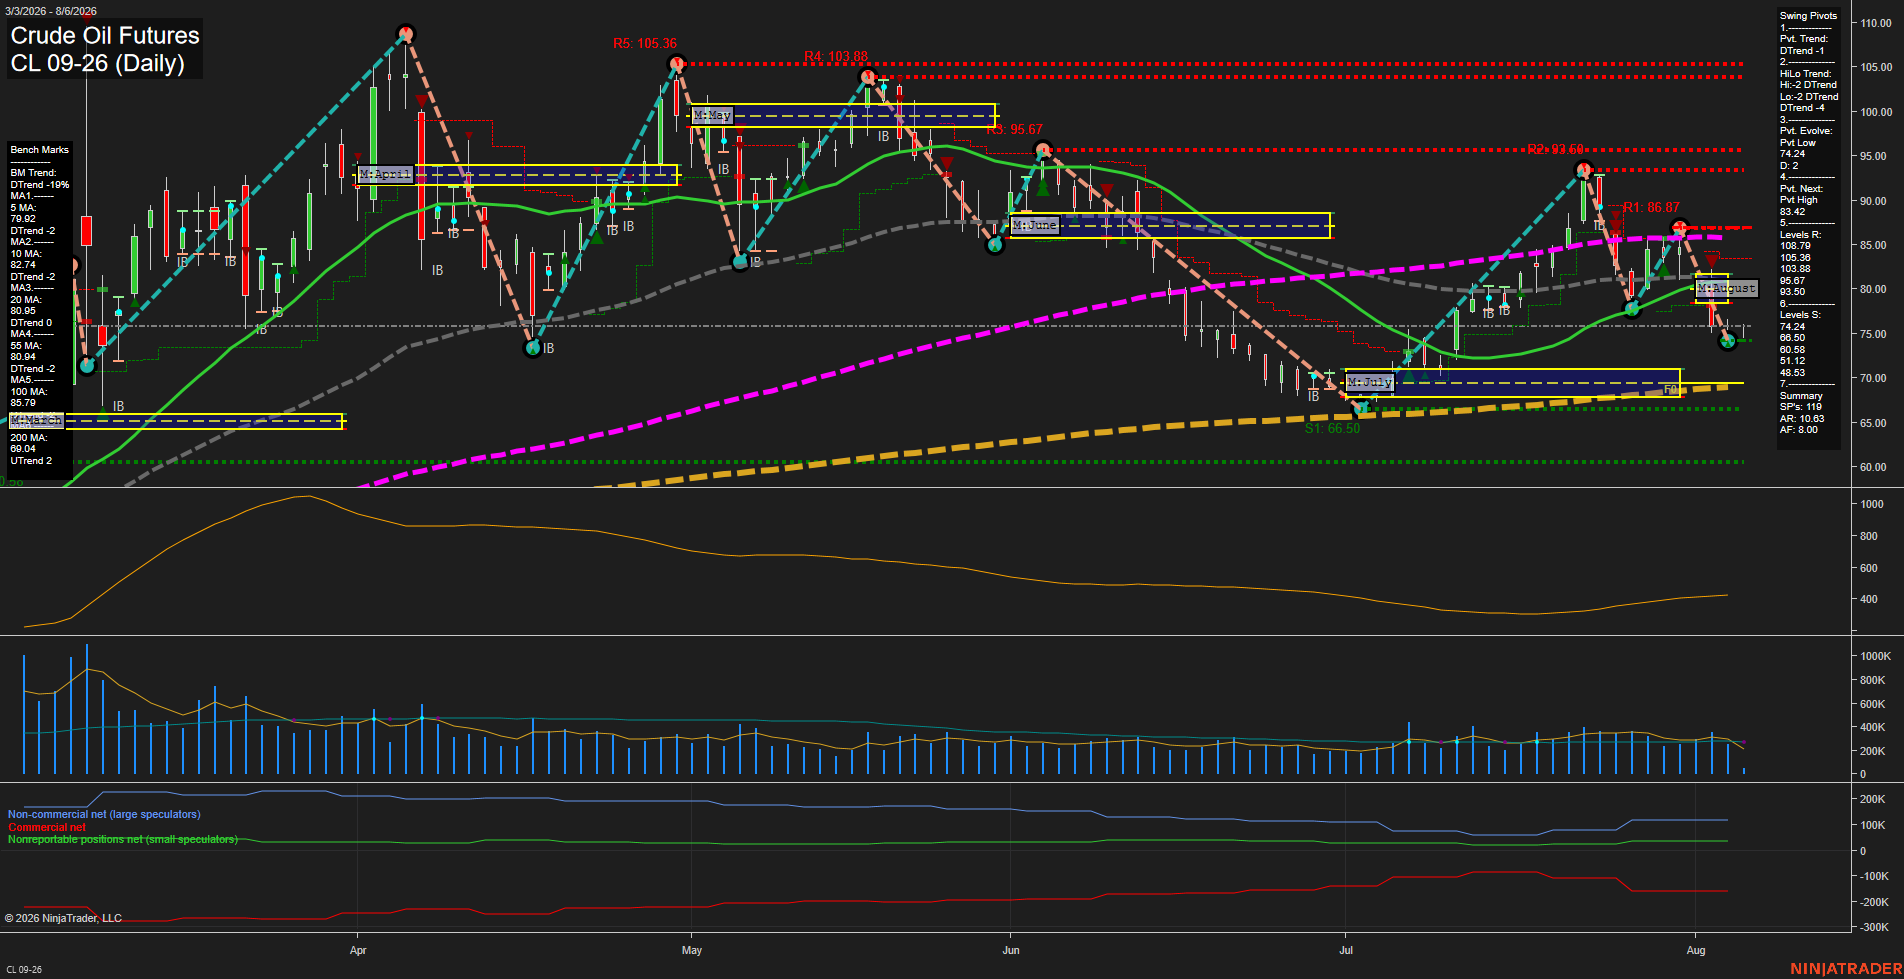
Overall Rating
- Short-Term: Bearish
- Intermediate-Term: Bearish
- Long-Term: Bullish.
Key Insights Summary
CL is in a fast bearish swing decline, with price breaking below the short- and intermediate-term benchmark cluster near 79.09 to 82.74. Both weekly and monthly fib-grid readings are below F0%, while DTrend pivot structure confirms lower highs and lower lows. The 74.24 pivot low is the immediate downside reference, with 66.50 representing the next major swing-support area. Long-term structure remains constructive because the yearly grid is positive and the 100- and 200-day benchmark trends remain upward, creating a pronounced short/intermediate-term pullback within the broader yearly advance.
View charts on: AlphaWebTrader HTF Charts
GC Daily View
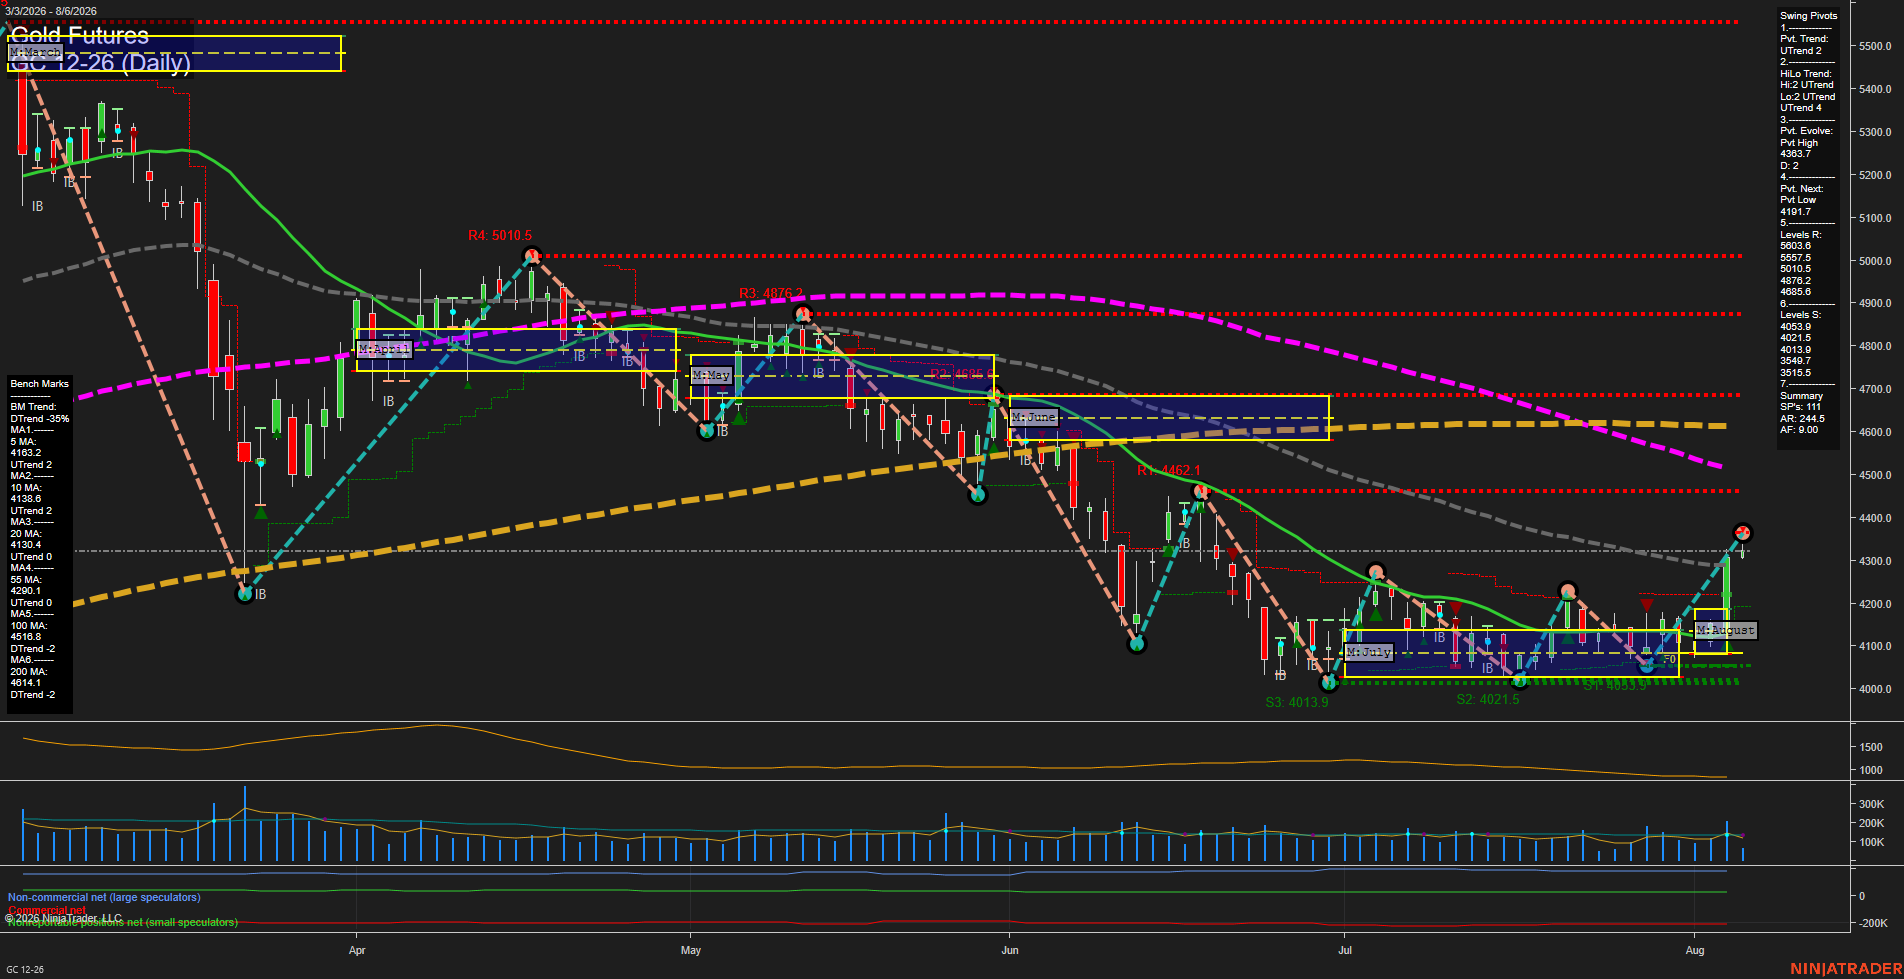
Overall Rating
- Short-Term: Bullish
- Intermediate-Term: Bullish
- Long-Term: Bearish.
Key Insights Summary
Gold produced a large upside expansion from the August NTZ and reclaimed the 55-day benchmark near 4290, confirming a sharp short-term momentum reversal. Weekly and monthly fib-grid structure, both pivot trends, and the 10-, 20-, and 55-day benchmarks align positively, while 4363.7 defines the immediate evolving swing-high area. The broader chart remains a counter-trend recovery within a bearish long-term structure because price remains below falling 100- and 200-day benchmarks. Support is concentrated near 4053.9-4013.9, while the next pivot reversal reference is 4191.7.
View charts on: AlphaWebTrader HTF Charts