NYSE pre-market futures were mixed as Dow strength offset AI and chip weakness, while oil fell, gold rose and index technicals tested resistance.
Fundamentals: U.S. index futures were mixed following record equity gains, with Dow futures higher while Nasdaq 100 futures declined amid renewed pressure on AI and semiconductor shares. Markets tracked Iran-Oman negotiations, potential Strait of Hormuz reopening, falling oil prices and easing Treasury yields. Gold advanced as investors awaited U.S. labor data and weekly unemployment claims.
Technicals: U.S. and global index futures retain broadly bullish multi-timeframe technical structures, although several markets are approaching pivot resistance after fast advances. ES, YM, RTY and FDAX remain supported by rising benchmarks, while NQ shows a short-term retracement near overhead supply. Prior-session ETF moves included gains in GLD and NVDA, with declines in AMZN, TSLA and GOOG.
Pre-Market Trading 360° view Market Radar of: holidays, earnings, eco-news, market-news summary, news sentiment, prior session major ETFs, MAG7, Higher Time Frame Analysis Indices Futures Summary, and E-mini S&P500, Nasdaq 100, NYMEX Crude, Gold Futures Daily Chart analysis.
As of: August 6, 2026 07:16 CT
Earnings Radar
Monitoring for earnings releases by the Magnificent 7, AI-tech-related firms, and major financial institutions.
- MCHP Release: 2026-08-06 T:AMC
Conclusion: Microchip Technology (MCHP) reports after the close on 2026-08-06, placing semiconductor-sector results and management commentary in focus for index futures after-hours price discovery. Market momentum and volume can slow ahead of major earnings releases, especially MAG7, AI, semiconductors, and related tech names.
For full details visit: Yahoo Earnings Calendar
EcoNews Radar U.S. Events
| Day | Time | Impact | Event |
|---|---|---|---|
| Thu | 08:30 | Medium | Unemployment Claims |
| Fri | 08:30 | High | Average Hourly Earnings m/m |
| Fri | 08:30 | High | Non-Farm Employment Change |
| Fri | 08:30 | High | Unemployment Rate |
EcoNews Summary
Friday’s 08:30 USD labor-market releases are the week’s listed high-impact focus for index futures. The combined employment, wage, and unemployment data provide a broad read on labor conditions, inflation pressure, consumer-income trends, and monetary-policy sensitivity. Thursday’s medium-impact Unemployment Claims release is excluded because it is not energy-related.
Event Notes:
- Friday 08:30 — Average Hourly Earnings m/m: Measures the monthly change in average employee pay. Traders monitor wage growth as an indicator of labor-cost pressure and inflation sensitivity.
- Friday 08:30 — Non-Farm Employment Change: Measures the change in employment outside farm work. Traders monitor it for a broad indication of labor-market strength and economic activity.
- Friday 08:30 — Unemployment Rate: Measures the percentage of the labor force actively seeking work but unemployed. Traders monitor it for signs of labor-market tightening or weakening.
Conclusion:
The single most important listed event is Friday at 08:30, Non-Farm Employment Change. Its release arrives alongside Average Hourly Earnings and the Unemployment Rate, concentrating labor-market information into one high-impact time window. Market momentum and volume often slow ahead of major labor-market releases, with increased volatility at release time.
For full details visit: Forex Factory EcoNews
Market News Summary:
Index futures were mixed after record equity gains, with AI-linked technology weakness offset by a firmer Dow outlook as markets tracked Middle East negotiations, yields, and energy supply.
Primary Drivers & Risks:
- Primary Driver: Mixed futures after record rally
- Primary Risk: AI weakness and Hormuz uncertainty
Tone:
Cautious and mixed, with rotation away from crowded technology shares.
Stock Market / ETFs / Indices:
Dow futures rose while S&P 500 futures held near flat and Nasdaq 100 futures declined. Chip shares weakened despite strong forecasts from Western Digital and SanDisk, while concern grew over the durability of AI spending and reduced hedge-fund participation after July’s technology selloff. The Dow recorded a third consecutive closing high, and technology’s recent 11.4% rebound returned the sector to overbought conditions.
Geopolitical:
Markets focused on Iran-Oman talks and details of a potential U.S.-Iran peace arrangement after the five-month war. Progress toward reopening the Strait of Hormuz supported risk sentiment in some areas, while the status of Middle East supply disruptions remained a central cross-market issue.
Oil / Energy:
Oil prices declined as optimism over a Hormuz reopening and peace talks eased supply concerns. Crude also faced pressure from a surprise U.S. inventory build and an OPEC+ September output increase. Europe’s record-low gas inventories highlighted ongoing exposure to supply-driven price spikes, while China increased Russian oil purchases to offset reduced Middle East supplies.
Gold / Metals:
Gold advanced on a softer dollar and lower Treasury yields as investors monitored Middle East developments and rate views. Gold and silver remained in focus ahead of Friday’s U.S. payrolls report, alongside softer labor data and central-bank demand.
Fed / Financials:
U.S. Treasury yields eased, with a softer jobs report identified as a factor that would add further downward pressure. Rate commentary included an outlook for two hikes this year or early next year, contrasting with bullion support tied to lower-yield and softer-labor-market themes.
Macro / Other:
German factory orders unexpectedly increased in June despite sharply higher input costs, as companies stockpiled essential equipment amid Middle East disruption concerns. Asian currencies consolidated against the dollar in a wait-and-see posture, while Japanese government bonds rose alongside U.S. Treasurys.
Conclusion:
Mixed U.S. futures reflected pressure in semiconductors and AI-related shares after a record-setting equity advance. Dow strength contrasted with Nasdaq weakness as investors reassessed crowded technology positioning.
Middle East negotiations and the potential reopening of Hormuz drove oil lower but left energy-supply risks prominent. Lower yields and a softer dollar supported gold ahead of U.S. payroll data.
Market News Sentiment
Market News Articles: 56
- Neutral: 55.36%
- Negative: 25.00%
- Positive: 19.64%
Sentiment Summary: Market news sentiment is predominantly neutral (55%), with negative coverage (25%) exceeding positive coverage (20%).
Conclusion: Indices futures day traders are facing a largely neutral news backdrop with a modest negative sentiment imbalance.
GLD,Gold Articles: 13
- Positive: 69.23%
- Neutral: 30.77%
Sentiment Summary: GLD and gold coverage is 69% positive and 31% neutral across 13 articles, with no negative articles reported.
Conclusion: Gold-related news tone is predominantly positive, while nearly one-third of coverage remains neutral.
USO,Oil Articles: 9
- Negative: 77.78%
- Neutral: 22.22%
Sentiment Summary: USO/Oil coverage is predominantly negative, with 78% negative and 22% neutral sentiment across 9 articles.
Conclusion: Oil-related news tone is negative, which may be a relevant sentiment input for indices futures traders monitoring energy-linked market activity.
Market Data Snapshot
ETF Snapshot of major stock market ETFs, Mag7, and others as of: August 6, 2026 07:16
Top Movers & Losers
- GLD 389.64 Bullish 4.14% ▲
- NVDA 219.22 Bullish 3.43% ▲
- IBIT 36.74 Bullish 0.96% ▲
- AMZN 272.65 Bearish -1.72% ▼
- TSLA 321.55 Bearish -1.77% ▼
- GOOG 360.13 Bearish -4.05% ▼
Major Index ETFs: SPY, QQQ, DIA, IWM, IJH
- DIA 542.81 Bullish 0.44% ▲
- SPY 769.79 Bearish -0.20% ▼
- IJH 77.00 Bearish -0.62% ▼
- IWM 299.77 Bearish -0.64% ▼
- QQQ 717.30 Bearish -0.90% ▼
Mixed index ETF snapshot: DIA is the most bullish mover at +0.44%, while QQQ is the most bearish mover at -0.90%. SPY is Bearish at -0.20%, with broader Bearish movement in IJH at -0.62% and IWM at -0.64%.
Mag 7 Stocks: AAPL, MSFT, GOOG, AMZN, META, NVDA, TSLA
- NVDA 219.22 Bullish 3.43% ▲
- AAPL 311.00 Bullish 0.52% ▲
- META 588.77 Bullish 0.14% ▲
- MSFT 487.46 Bearish -1.09% ▼
- AMZN 272.65 Bearish -1.72% ▼
- TSLA 321.55 Bearish -1.77% ▼
- GOOG 360.13 Bearish -4.05% ▼
Mixed Mag7 snapshot: NVDA is the most bullish mover at +3.43%, while GOOG is the most bearish mover at -4.05%. AAPL gained +0.52% and META was marginally Bullish at +0.14%; MSFT fell -1.09%, AMZN -1.72%, and TSLA -1.77%.
Cross-Market ETFs: TLT, GLD, USO, IBIT
- GLD 389.64 Bullish 4.14% ▲
- IBIT 36.74 Bullish 0.96% ▲
- TLT 83.00 Bullish 0.22% ▲
- USO 114.88 Bearish -0.78% ▼
Mixed cross-market snapshot: GLD is the most bullish mover at +4.14%, while IBIT gains +0.96% and TLT is marginally bullish at +0.22%. USO is the most bearish mover at -0.78%.
ETF, Mag7, and Cross-Market ETF Insights
Overall Tone
Mixed conditions: broad equity ETFs are Bearish while defensive precious metals strength is pronounced, with selective Bullish leadership in NVDA and AAPL.
Equity ETFs and Mag7:
Major Index ETFs are broadly Bearish, led lower by QQQ at -0.90%, while SPY is near-flat at -0.20% and DIA is the sole Bullish index ETF at +0.44%. Small and mid caps are also Bearish, with IWM at -0.64% and IJH at -0.62%, indicating selective rather than broad equity alignment. Within Mag7, NVDA is the most bullish mover at +3.43%, while GOOG is the most bearish mover at -4.05%; AAPL is Bullish at +0.52%, while MSFT, AMZN, and TSLA are Bearish.
Cross-Market ETFs:
Cross-market ETFs are Mixed, with GLD showing strong Bullish momentum at +4.14%, the most bullish mover, alongside modest gains in IBIT at +0.96% and TLT at +0.22%. USO is the most bearish mover at -0.78%, diverging from precious metals and fixed-income strength. GLD’s gain is substantially stronger than the mixed equity and commodity backdrop.
Futures Indices – Higher Time Frame Analysis
Summary of the current state of US Indices Futures based on higher time-frame (HTF) technical analysis as of: 2026-08-06: 07:16 CT.
US Indices Futures
- ES: Bullish YSFG/MSFG/WSFG, rising benchmarks, 7820.25 pivot high/resistance, 7420.75 reversal pivot, 7311.00 20-day support.
- NQ: Bullish HTF grids and benchmarks, short-term pullback beneath 30074-30370 resistance, 27279-27201.50 weekly support, 30740-31090 daily supply.
- YM: Bullish YSFG/MSFG/WSFG and rising benchmarks, 54884 pivot high, 53402 reversal pivot, 52384 weekly reference, 51630 support.
- EMD: Bullish HTF structure and grids, short-term signal conflict near 3906.8-3908.0 resistance, 3789.8 pivot-next, 3800-3822 benchmark support.
- RTY: Neutral short-term weekly, bullish intermediate/long-term, YSFG/MSFG/WSFG above centers, 3053.8-3068.4 resistance, 2926.7-2902.3 support.
- FDAX: Bullish YSFG/MSFG/WSFG, aligned rising benchmarks and UTrend pivots, 26524 resistance, 26008/25865 benchmark references, 25814 reversal pivot.
Overall State
- Short-Term: Bullish
- Intermediate-Term: Bullish
- Long-Term: Bullish
Conclusion
US index futures retain broadly aligned higher-timeframe bullish structure. ES, YM, EMD, RTY, and FDAX remain near pivot-high resistance, while NQ is retracing within its larger upward structure. YSFG, MSFG, and WSFG readings are generally above F0%/NTZ areas, supported by rising intermediate- and long-term benchmarks. Short-term signal conflict is present in NQ, EMD, RTY, and FDAX near resistance; ES and YM remain extended above nearer benchmark references. Current directional correlation remains upward across the group, with pivot support levels defining retracement structure.
Note: Intra-day counter-trend pullbacks or retracements may occur, HTF is context for informational usage and market structure. Glossary: Session Fib Grids periods of YSFG:’Yearly’, MSFG:’Monthly’, WSFG:’Weekly’
For full details visit: AlphaWebTrader Technicals
ES Daily View
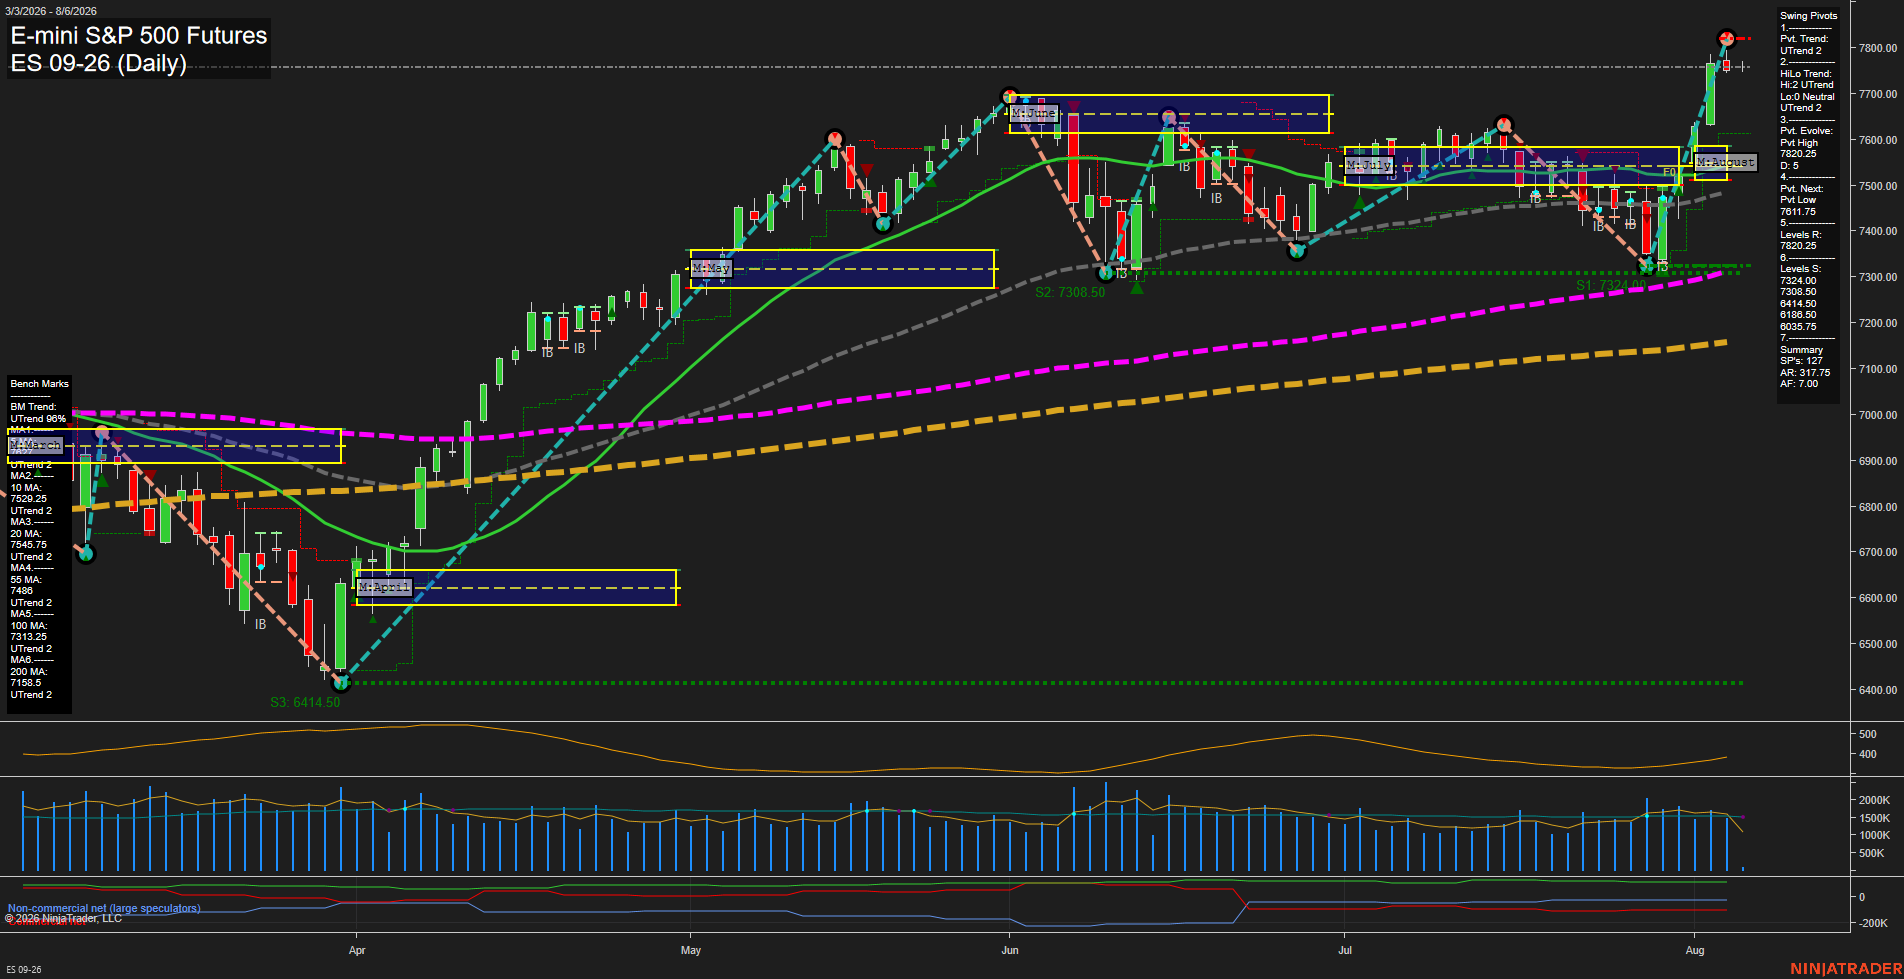
Overall Rating
- Short-Term: Bullish
- Intermediate-Term: Bullish
- Long-Term: Bullish.
Key Insights Summary
The daily swing structure remains broadly constructive, with price accelerating from the late-July 7308.50 support area into a test of the 7820.25 resistance zone and
View charts on: AlphaWebTrader HTF Charts
NQ Daily View
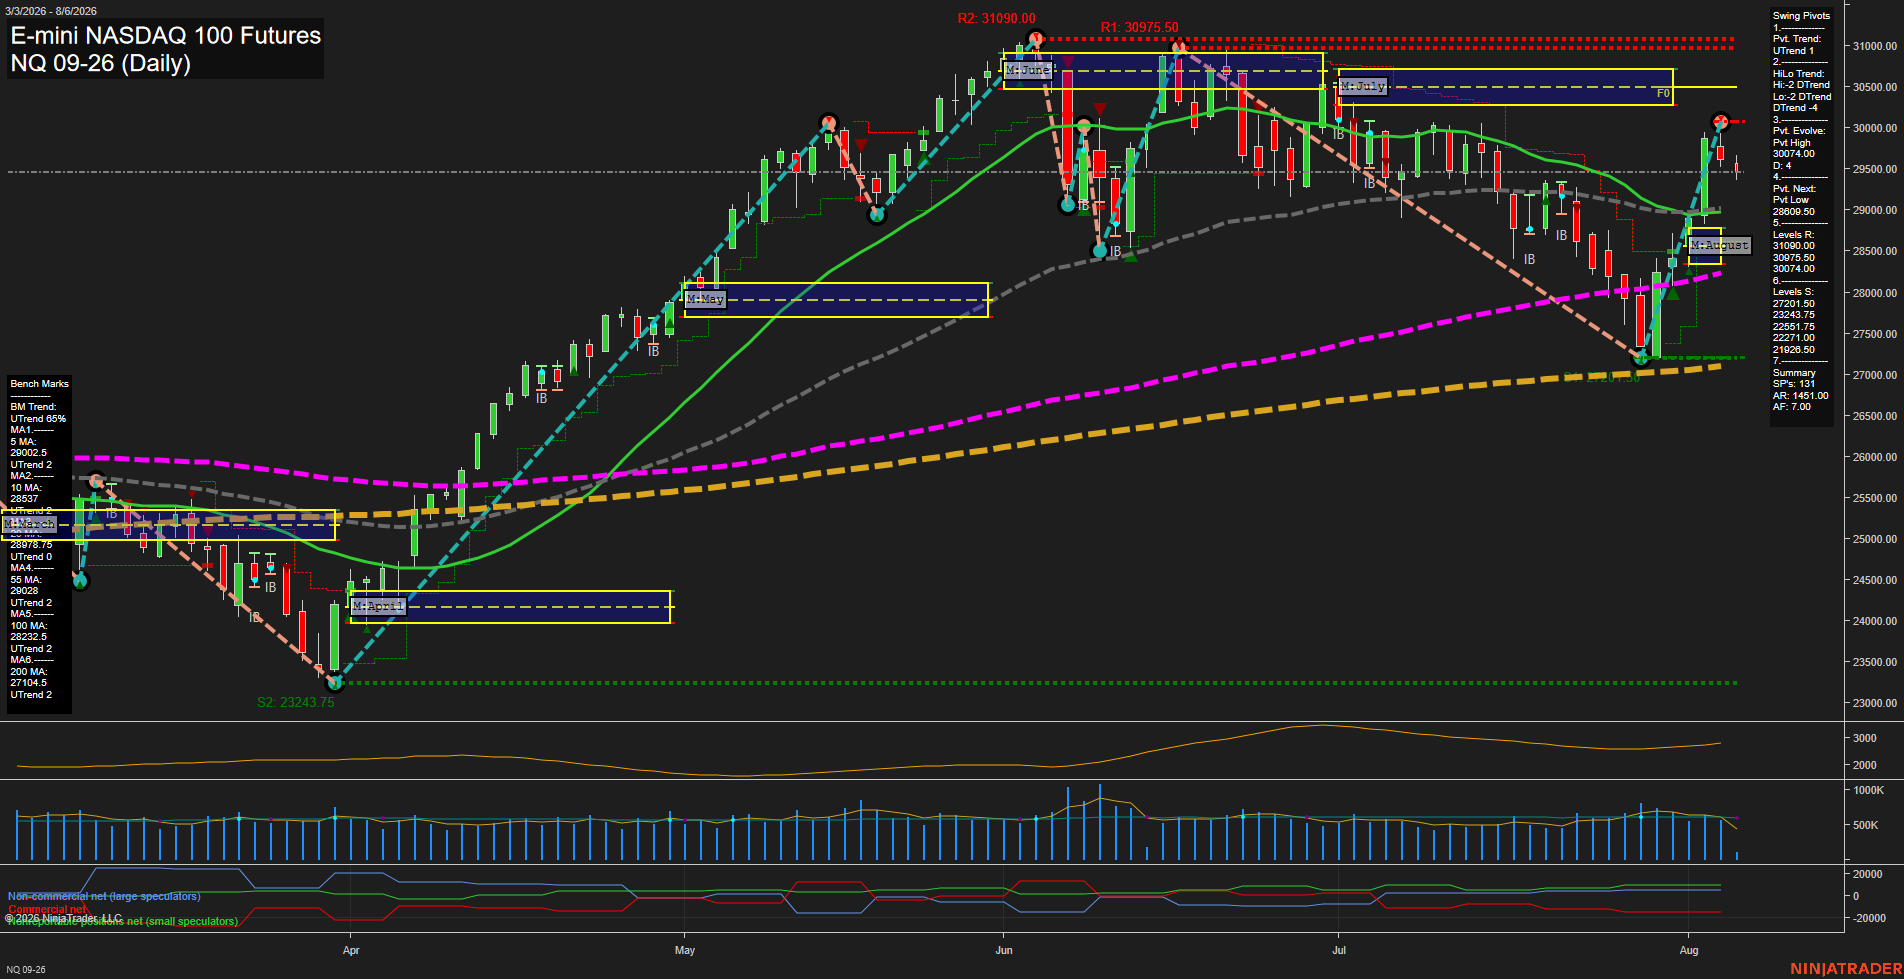
Overall Rating
- Short-Term: Bullish
- Intermediate-Term: Neutral
- Long-Term: Bullish.
Key Insights Summary
NQ completed a sharp V-style recovery from the late-July 27201.50 swing low and reclaimed the rising 5, 10, 20, and 55-day benchmarks. The short-term pivot structure is upward, although the latest medium red bar and TR120 short signal show a near-term countertrend reaction beneath the 30740 pivot-high resistance. Intermediate structure remains mixed because the HiLo pivot trend is still down despite August MSFG and price positioning above its F0% level. The broader 100-day, 200-day, and yearly grid trends remain constructive, while 30740 through 31090 defines the major overhead supply zone and 29028 to 28609.50 marks the principal nearby pivot and benchmark support area.
View charts on: AlphaWebTrader HTF Charts
CL Daily View
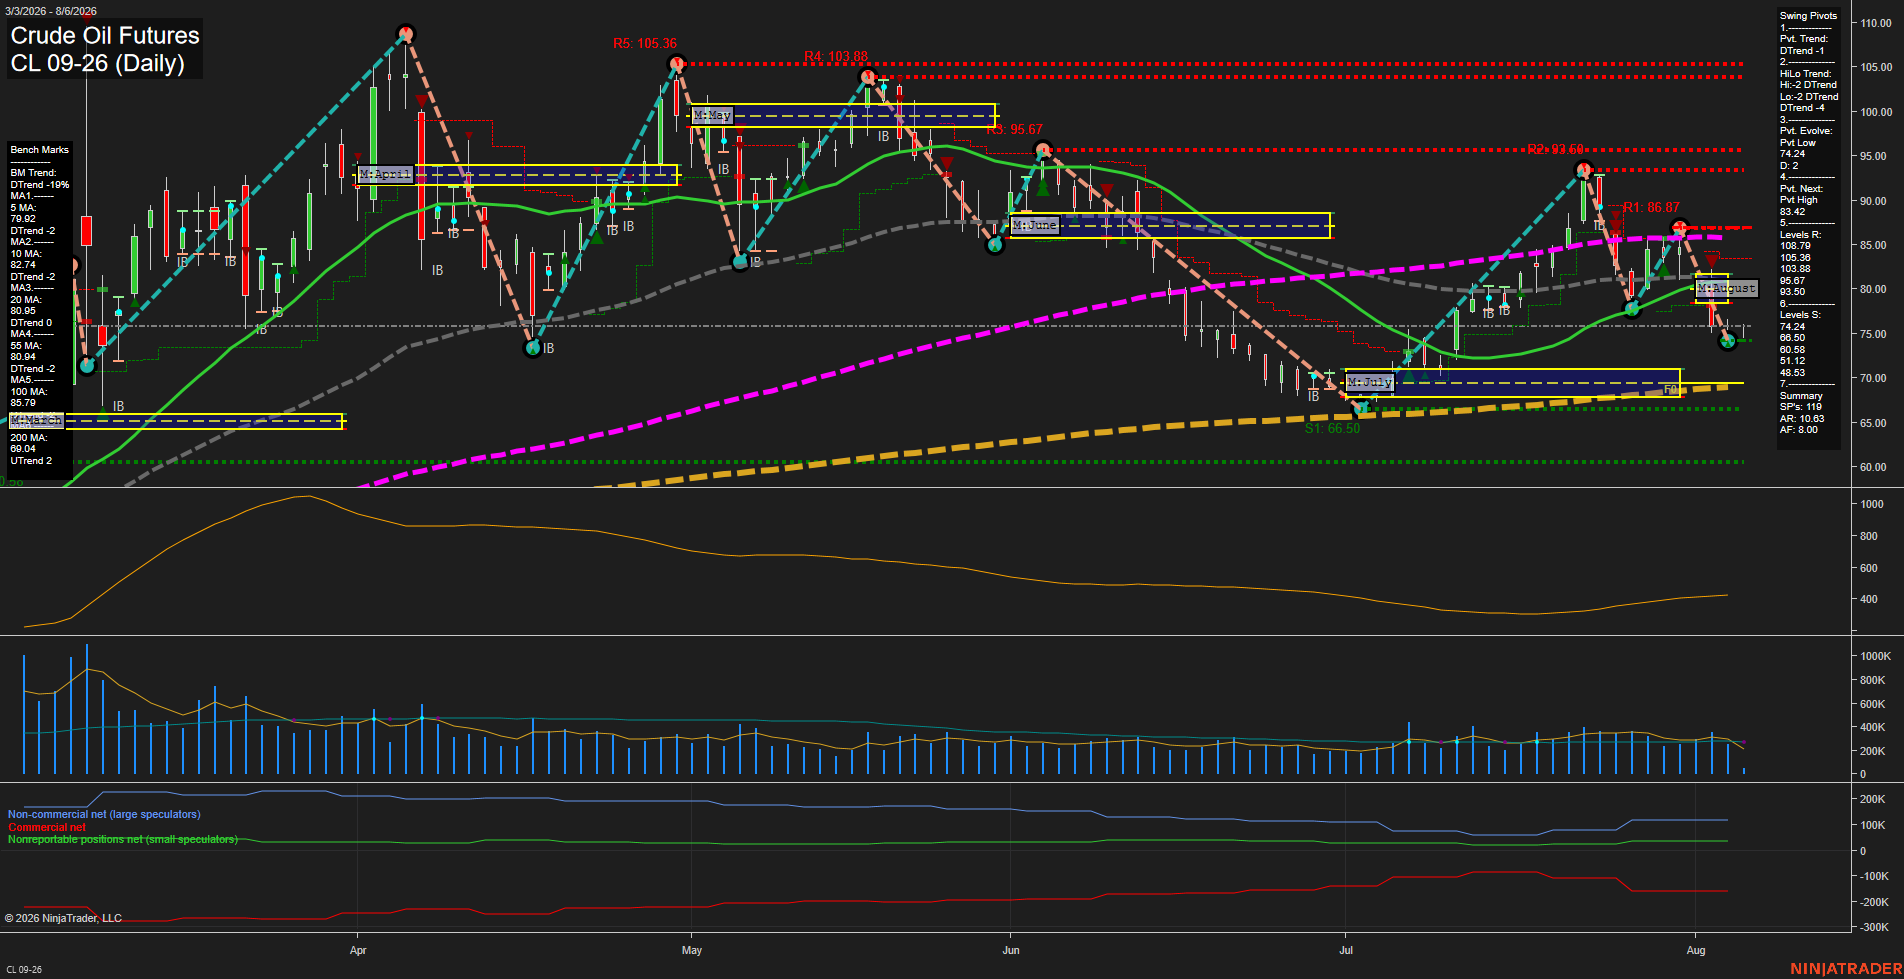
Overall Rating
- Short-Term: Bearish
- Intermediate-Term: Bearish
- Long-Term: Bullish.
Key Insights Summary
CL is in a fast bearish swing decline, with price breaking below the short- and intermediate-term benchmark cluster near 79.09 to 82.74. Both weekly and monthly fib-grid readings are below F0%, while DTrend pivot structure confirms lower highs and lower lows. The 74.24 pivot low is the immediate downside reference, with 66.50 representing the next major swing-support area. Long-term structure remains constructive because the yearly grid is positive and the 100- and 200-day benchmark trends remain upward, creating a pronounced short/intermediate-term pullback within the broader yearly advance.
View charts on: AlphaWebTrader HTF Charts
GC Daily View
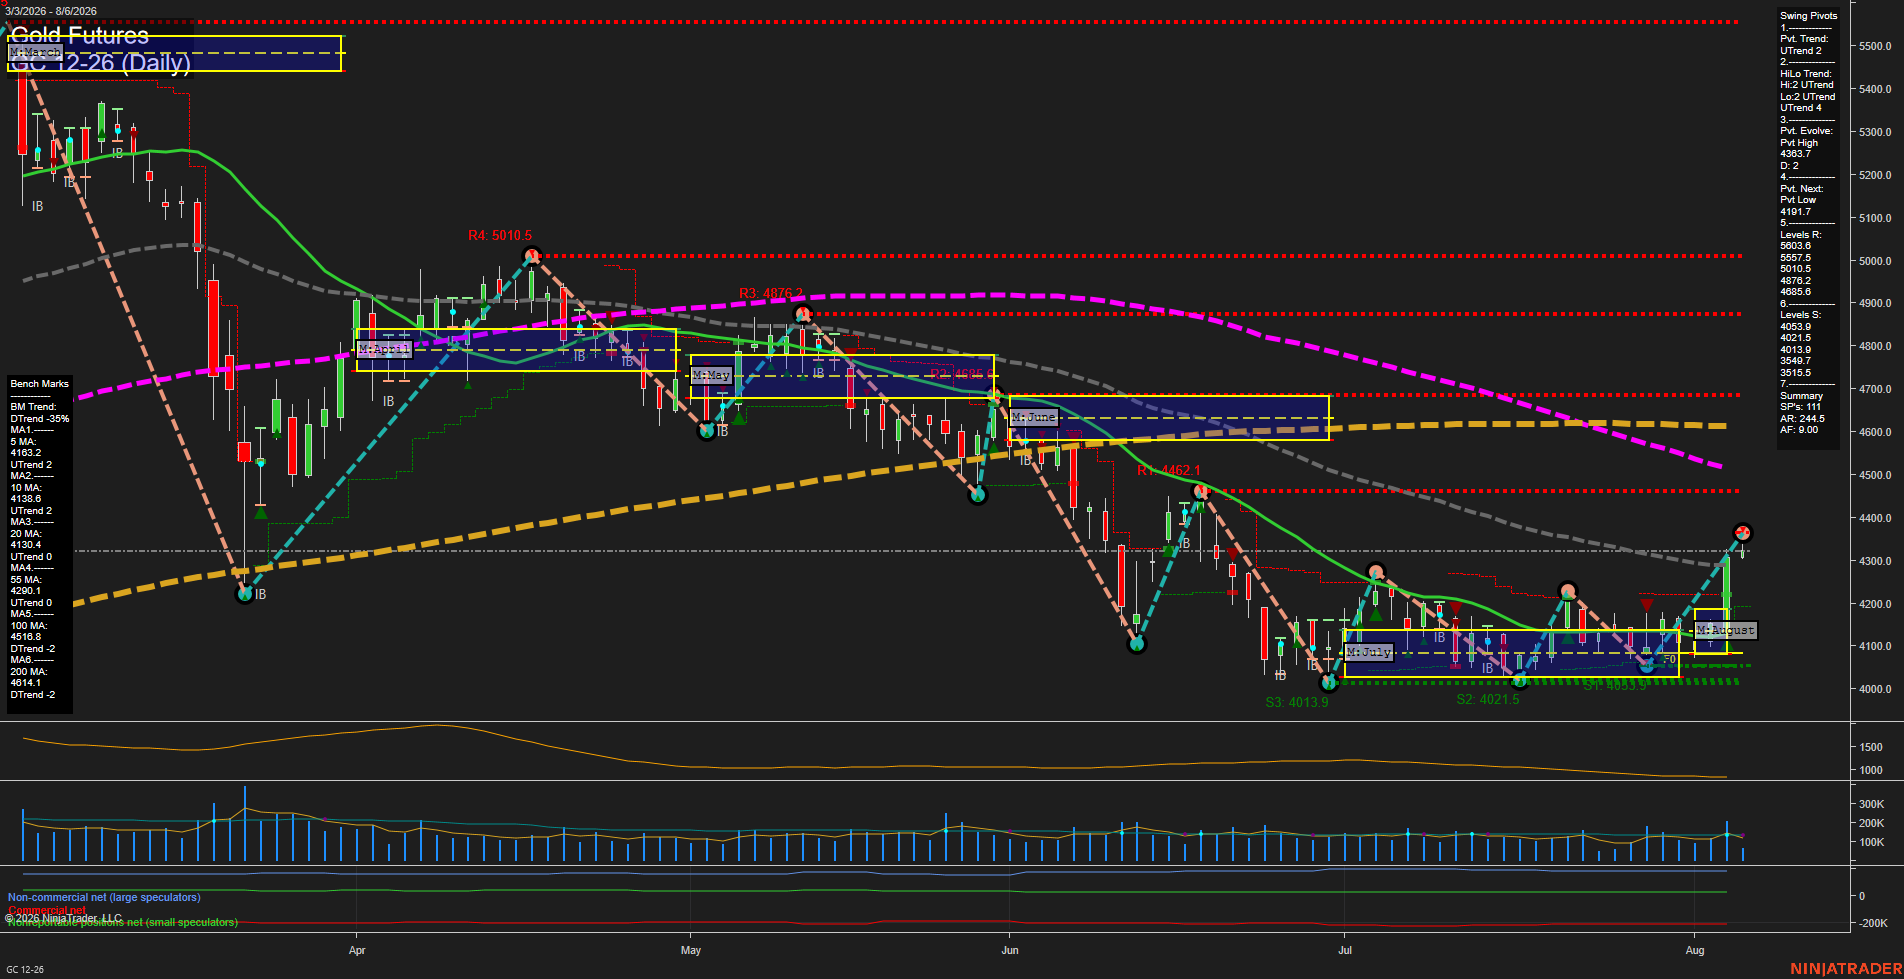
Overall Rating
- Short-Term: Bullish
- Intermediate-Term: Bullish
- Long-Term: Bearish.
Key Insights Summary
Gold produced a large upside expansion from the August NTZ and reclaimed the 55-day benchmark near 4290, confirming a sharp short-term momentum reversal. Weekly and monthly fib-grid structure, both pivot trends, and the 10-, 20-, and 55-day benchmarks align positively, while 4363.7 defines the immediate evolving swing-high area. The broader chart remains a counter-trend recovery within a bearish long-term structure because price remains below falling 100- and 200-day benchmarks. Support is concentrated near 4053.9-4013.9, while the next pivot reversal reference is 4191.7.
View charts on: AlphaWebTrader HTF Charts