U.S. stocks closed at records after weak payrolls eased rate-hike pressure, while gold rose on lower yields, a softer dollar and Hormuz risks persist.
Fundamentals: U.S. equities finished higher, with the S&P 500 and Nasdaq at fresh records, after surprise job losses reduced rate-hike pressure and pushed Treasury yields and the dollar lower. Gold climbed near $4,300 an ounce as precious metals gained, while investors also tracked unresolved Strait of Hormuz talks, Fed governance concerns and compressed volatility dispersion.
Technicals: Tesla, Nvidia and GLD led listed ETF movers higher, while USO and Google declined. E-mini S&P 500, Nasdaq, Dow, S&P MidCap, Russell 2000 and DAX futures maintained bullish intermediate- and long-term technical structures. Several markets consolidated near recent pivot highs, with short-term countertrend signals and nearby support levels defining the current pullback context.
After Market Close daily snapshot: market news summary and sentiment, major ETFs, Magnificent 7 analysis, Indices Futures Higher Time Frame Analysis, and E-mini S&P500, Nasdaq 100, NYMEX Crude, Gold Futures Daily Chart analysis.
As of: August 7, 2026 05:00 CT
Market News Summary:
U.S. equities reached fresh records after surprise job losses reduced rate-hike pressure, while gold rallied on lower yields and a weaker dollar.
Primary Drivers & Risks:
- Primary Driver: Soft jobs ease rate-hike pressure
- Primary Risk: Volatility unwind and Fed governance
Tone:
Risk-on equities with defensive demand in gold and Treasuries.
Stock Market / ETFs / Indices:
All three major U.S. indexes rose, with the S&P 500 and Nasdaq recording their best week since April and fresh records after the jobs report. ETF flows showed heavy buying of broad U.S. equity and mega-cap technology funds alongside allocations to ultra-short Treasuries, gold, and healthcare. A separate volatility analysis flagged compressed single-stock implied-volatility dispersion as a historical concern for S&P 500 weakness.
Geopolitical:
Iran-Oman negotiations concerning the Strait of Hormuz remained unresolved, keeping energy traders cautious. Geopolitical developments also featured among the factors supporting gold.
Oil / Energy:
WTI and Brent traders remained cautious as negotiations involving Iran and Oman continued, with the Hormuz situation serving as the stated focal point.
Gold / Metals:
Gold advanced to a seven-week high near $4,300 per ounce, supported by soft U.S. payrolls, lower Treasury yields, a weaker dollar, and reduced pressure for a September Fed rate increase. Gold, silver, and platinum rallied, while China’s central bank extended its gold-buying streak to 21 months and recorded its largest monthly purchase since 2023. Bullish gold call activity increased, and technical commentary cited $4,382-$4,392 as a key resistance area.
Fed / Financials:
The negative July payrolls result pushed yields lower and eased rate-hike fears. President Trump renewed efforts to remove Fed Governor Lisa Cook over mortgage-fraud allegations, introducing a Fed-governance concern despite reported limited immediate market reaction. Private-equity firms increased IPO exits amid sluggish traditional dealmaking.
Macro / Other:
Surprise U.S. job losses were the principal macro release driving the session, while manufacturing employment was described as a relative bright spot.
Conclusion:
Soft payrolls lowered Treasury yields, weakened the dollar, and eased rate-hike pressure, supporting record-setting U.S. equities and a broad precious-metals rally. Broad equity and mega-cap technology ETF inflows reinforced the positive index backdrop.
Compressed S&P 500 volatility dispersion remains a stated market-structure risk. Fed Board dismissal efforts and unresolved Hormuz negotiations add institutional and geopolitical cross-currents, while defensive flows continued into short-term Treasuries, gold, and healthcare.
Market News Sentiment
Market News Articles: 53
- Neutral: 58.49%
- Negative: 22.64%
- Positive: 18.87%
Sentiment Summary: Among 53 market news articles, sentiment was 58% neutral, 23% negative, and 19% positive.
Conclusion: News tone was predominantly neutral, with negative coverage exceeding positive coverage.
GLD,Gold Articles: 19
- Positive: 68.42%
- Neutral: 26.32%
- Negative: 5.26%
Sentiment Summary: Gold-related coverage was predominantly positive at 68%, with 26% neutral and 5% negative across 19 articles.
Conclusion: The snapshot indicates broadly favorable gold sentiment, with limited negative coverage relevant to risk and inflation-sensitive market themes.
USO,Oil Articles: 9
- Positive: 33.33%
- Neutral: 33.33%
- Negative: 33.33%
Sentiment Summary: USO and oil coverage is evenly split, with 33% positive, 33% neutral, and 33% negative articles across 9 items.
Conclusion: Oil-related news presents a balanced sentiment backdrop for indices futures day traders.
Market Data Snapshot
ETF Snapshot of major stock market ETFs, Mag7, and others as of: August 7, 2026 05:00
Top Movers & Losers
- TSLA 328.58 Bullish 2.83% ▲
- NVDA 223.96 Bullish 2.27% ▲
- GLD 398.47 Bullish 2.26% ▲
- MSFT 499.99 Bullish 0.03% ▲
- USO 117.98 Bearish -0.75% ▼
- GOOG 353.47 Bearish -0.88% ▼
Major Index ETFs: SPY, QQQ, DIA, IWM, IJH
- IJH 77.79 Bullish 1.35% ▲
- QQQ 723.03 Bullish 1.17% ▲
- IWM 301.56 Bullish 1.11% ▲
- SPY 773.26 Bullish 0.61% ▲
- DIA 539.62 Bullish 0.27% ▲
Major Index ETFs were Bullish across the group: IJH led with +1.35%, followed by QQQ at +1.17% and IWM at +1.11%. SPY gained +0.61%, while DIA was the least positive mover at +0.27%.
Mag 7 Stocks: AAPL, MSFT, GOOG, AMZN, META, NVDA, TSLA
- TSLA 328.58 Bullish 2.83% ▲
- NVDA 223.96 Bullish 2.27% ▲
- AMZN 274.48 Bullish 0.82% ▲
- META 592.10 Bullish 0.37% ▲
- AAPL 313.33 Bullish 0.29% ▲
- MSFT 499.99 Bullish 0.03% ▲
- GOOG 353.47 Bearish -0.88% ▼
Mixed Mag7 snapshot: TSLA is the most bullish mover at +2.83%, followed by NVDA at +2.27%. AMZN gained +0.82%, while META and AAPL were modestly Bullish at +0.37% and +0.29%. MSFT was marginally Bullish at +0.03%. GOOG is the most bearish mover, down -0.88%.
Cross-Market ETFs: TLT, GLD, USO, IBIT
- GLD 398.47 Bullish 2.26% ▲
- IBIT 36.80 Bullish 0.85% ▲
- TLT 82.76 Bullish 0.29% ▲
- USO 117.98 Bearish -0.75% ▼
Mixed cross-market snapshot: GLD is the most bullish mover at +2.26%, while IBIT gains +0.85% and TLT is marginally bullish at +0.29%. USO is the most bearish mover at -0.75%.
ETF, Mag7, and Cross-Market ETF Insights
Overall Tone
Mixed tone: equity ETFs were broadly Bullish, while GLD strength and USO weakness showed cross-market divergence.
Equity ETFs and Mag7:
Major Index ETFs were broadly Bullish, led by IJH at +1.35%, followed by QQQ at +1.17% and IWM at +1.11%; SPY gained +0.61% and DIA added +0.27%. Mag7 performance was selective: TSLA was the most bullish mover at +2.83%, NVDA rose +2.27%, while GOOG was the most bearish mover at -0.88%; MSFT was marginal at +0.03%. Equity leadership favored growth, smaller-cap, and mid-cap participation, although GOOG divergence kept Mag7 breadth selective.
Cross-Market ETFs:
Cross-market ETFs were Mixed, with GLD the most bullish mover at +2.26%, ahead of IBIT at +0.85% and TLT at +0.29%. USO was the most bearish mover at -0.75%, contrasting with equity ETF gains and strength in gold and bitcoin exposure. GLD’s advance exceeded the gains in major equity ETFs, while USO was the only Bearish cross-market instrument.
Futures Indices – Higher Time Frame Analysis
Summary of the current state of US Indices Futures based on higher time-frame (HTF) technical analysis as of: 2026-08-07: 17:00 CT.
US Indices Futures
- ES: Bullish YSFG/MSFG/WSFG, above rising benchmarks, higher-high pivots; 7850.25 resistance, 7734.00 support, TR120 short countertrend signal.
- NQ: Bullish YSFG/MSFG/WSFG, above major rising benchmarks; 30074-30190 resistance, 28609.50 pivot support, 10-day benchmark declining.
- YM: Bullish YSFG/MSFG/WSFG and rising benchmarks, UTrend pivots; 54884 resistance, 53402 pivot support, short-term pullback from highs.
- EMD: Bullish YSFG/MSFG/WSFG, above rising benchmarks and UTrend pivots; 3900.6-3906.8 resistance, 3798.8 pivot support, TR120 short signal.
- RTY: Neutral weekly short-term, bullish intermediate/long-term; upward grids and benchmarks, 3068.4 resistance, 2902.3 pivot support, declining 5/10-period benchmarks.
- FDAX: Bullish YSFG/MSFG/WSFG, above all benchmarks with UTrend pivots; 26524-26854 resistance, 25834 support, TR120 short countertrend signal.
Overall State
- Short-Term: Bullish
- Intermediate-Term: Bullish
- Long-Term: Bullish
Conclusion
US index futures retain broad HTF bullish alignment: YSFG, MSFG, and WSFG structures are upward, prices remain above most rising benchmark averages, and swing structures generally hold higher highs and higher lows. ES, NQ, YM, EMD, and FDAX are consolidating or retracing beneath recent pivot highs; RTY has the softer weekly short-term correlation, with declining 5- and 10-period benchmarks. Recent TR120 short signals in ES, EMD, RTY, and FDAX identify countertrend conditions near resistance, while intermediate- and long-term pivot, benchmark, and Fib-grid correlations remain upward.
Note: Intra-day counter-trend pullbacks or retracements may occur, HTF is context for informational usage and market structure. Glossary: Session Fib Grids periods of YSFG:’Yearly’, MSFG:’Monthly’, WSFG:’Weekly’
For full details visit: AlphaWebTrader Technicals
ES Daily View
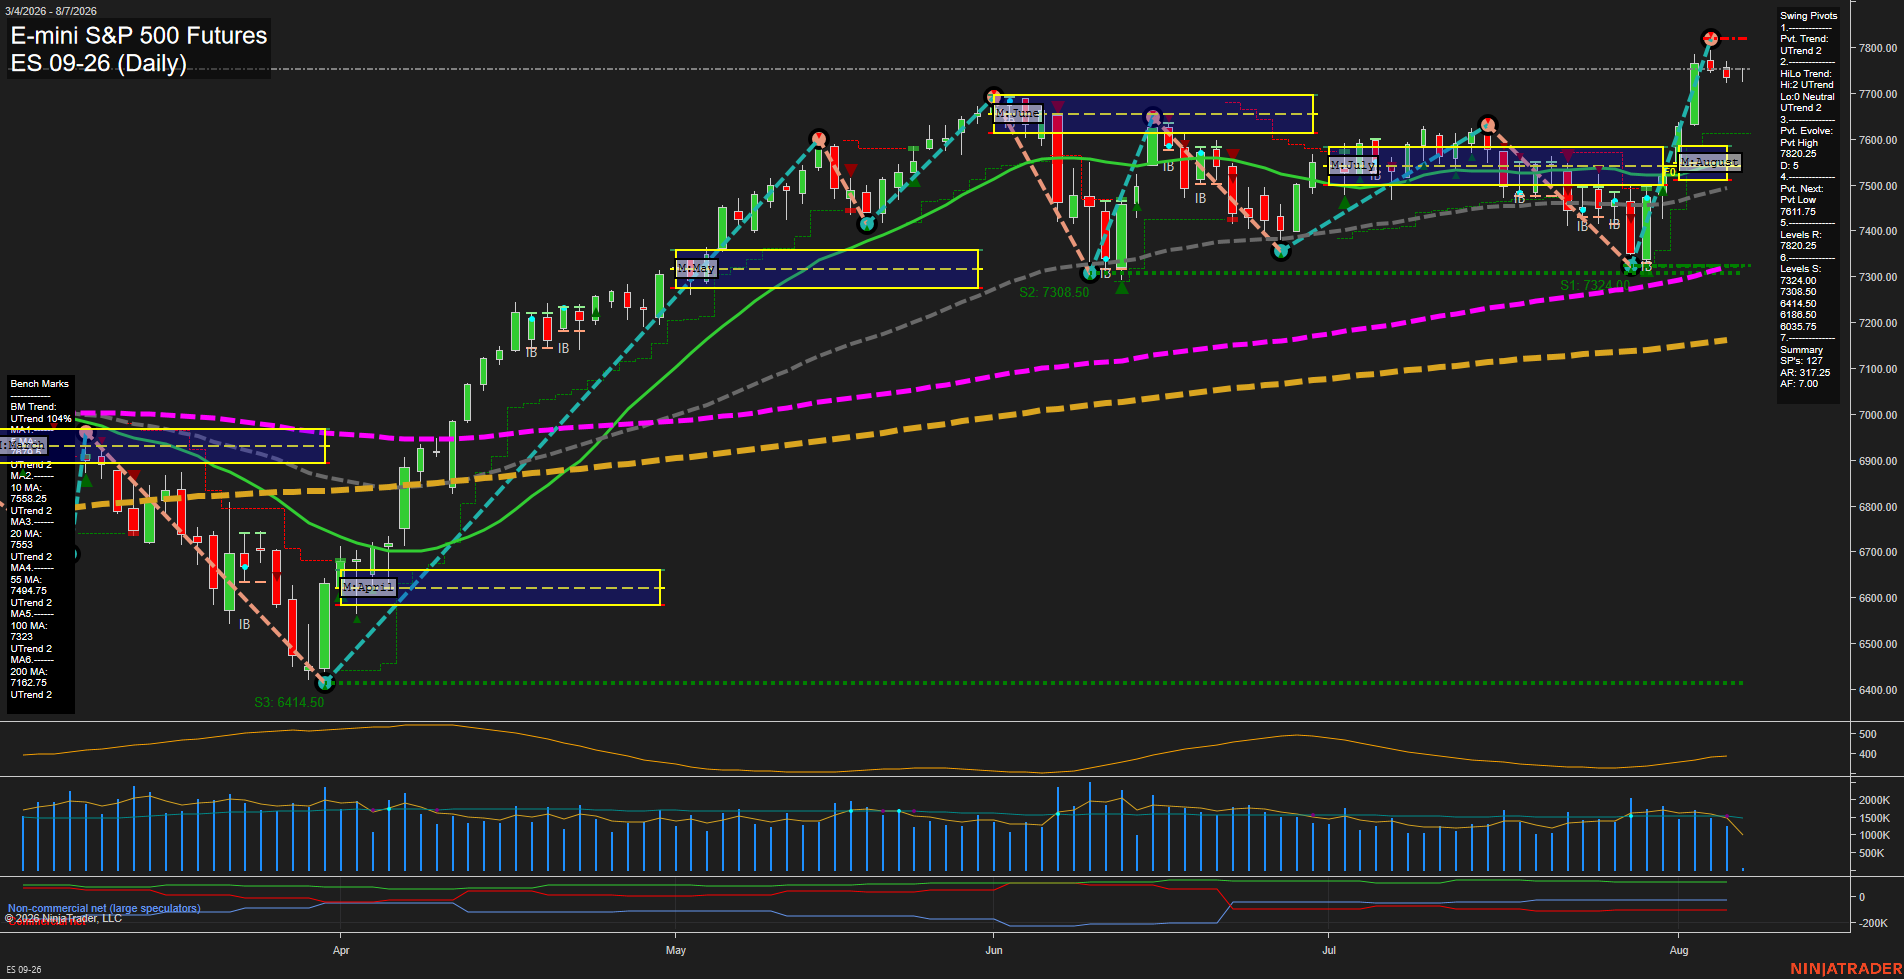
Overall Rating
- Short-Term: Bullish
- Intermediate-Term: Bullish
- Long-Term: Bullish.
Key Insights Summary
Price remains in a broad daily uptrend, holding above every benchmark average while both the short-term pivot trend and intermediate HiLo trend remain UTrend. The recent advance accelerated sharply from the 7308.50 support region into the 7810.25 pivot high, followed by a modest pullback and consolidation beneath that high. The 7734.00 pivot support is immediately nearby, while 7617.75 marks the next pivot-reversal threshold and the upper 7600s remain an important retracement area. Weekly, monthly, and yearly Fib-grid structure remains positive, although the short-term TR120 signal reflects countertrend pressure after the fast rally. Elevated ATR and active volume characterize a volatile expansion phase rather than a low-range consolidation.
View charts on: AlphaWebTrader HTF Charts
NQ Daily View
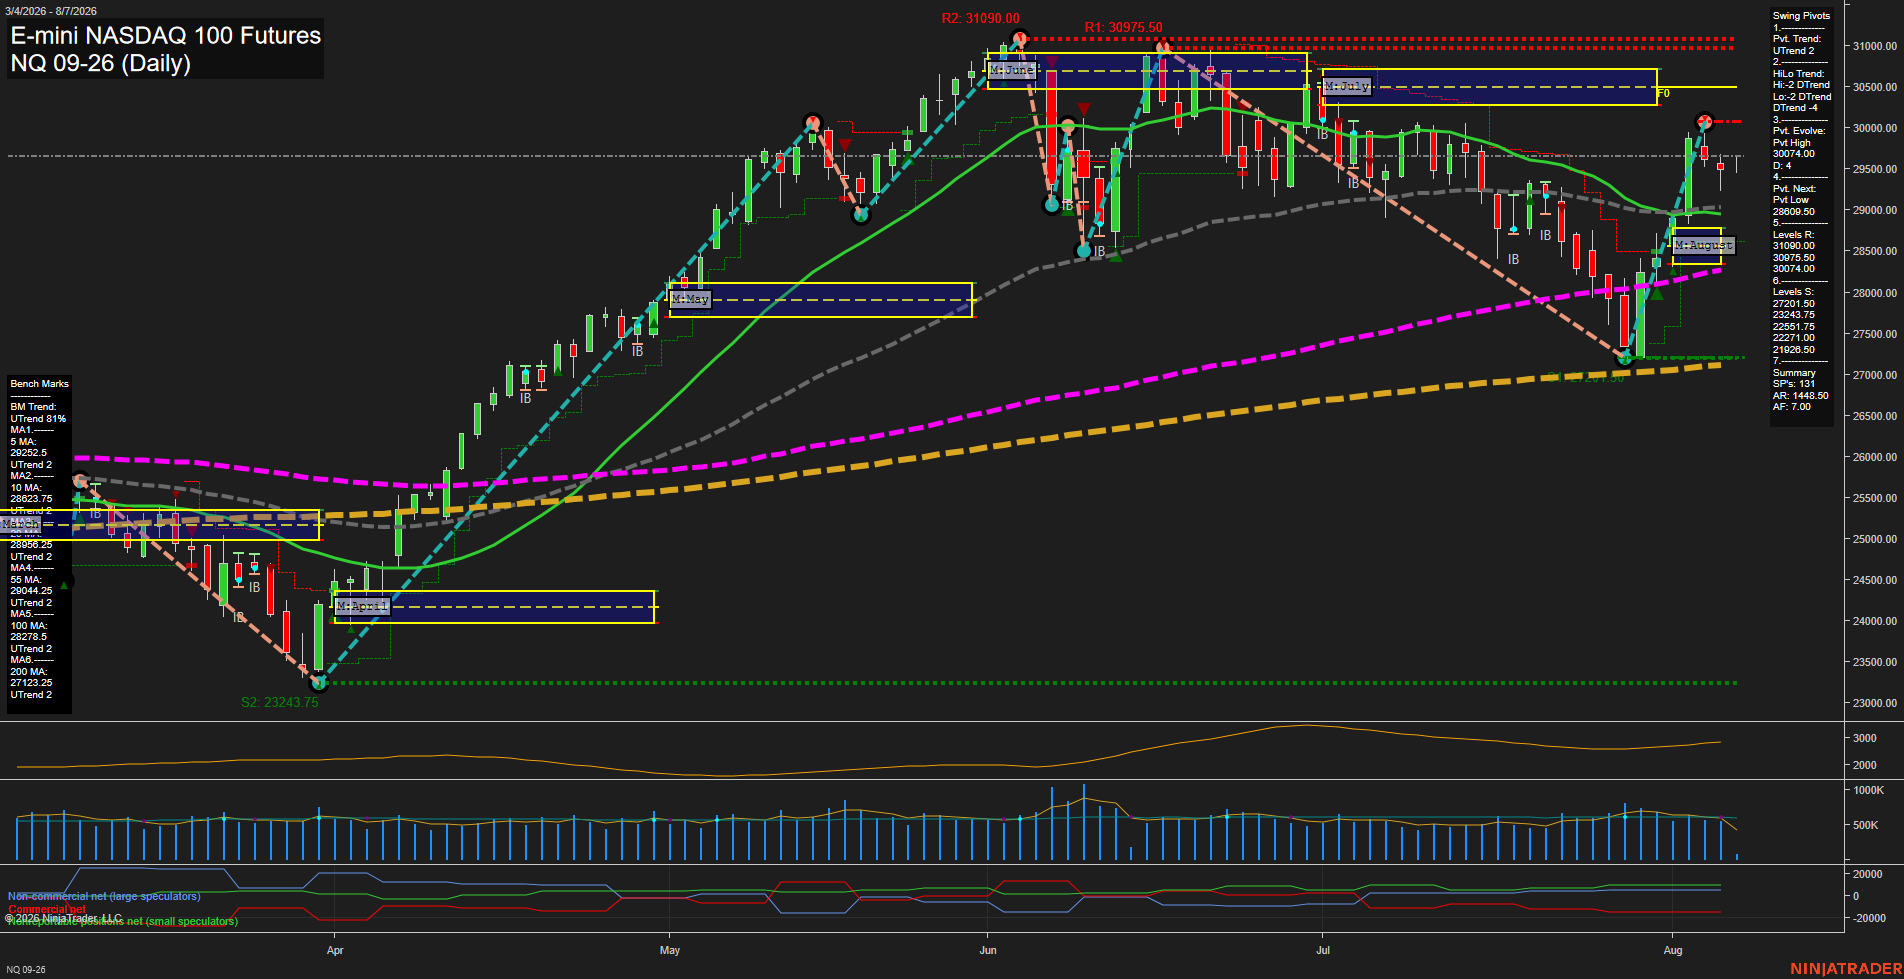
Overall Rating
- Short-Term: Bullish
- Intermediate-Term: Bullish
- Long-Term: Bullish.
Key Insights Summary
NQ has produced a fast V-shaped recovery from the late-July low near 27200 and remains above the rising 5-, 20-, 55-, 100-, and 200-day benchmarks. The short-term pivot trend and weekly grid remain upward, while the August monthly grid also holds an upward bias. The market is consolidating beneath the newly established 30074 pivot-high resistance after a high-velocity rebound, with smaller recent bars indicating a pause in momentum rather than a broad trend reversal. The intermediate HiLo pivot structure remains DTrend, reflecting the prior July decline and leaving 30074 as the key overhead swing reference; 28609.50 defines the opposite short-term pivot threshold. Long-term structure remains firmly constructive with price substantially above the 200-day benchmark and the yearly grid positioned in the upper range.
View charts on: AlphaWebTrader HTF Charts
CL Daily View
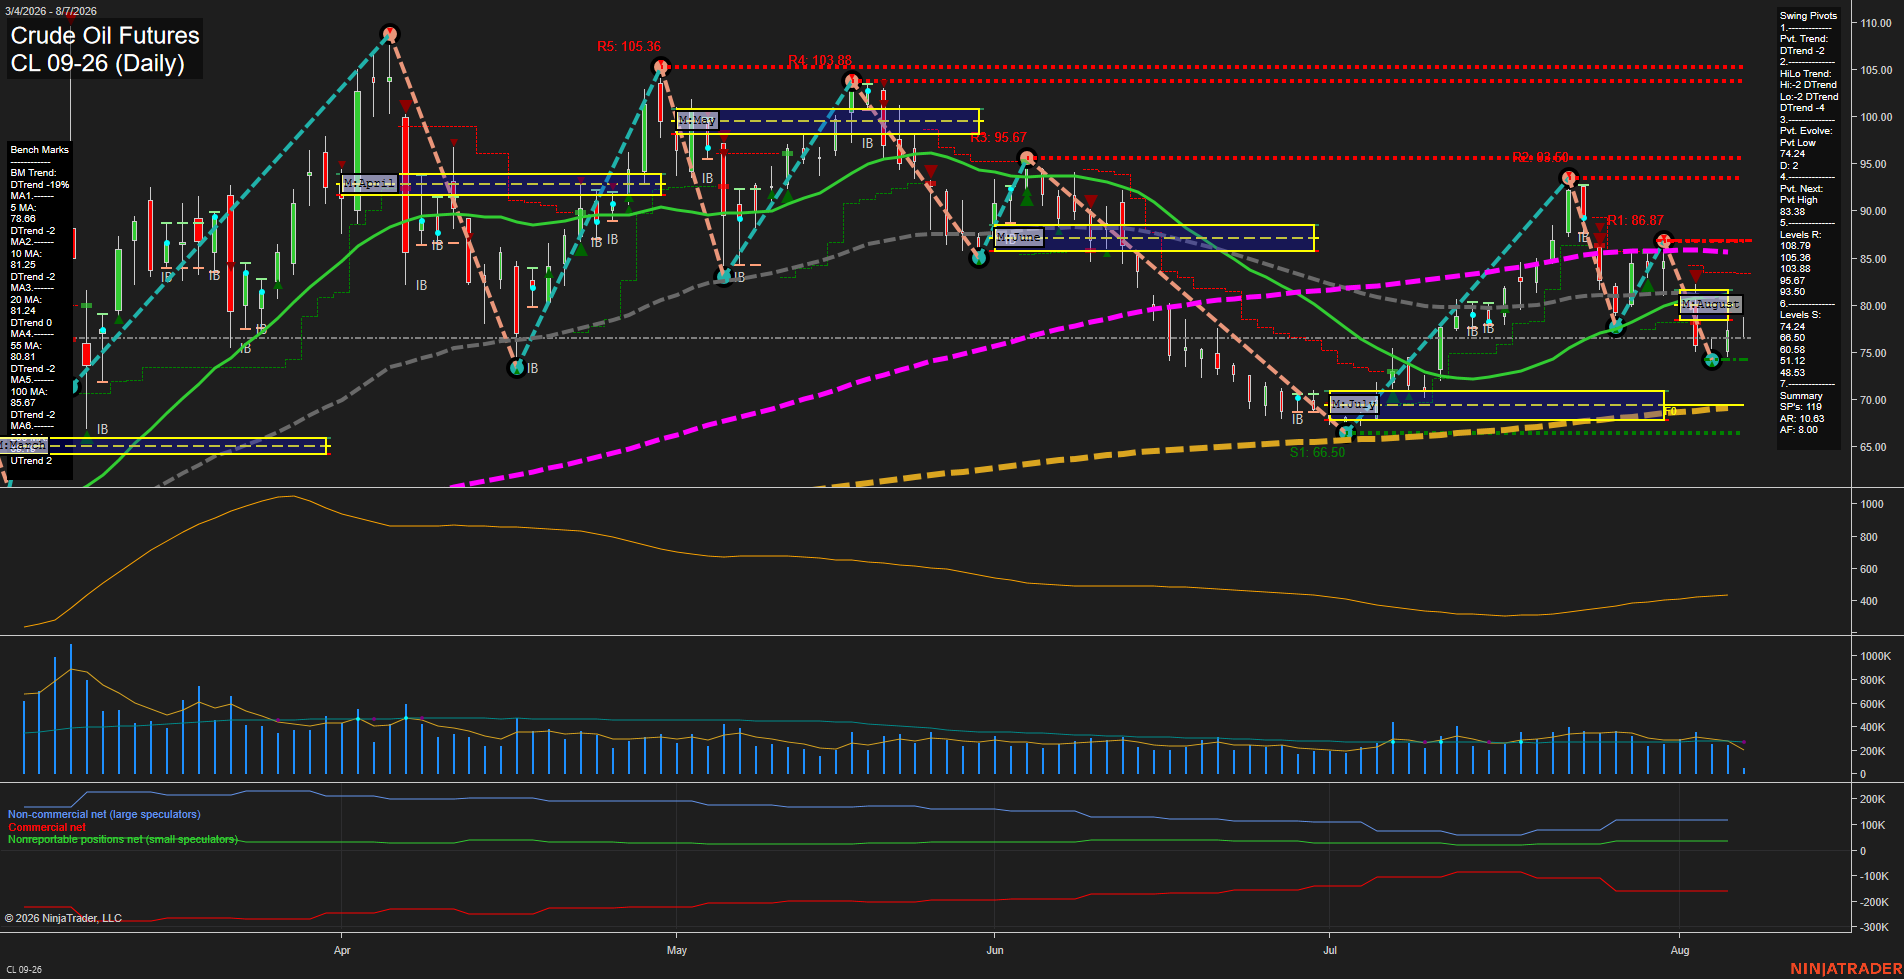
Overall Rating
- Short-Term: Bearish
- Intermediate-Term: Bearish
- Long-Term: Bullish.
Key Insights Summary
CL has shifted into a fast downside swing, with a large bearish bar extending the decline from the 86.87 pivot high and breaking below the August monthly grid. Price is beneath every short- and intermediate-term benchmark, while both pivot structures remain in DTrend alignment. The 74.24 pivot-low area is the immediate structural support; below it, the chart opens toward the 66.50 support zone near the rising 200-day benchmark. Long-term structure remains constructive because price is above the 200-day average and the yearly fib grid remains positive, but the current daily swing is a sharp countertrend selloff within that broader backdrop.
View charts on: AlphaWebTrader HTF Charts
GC Daily View
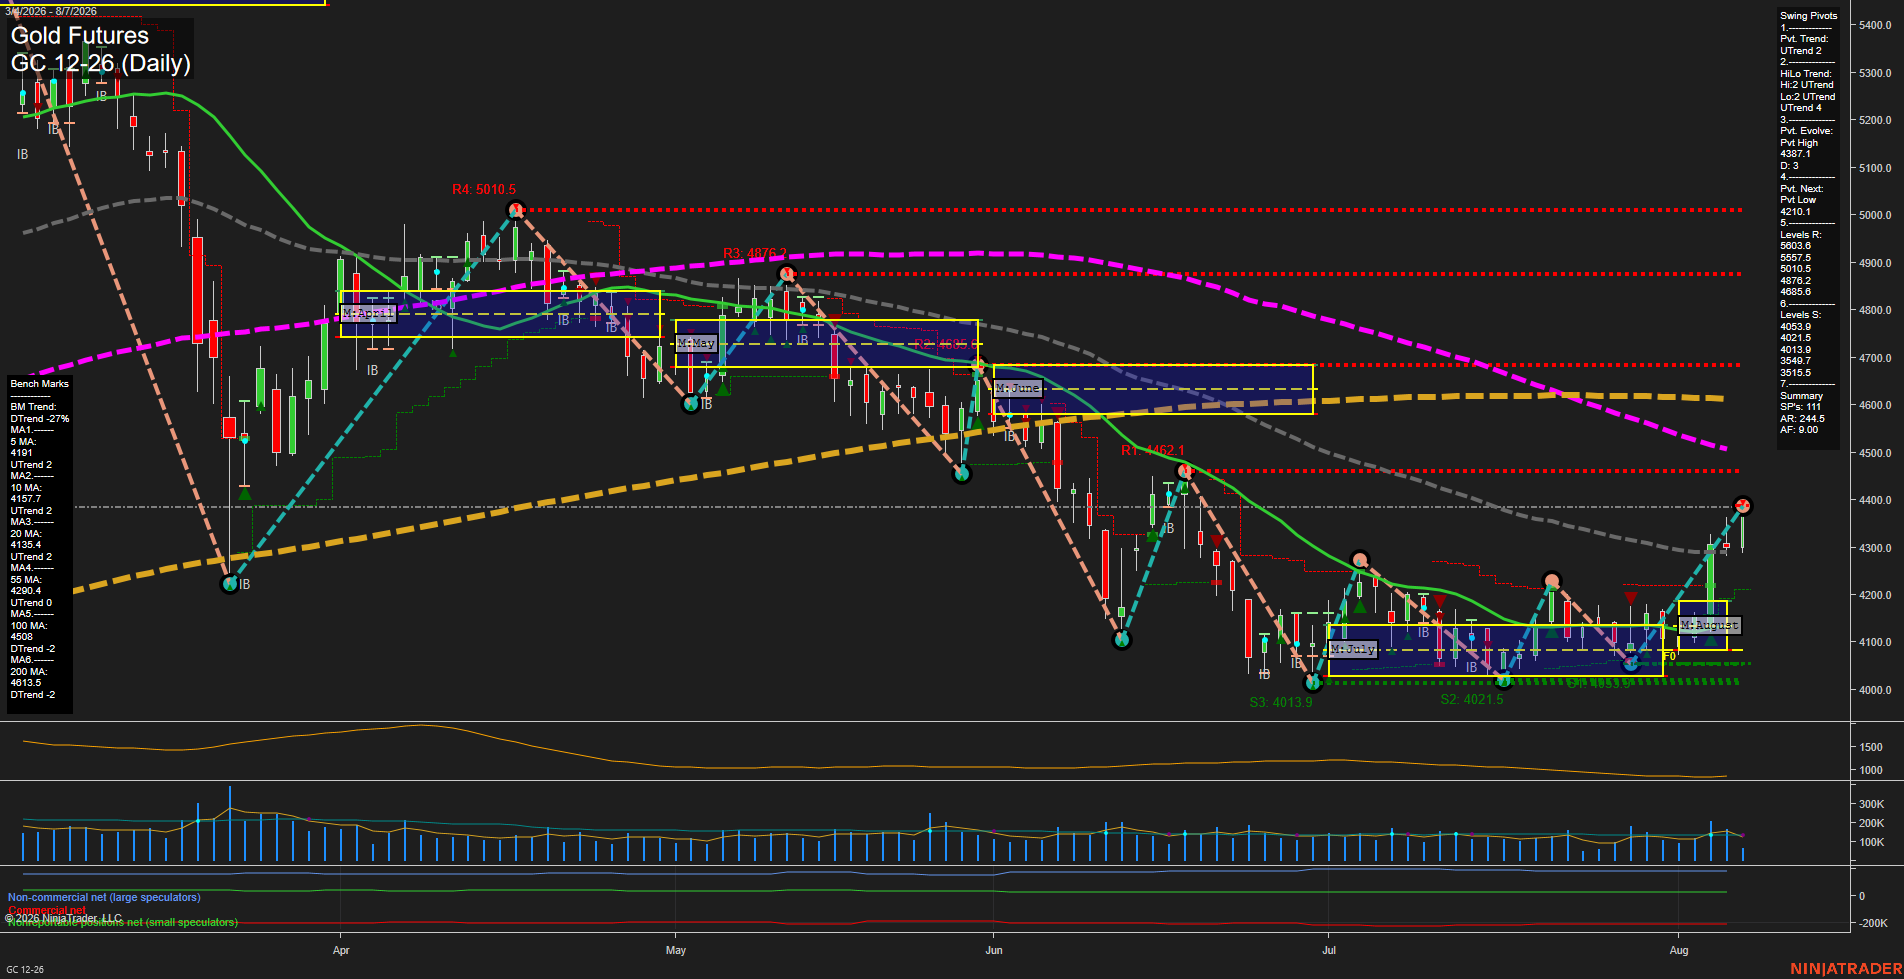
Overall Rating
- Short-Term: Bullish
- Intermediate-Term: Bullish
- Long-Term: Bearish.
Key Insights Summary
Gold has produced a sharp V-recovery from the July/August 4014-4054 support base, with large-range upside bars lifting price above the 5, 10, 20, and 55-day benchmarks. Short-term and intermediate pivot structures are UTrend, while weekly and monthly Fib-grid readings remain above their F0%/NTZ areas. The rally is approaching the 4378 pivot-high area, with 4685.6 the next material swing resistance. Long-term structure remains countertrend because price is below declining 100-day and 200-day benchmarks at 4508 and 4613, respectively.
View charts on: AlphaWebTrader HTF Charts