NYSE pre-market radar tracks ETF movers, firm index futures, technology strength, elevated oil and gold as markets await the U.S. payrolls report.
Fundamentals: U.S. index futures traded mixed-to-firm ahead of the closely watched payrolls report, with Nasdaq 100 contracts supported by technology shares. Oil remained elevated as reduced Strait of Hormuz vessel traffic and proposed Iranian transit restrictions raised supply concerns. Gold held above $4,250 as markets assessed employment data and its implications for Federal Reserve policy.
Technicals: Pre-market focus centers on gains in USO, Microsoft and Apple, while Bitcoin and major index ETFs closed lower in the prior session. Futures market structures remain broadly bullish across ES, NQ, YM, EMD and FDAX, with RTY showing a neutral short-term weekly tone. Most contracts are consolidating or pulling back beneath recent pivot highs after strong advances.
Pre-Market Trading 360° view Market Radar of: holidays, earnings, eco-news, market-news summary, news sentiment, prior session major ETFs, MAG7, Higher Time Frame Analysis Indices Futures Summary, and E-mini S&P500, Nasdaq 100, NYMEX Crude, Gold Futures Daily Chart analysis.
As of: August 7, 2026 07:16 CT
Earnings Radar
Monitoring for earnings releases by the Magnificent 7, AI-tech-related firms, and major financial institutions.
- SMCI Release: 2026-08-11 T:AMC
Conclusion: Super Micro Computer (SMCI) reports after the close on August 11, placing an AI-server and semiconductor-infrastructure earnings event after the session. Index-futures activity can reflect positioning and volume conditions into and following the release, particularly across AI and related technology exposure.
For full details visit: Yahoo Earnings Calendar
EcoNews Radar U.S. Events
| Day | Time | Impact | Event |
|---|---|---|---|
| Fri | 08:30 | High | Average Hourly Earnings m/m |
| Fri | 08:30 | High | Non-Farm Employment Change |
| Fri | 08:30 | High | Unemployment Rate |
EcoNews Summary
Friday’s 08:30 USD labor-market releases form the week’s listed high-impact event cluster. The data cover wage growth, employment growth, and the unemployment rate, providing a broad snapshot of labor conditions and inflation-related wage pressure. Equity-index futures often see elevated volatility at the release time as markets reprice growth, inflation, and monetary-policy assumptions.
Event Notes:
- Friday 08:30 — USD Average Hourly Earnings m/m: Measures the monthly change in average employee pay. Traders monitor wage growth as an indicator of labor-cost pressure and its relationship to inflation.
- Friday 08:30 — USD Non-Farm Employment Change: Measures the change in employment outside the farm sector. It is monitored as a broad indicator of labor-market strength and economic activity.
- Friday 08:30 — USD Unemployment Rate: Measures the percentage of the labor force actively seeking work but not employed. Traders monitor it for evidence of labor-market tightness or slack.
Conclusion:
The single most important listed event is Friday at 08:30, the USD Non-Farm Employment Change release, occurring alongside Average Hourly Earnings and the Unemployment Rate. This synchronized labor-data release provides a concentrated update on job growth, wage trends, and labor-market conditions, supporting heightened index-futures price discovery at release time.
For full details visit: Forex Factory EcoNews
Market News Summary:
Index futures were mixed-to-firm ahead of U.S. payrolls, while Strait of Hormuz disruptions lifted oil and sustained geopolitical risk.
Primary Drivers & Risks:
- Primary Driver: Technology strength ahead of payrolls
- Primary Risk: Hormuz shipping disruption and oil surge
Tone:
Cautiously constructive, with elevated event and geopolitical sensitivity.
Stock Market / ETFs / Indices:
Before the open, S&P 500 futures gained about 0.2%, Dow futures were little changed, and Nasdaq 100 futures rose 0.5% as technology strength supported contracts. Record S&P 500 call-option volume reflected heavy bullish positioning, while health care rebounded 1.34% after a five-session decline.
Geopolitical:
Iran’s draft restrictions for the Strait of Hormuz included barring U.S. and Israeli ships, while reports cited attacks on “hostile targets.” Iran-Oman talks remained in focus, but vessel traffic fell to 33 ships from 50 a week earlier.
Oil / Energy:
Oil extended gains as reduced Hormuz traffic, proposed transit restrictions, and higher Gulf shipping costs renewed supply-disruption concerns. A record-cost charter for Iraqi crude underscored tight tanker availability, while WTI and Brent were attempting to extend their recovery.
Gold / Metals:
Gold held above $4,250 and silver remained near multiyear highs ahead of payrolls. Key cited technical levels included $4,300 for gold and $64 for silver, with employment data framed as a Fed-policy catalyst.
Fed / Financials:
Friday’s U.S. jobs report was the central macro event, with markets focused on its implications for a September Federal Reserve decision. Lower oil prices in one report were cited as reducing September hike odds.
Macro / Other:
Higher diesel costs and supply shortages disrupted palm-oil harvesting in Borneo and Sumatra, adding another commodity supply constraint. South Korean retail investors increased U.S. equity purchases as a KOSPI decline undermined domestic-market sentiment.
Conclusion:
Technology-led futures strength and the U.S. payrolls release are the immediate equity-index drivers. Oil remains supported by Strait of Hormuz access concerns and constrained shipping activity.
Payrolls-driven Fed repricing remains a key cross-current for futures, gold, and the dollar-sensitive risk backdrop. Elevated bullish S&P 500 option activity increases attention on positioning as geopolitical headlines continue.
Market News Sentiment
Market News Articles: 53
- Neutral: 58.49%
- Positive: 22.64%
- Negative: 18.87%
Sentiment Summary: Market news sentiment is predominantly neutral (58%), with positive coverage (23%) exceeding negative coverage (19%).
Conclusion: The news flow presents a largely balanced tone for indices futures day traders, with a modest positive skew.
GLD,Gold Articles: 19
- Positive: 47.37%
- Neutral: 42.11%
- Negative: 10.53%
Sentiment Summary: Gold-related coverage was 47% positive, 42% neutral, and 11% negative across 19 articles.
Conclusion: The tone was moderately positive toward gold, with substantial neutral coverage and limited negative sentiment.
USO,Oil Articles: 10
- Positive: 40.00%
- Neutral: 40.00%
- Negative: 20.00%
Sentiment Summary: USO/Oil coverage is balanced to mildly positive, with 40% positive, 40% neutral, and 20% negative articles.
Conclusion: Oil-related news presents a largely neutral sentiment backdrop for indices futures day traders, with positive coverage exceeding negative coverage.
Market Data Snapshot
ETF Snapshot of major stock market ETFs, Mag7, and others as of: August 7, 2026 07:16
Top Movers & Losers
- USO 118.87 Bullish 3.47% ▲
- MSFT 499.86 Bullish 2.54% ▲
- AAPL 312.41 Bullish 0.45% ▲
- IBIT 36.49 Bearish -0.68% ▼
- DIA 538.19 Bearish -0.85% ▼
- GOOG 356.62 Bearish -0.97% ▼
Major Index ETFs: SPY, QQQ, DIA, IWM, IJH
- SPY 768.56 Bearish -0.16% ▼
- IJH 76.75 Bearish -0.32% ▼
- QQQ 714.65 Bearish -0.37% ▼
- IWM 298.25 Bearish -0.51% ▼
- DIA 538.19 Bearish -0.85% ▼
Major Index ETFs were Bearish across the board. DIA led losses at -0.85%, followed by IWM at -0.51%, QQQ at -0.37%, and IJH at -0.32%. SPY was the least negative mover at -0.16%.
Mag 7 Stocks: AAPL, MSFT, GOOG, AMZN, META, NVDA, TSLA
- MSFT 499.86 Bullish 2.54% ▲
- AAPL 312.41 Bullish 0.45% ▲
- META 589.90 Bullish 0.19% ▲
- NVDA 218.99 Bearish -0.10% ▼
- AMZN 272.26 Bearish -0.14% ▼
- TSLA 319.53 Bearish -0.63% ▼
- GOOG 356.62 Bearish -0.97% ▼
Mixed: MSFT is the most bullish mover at +2.54%, with AAPL +0.45% and META +0.19% also Bullish. GOOG is the most bearish mover at -0.97%, followed by TSLA at -0.63%; NVDA is marginally Bearish at -0.10%.
Cross-Market ETFs: TLT, GLD, USO, IBIT
- USO 118.87 Bullish 3.47% ▲
- GLD 389.67 Bullish 0.01% ▲
- TLT 82.52 Bearish -0.58% ▼
- IBIT 36.49 Bearish -0.68% ▼
Other ETFs are Mixed: USO is the most bullish mover at +3.47%, while IBIT is the most bearish mover at -0.68%. GLD is marginally Bullish at +0.01%, and TLT is Bearish at -0.58%.
ETF, Mag7, and Cross-Market ETF Insights
Overall Tone
Mixed: broad equity ETFs were Bearish while selective Mag7 strength and a sharp USO gain provided Bullish pockets.
Equity ETFs and Mag7:
Major Index ETFs were broadly Bearish, led lower by DIA at -0.85%, while SPY at -0.16% was the least negative mover; QQQ -0.37%, IWM -0.51%, and IJH -0.32% also declined. Mag7 performance was selective: MSFT led with +2.54%, followed by AAPL at +0.45% and META at +0.19%, while GOOG was the most bearish mover at -0.97%. TSLA fell -0.63%, AMZN -0.14%, and NVDA was marginally Bearish at -0.10%, showing selective rather than broad equity alignment.
Cross-Market ETFs:
Cross-market ETFs were Mixed, with USO the most bullish mover at +3.47%, diverging sharply from the Bearish equity ETF complex. GLD was near-flat and marginally Bullish at +0.01%, while TLT declined -0.58% and IBIT was the most bearish cross-market mover at -0.68%. Commodity strength contrasted with weakness in bonds and bitcoin exposure.
Futures Indices – Higher Time Frame Analysis
Summary of the current state of US Indices Futures based on higher time-frame (HTF) technical analysis as of: 2026-08-07: 07:16 CT.
US Indices Futures
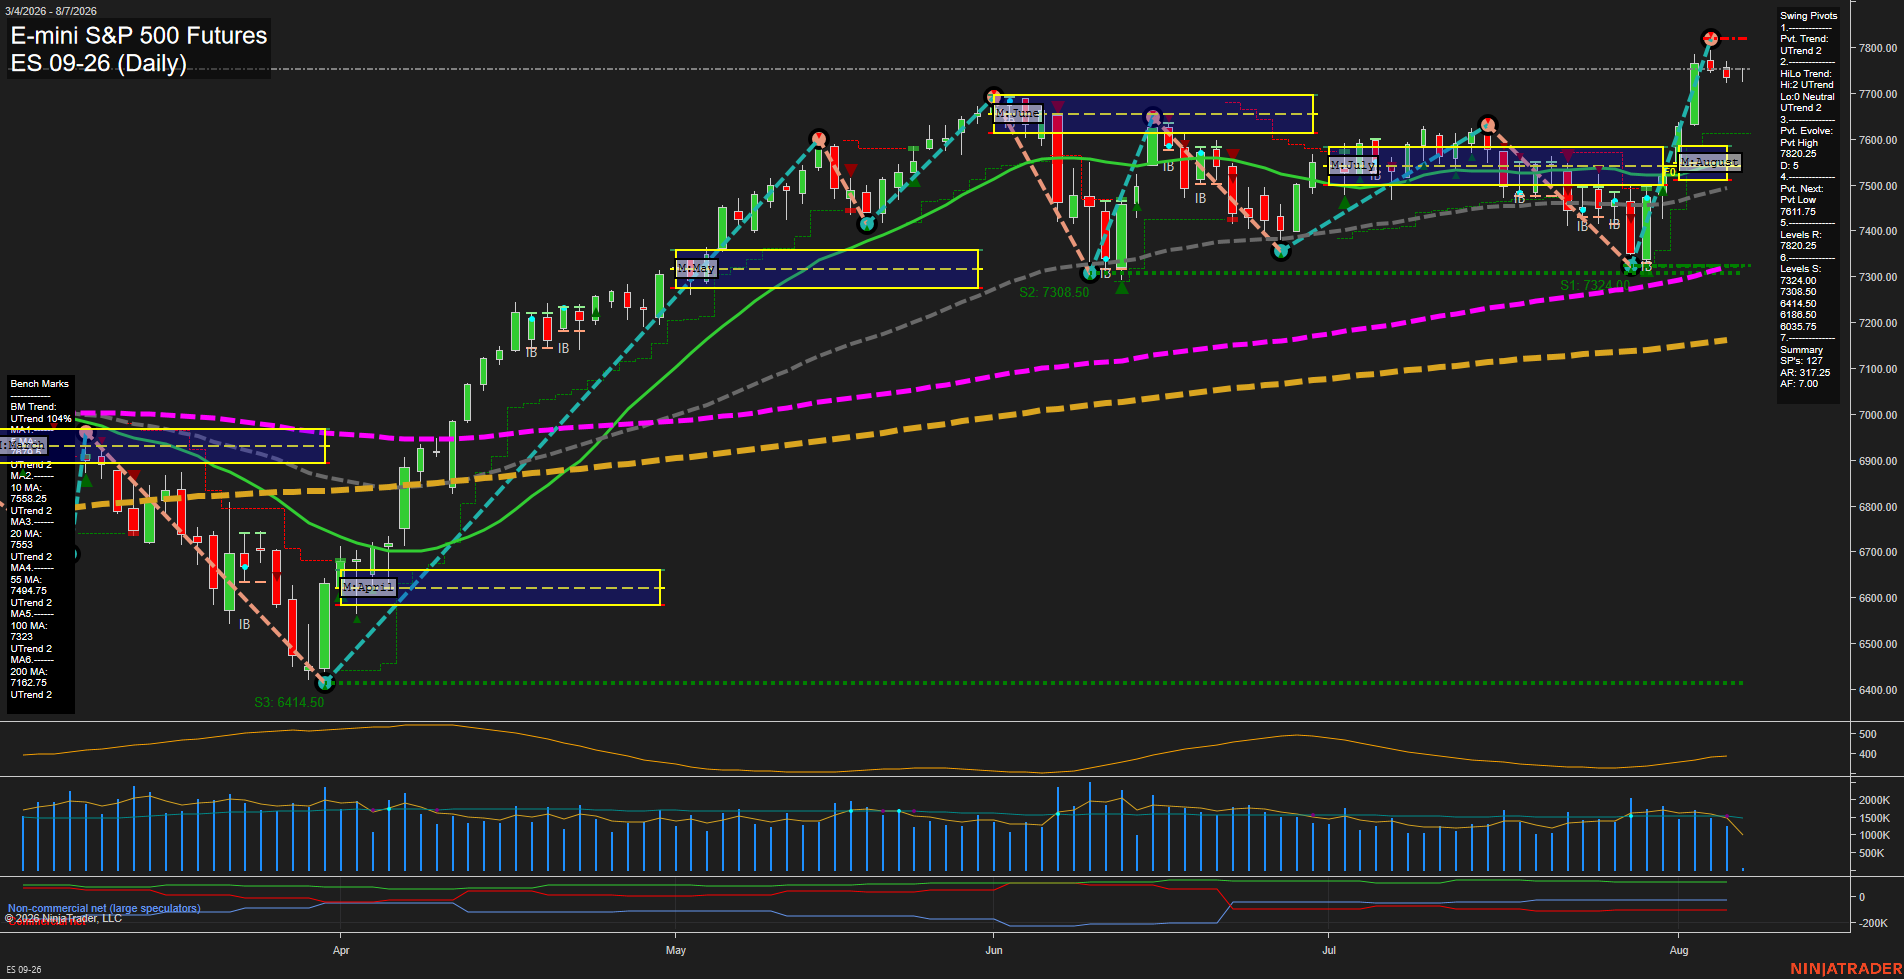
- ES Bullish YSFG/MSFG/WSFG, benchmarks rising below price, UTrend pivots; resistance 7810.25/7850.25, support 7734.00 then 7617.75; TR120 short countertrend.
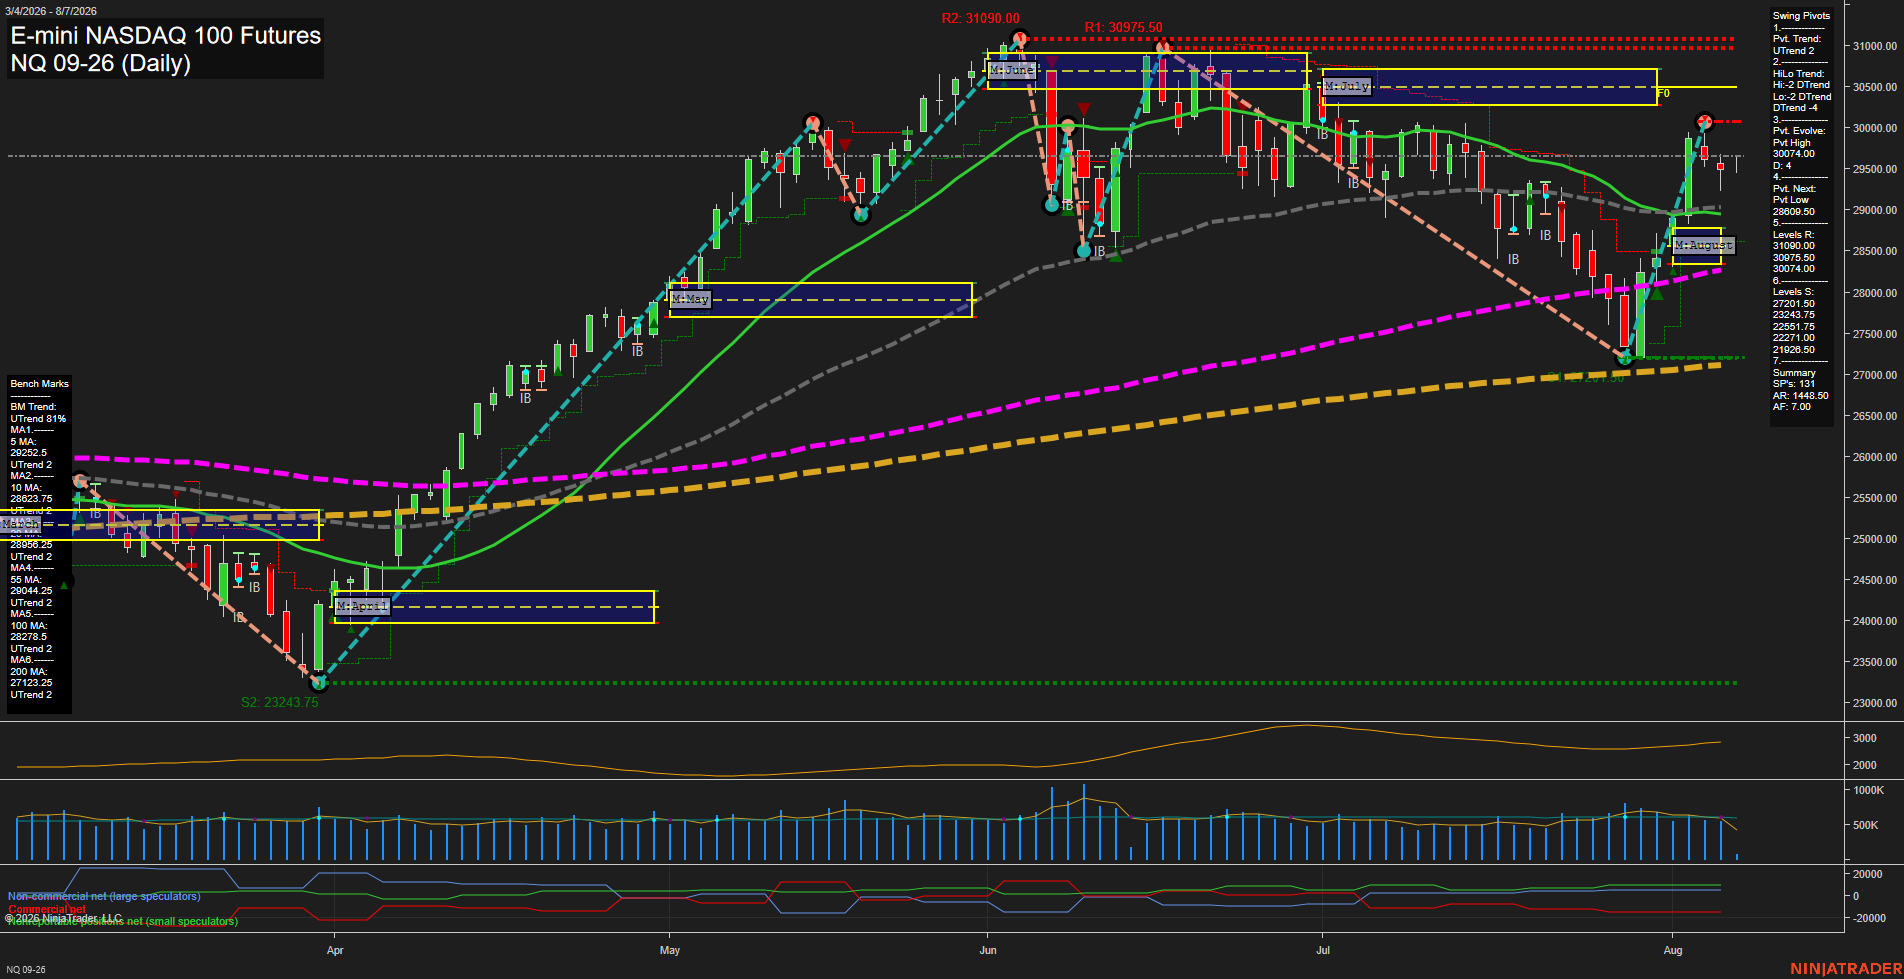
- NQ Bullish YSFG/MSFG/WSFG, rising 20–200-day benchmarks; resistance 30074–30190, pivot threshold 28609.50; short-term consolidation, intermediate HiLo DTrend.
- YM Bullish YSFG/MSFG/WSFG, all benchmarks rising, UTrend pivots; resistance 54884, support 53402 then 52384/49709; recent pullback follows extended advance.
- EMD Bullish YSFG/MSFG/WSFG, rising benchmarks and UTrend pivots; resistance 3900.6–3906.8, support 3835.4–3802.8, reversal level 3798.8; TR120 short.
- RTY Weekly neutral, intermediate/long-term bullish; YSFG/MSFG/WSFG upward, benchmarks rising; resistance 3053.8–3068.4, support 2975.8–2943.7 then 2902.3; short-term consolidation.
- FDAX Bullish YSFG/MSFG/WSFG, all benchmarks rising, UTrend pivots; resistance 26524–26854, pullback threshold 25834, weekly reversal reference 24880; TR120 short countertrend.
Overall State
- Short-Term: Bullish
- Intermediate-Term: Bullish
- Long-Term: Bullish
Conclusion
Higher-timeframe alignment remains bullish across ES, NQ, YM, EMD, RTY, and FDAX. YSFG, MSFG, and WSFG structures are upward, with price generally above rising MA benchmarks and higher-high/higher-low pivot structures. ES, YM, EMD, and FDAX show TR120 short signals near swing resistance; NQ and RTY are consolidating beneath recent pivot highs. RTY weekly short-term state is neutral, while its intermediate- and long-term structures remain bullish.
Note: Intra-day counter-trend pullbacks or retracements may occur, HTF is context for informational usage and market structure. Glossary: Session Fib Grids periods of YSFG:’Yearly’, MSFG:’Monthly’, WSFG:’Weekly’
For full details visit: AlphaWebTrader Technicals
ES Daily View
Overall Rating
- Short-Term: Bullish
- Intermediate-Term: Bullish
- Long-Term: Bullish.
Key Insights Summary
Price remains in a broad daily uptrend, holding above every benchmark average while both the short-term pivot trend and intermediate HiLo trend remain UTrend. The recent advance accelerated sharply from the 7308.50 support region into the 7810.25 pivot high, followed by a modest pullback and consolidation beneath that high. The 7734.00 pivot support is immediately nearby, while 7617.75 marks the next pivot-reversal threshold and the upper 7600s remain an important retracement area. Weekly, monthly, and yearly Fib-grid structure remains positive, although the short-term TR120 signal reflects countertrend pressure after the fast rally. Elevated ATR and active volume characterize a volatile expansion phase rather than a low-range consolidation.
View charts on: AlphaWebTrader HTF Charts
NQ Daily View
Overall Rating
- Short-Term: Bullish
- Intermediate-Term: Bullish
- Long-Term: Bullish.
Key Insights Summary
NQ has produced a fast V-shaped recovery from the late-July low near 27200 and remains above the rising 5-, 20-, 55-, 100-, and 200-day benchmarks. The short-term pivot trend and weekly grid remain upward, while the August monthly grid also holds an upward bias. The market is consolidating beneath the newly established 30074 pivot-high resistance after a high-velocity rebound, with smaller recent bars indicating a pause in momentum rather than a broad trend reversal. The intermediate HiLo pivot structure remains DTrend, reflecting the prior July decline and leaving 30074 as the key overhead swing reference; 28609.50 defines the opposite short-term pivot threshold. Long-term structure remains firmly constructive with price substantially above the 200-day benchmark and the yearly grid positioned in the upper range.
View charts on: AlphaWebTrader HTF Charts
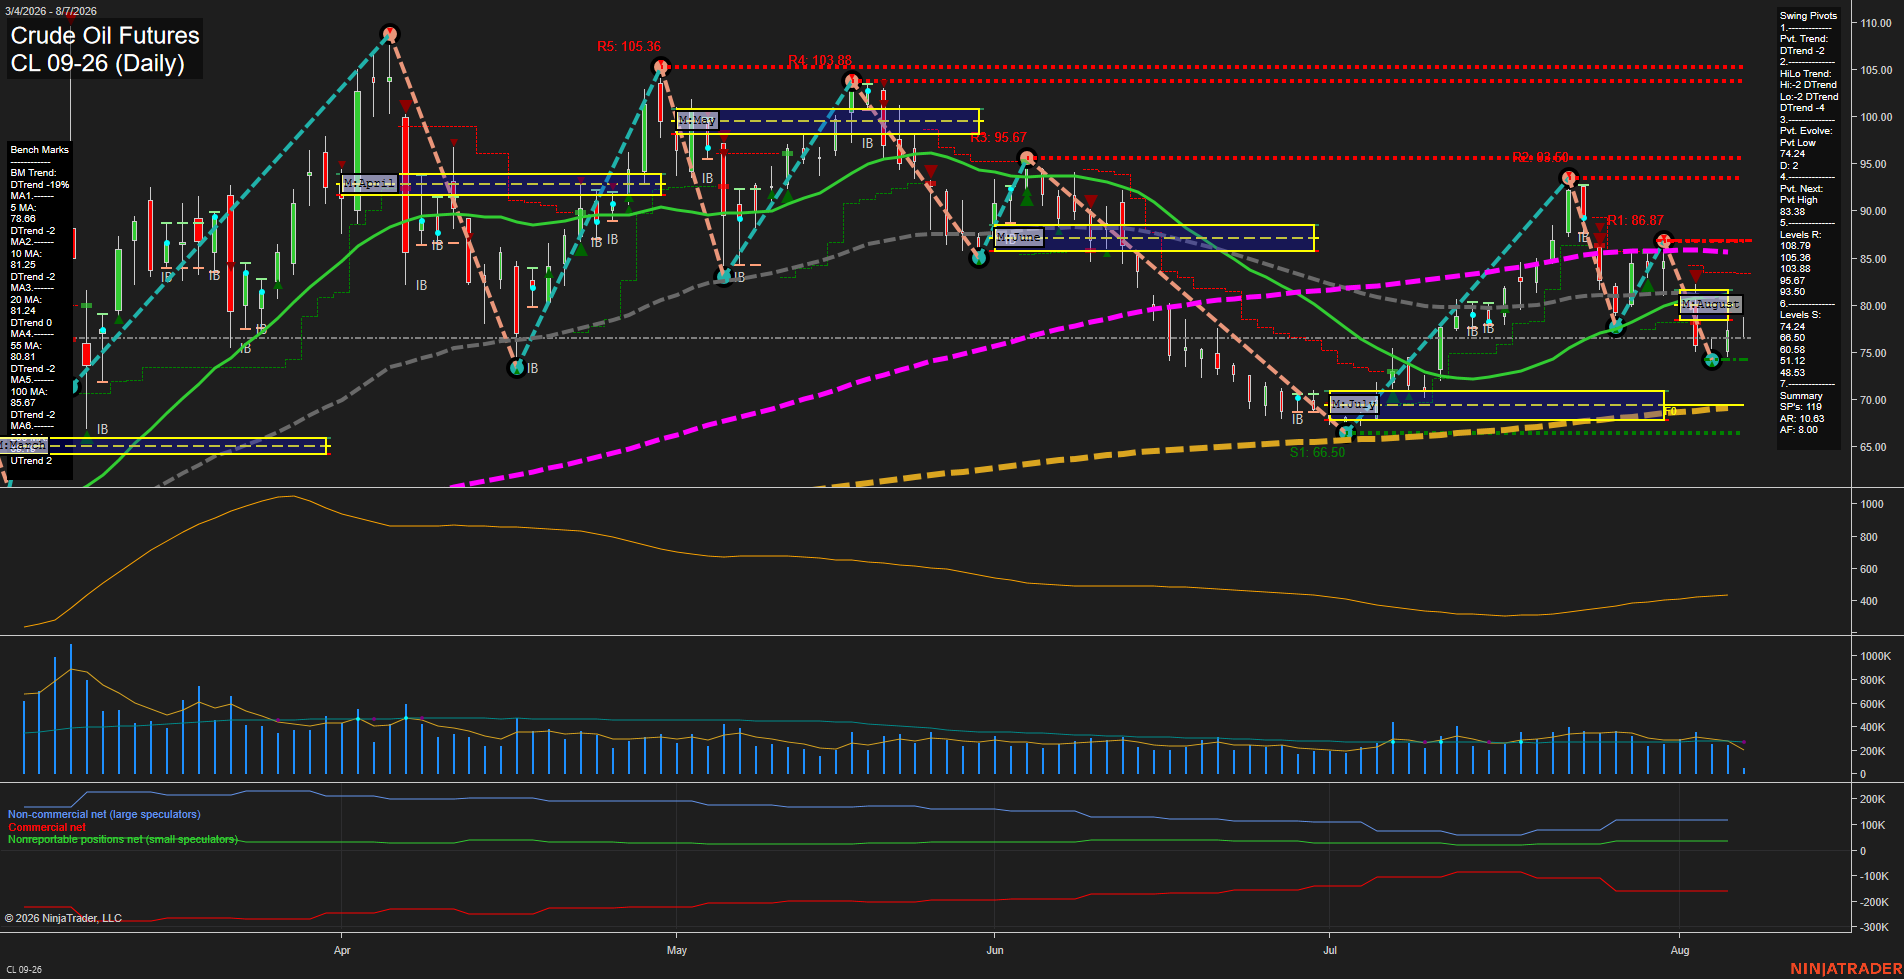
CL Daily View
Overall Rating
- Short-Term: Bearish
- Intermediate-Term: Bearish
- Long-Term: Bullish.
Key Insights Summary
CL has shifted into a fast downside swing, with a large bearish bar extending the decline from the 86.87 pivot high and breaking below the August monthly grid. Price is beneath every short- and intermediate-term benchmark, while both pivot structures remain in DTrend alignment. The 74.24 pivot-low area is the immediate structural support; below it, the chart opens toward the 66.50 support zone near the rising 200-day benchmark. Long-term structure remains constructive because price is above the 200-day average and the yearly fib grid remains positive, but the current daily swing is a sharp countertrend selloff within that broader backdrop.
View charts on: AlphaWebTrader HTF Charts
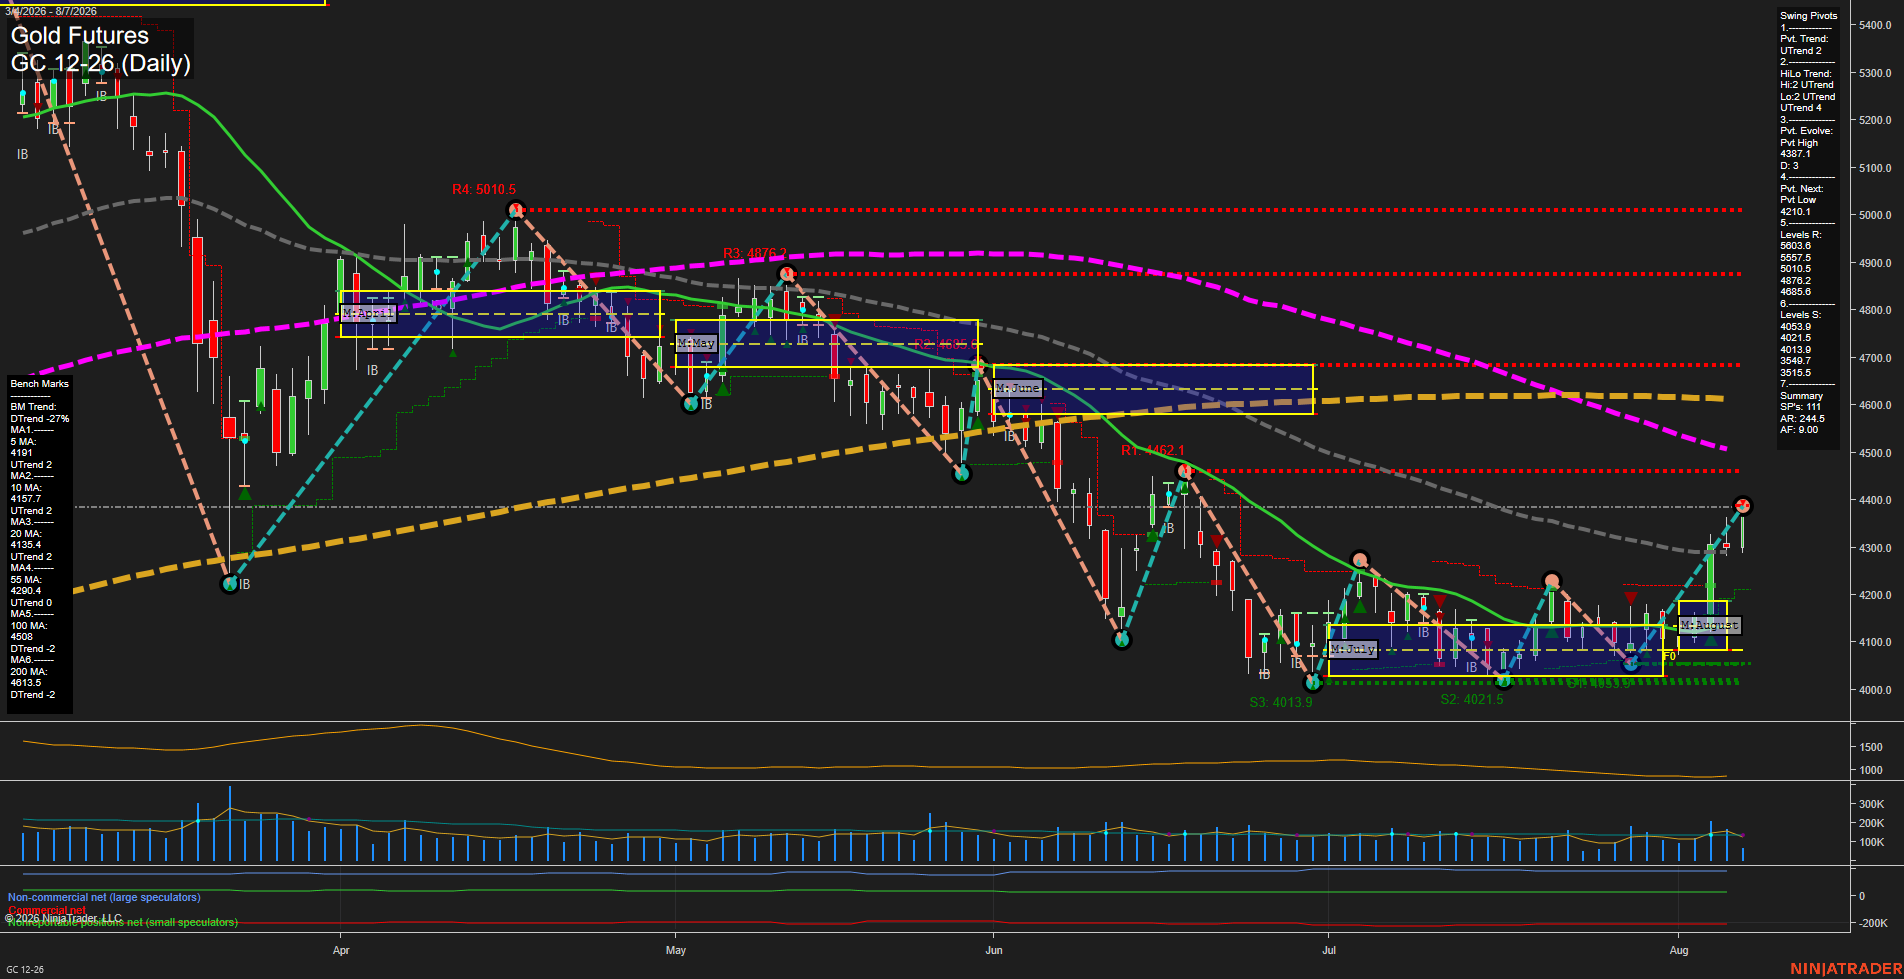
GC Daily View
Overall Rating
- Short-Term: Bullish
- Intermediate-Term: Bullish
- Long-Term: Bearish.
Key Insights Summary
Gold has produced a sharp V-recovery from the July/August 4014-4054 support base, with large-range upside bars lifting price above the 5, 10, 20, and 55-day benchmarks. Short-term and intermediate pivot structures are UTrend, while weekly and monthly Fib-grid readings remain above their F0%/NTZ areas. The rally is approaching the 4378 pivot-high area, with 4685.6 the next material swing resistance. Long-term structure remains countertrend because price is below declining 100-day and 200-day benchmarks at 4508 and 4613, respectively.
View charts on: AlphaWebTrader HTF Charts