NYSE pre-market radar tracks Tesla, Nvidia and gold ETF gains, bullish futures, weak jobs data and Strait of Hormuz energy risks before U.S. inflation data.
Fundamentals: Weak U.S. payrolls data supported equities, Treasuries and precious metals as expectations for further Fed tightening eased. The S&P 500 closed at a record, while futures were mostly higher amid continued earnings and AI-investment optimism. Oil and European natural gas rose as Strait of Hormuz shipping restrictions sustained supply concerns ahead of key U.S. inflation data.
Technicals: Pre-market analysis shows broad bullish alignment in S&P 500, Nasdaq, E-mini S&P MidCap and DAX futures, with major indexes holding above rising benchmark averages. The Dow is in a short-term pullback beneath recent highs, while Russell 2000 futures consolidate near resistance. Tesla, Nvidia and GLD led prior-session gains, while USO and Google declined.
Pre-Market Trading 360° view Market Radar of: holidays, earnings, eco-news, market-news summary, news sentiment, prior session major ETFs, MAG7, Higher Time Frame Analysis Indices Futures Summary, and E-mini S&P500, Nasdaq 100, NYMEX Crude, Gold Futures Daily Chart analysis.
As of: August 10, 2026 07:16 CT
Earnings Radar
Monitoring for earnings releases by the Magnificent 7, AI-tech-related firms, and major financial institutions.
- SMCI Release: 2026-08-11 T:AMC
Conclusion: Super Micro Computer (SMCI) reports after the close on 2026-08-11, placing an AI-server and semiconductor-infrastructure earnings event directly after the session. Index-futures attention centers on post-release reactions in AI and hardware sentiment; market momentum and volume can slow ahead of this major tech earnings release.
For full details visit: Yahoo Earnings Calendar
Market News Summary:
Weaker U.S. jobs data supported equities, bonds, gold, and rate-sensitive sentiment, while Hormuz disruption concerns lifted energy-market risk.
Primary Drivers & Risks:
- Primary Driver: Soft U.S. jobs data
- Primary Risk: Strait of Hormuz supply disruption
Tone:
Constructive risk sentiment with elevated geopolitical and inflation cross-currents.
Stock Market / ETFs / Indices:
The S&P 500 reached a record close after the jobs report, with sentiment remaining in the greed zone and U.S. futures mostly higher. J.P. Morgan raised its 2026 year-end S&P 500 target, citing earnings strength and AI-related revenue growth; enthusiasm also appeared in Chinese robotics and AI-optics themes. Valuation concerns, AI safety breaches, and earnings distortion from Anthropic-related markups remained noted risks.
Geopolitical:
U.S.-Iran talks remained stalled, while U.S. naval actions continued to redirect commercial ships from Iranian ports. Restricted Hormuz traffic and continued Houthi threats kept Middle East security risks elevated.
Oil / Energy:
Oil prices rose as doubts grew over a near-term reopening of the Strait of Hormuz, keeping tanker traffic restricted and supply concerns in focus. European TTF natural gas rose more than 5% on shipping uncertainty ahead of winter, while natural gas also showed short-term momentum.
Gold / Metals:
Gold and silver found support from a weaker dollar and reduced Fed-tightening expectations after weak payrolls data. CPI and PPI data, alongside technical resistance levels, were identified as near-term market focus points.
Fed / Financials:
Weak July payrolls reshaped interest-rate expectations, with reduced prospects for further Fed tightening and discussion of rates holding through December. Treasury yields fell, while Asian currencies consolidated against the dollar; Japanese officials highlighted weak-yen import-cost pressure and FX stability concerns.
Macro / Other:
Inflation data remained central after the jobs report, while commentary highlighted pressure on workers from inflation. Asia’s growth outlook included AI investment and substantial energy-transition capital expenditure.
Conclusion:
Soft U.S. labor data underpinned record equity sentiment, lower Treasury yields, and support for precious metals. AI investment and corporate earnings strength remained positive equity-market themes.
Hormuz shipping restrictions drove oil and European gas concerns and sustained geopolitical risk. Upcoming U.S. inflation data, elevated equity valuations, currency stress, and AI-related safety concerns added cross-currents.
Market News Sentiment
Market News Articles: 30
- Neutral: 56.67%
- Positive: 33.33%
- Negative: 10.00%
Sentiment Summary: Among 30 market news articles, 57% were neutral, 33% positive, and 10% negative, indicating predominantly neutral coverage with a positive tilt.
Conclusion: Indices futures day traders are facing a news backdrop with limited negative sentiment and moderate positive representation.
GLD,Gold Articles: 4
- Positive: 50.00%
- Negative: 25.00%
- Neutral: 25.00%
Sentiment Summary: GLD/Gold coverage was mixed-to-positive, with 50% positive, 25% negative, and 25% neutral articles.
Conclusion: Gold-related news tone was moderately positive, with negative coverage representing a smaller share of articles.
USO,Oil Articles: 8
- Positive: 50.00%
- Neutral: 37.50%
- Negative: 12.50%
Sentiment Summary: USO and oil coverage is balanced-to-positive, with 50% positive, 38% neutral, and 13% negative articles.
Conclusion: Oil-related news tone is moderately positive, with neutral coverage remaining significant and limited negative sentiment.
Market Data Snapshot
ETF Snapshot of major stock market ETFs, Mag7, and others as of: August 10, 2026 07:16
Top Movers & Losers
- TSLA 328.58 Bullish 2.83% ▲
- NVDA 223.96 Bullish 2.27% ▲
- GLD 398.47 Bullish 2.26% ▲
- MSFT 499.99 Bullish 0.03% ▲
- USO 117.98 Bearish -0.75% ▼
- GOOG 353.47 Bearish -0.88% ▼
Major Index ETFs: SPY, QQQ, DIA, IWM, IJH
- IJH 77.79 Bullish 1.35% ▲
- QQQ 723.03 Bullish 1.17% ▲
- IWM 301.56 Bullish 1.11% ▲
- SPY 773.26 Bullish 0.61% ▲
- DIA 539.62 Bullish 0.27% ▲
Major Index ETFs are Bullish across the group: IJH leads with +1.35%, followed by QQQ at +1.17% and IWM at +1.11%. SPY gains +0.61%, while DIA is the least positive mover at +0.27%.
Mag 7 Stocks: AAPL, MSFT, GOOG, AMZN, META, NVDA, TSLA
- TSLA 328.58 Bullish 2.83% ▲
- NVDA 223.96 Bullish 2.27% ▲
- AMZN 274.48 Bullish 0.82% ▲
- META 592.10 Bullish 0.37% ▲
- AAPL 313.33 Bullish 0.29% ▲
- MSFT 499.99 Bullish 0.03% ▲
- GOOG 353.47 Bearish -0.88% ▼
Mixed Mag7 snapshot: TSLA is the most bullish mover at +2.83%, followed by NVDA at +2.27%. AMZN, META, and AAPL remain Bullish at +0.82%, +0.37%, and +0.29%, while MSFT is marginally Bullish at +0.03%. GOOG is the most bearish mover at -0.88%.
Cross-Market ETFs: TLT, GLD, USO, IBIT
- GLD 398.47 Bullish 2.26% ▲
- IBIT 36.80 Bullish 0.85% ▲
- TLT 82.76 Bullish 0.29% ▲
- USO 117.98 Bearish -0.75% ▼
Other ETFs are Mixed: GLD is the most bullish mover at +2.26%, followed by IBIT at +0.85% and TLT at +0.29%. USO is the most bearish mover at -0.75%.
ETF, Mag7, and Cross-Market ETF Insights
Overall Tone
Mixed tone: broad equity ETF gains signal Bullish participation, while GLD strength and USO weakness show cross-market divergence.
Equity ETFs and Mag7:
Major Index ETFs were broadly Bullish, led by IJH at +1.35%, followed by QQQ at +1.17% and IWM at +1.11%; DIA was the least positive at +0.27%. Mag7 performance was selective: TSLA was the most bullish mover at +2.83% and NVDA gained +2.27%, while GOOG was the most bearish mover at -0.88%. SPY rose +0.61%, while MSFT was marginally higher at +0.03%.
Cross-Market ETFs:
Cross-market ETFs were Mixed, with GLD the most bullish mover at +2.26%, exceeding IBIT at +0.85% and TLT at +0.29%. USO was the most bearish mover at -0.75%, contrasting with the Bullish equity ETF backdrop. Gold strength alongside oil weakness indicates divergence across commodities despite gains in equities and bitcoin exposure.
Futures Indices – Higher Time Frame Analysis
Summary of the current state of US Indices Futures based on higher time-frame (HTF) technical analysis as of: 2026-08-10: 07:16 CT.
US Indices Futures
- ES: YSFG/MSFG/WSFG above F0%, above rising benchmarks, 7802.25 resistance, 7830.25 pivot high, 7617.75–7472.25 reversal support.
- NQ: YSFG/MSFG/WSFG above F0%, above rising benchmarks, 30074 pivot resistance, 30975.50–31090 overhead, 28809.50–27201 support.
- YM: MSFG/YSFG above F0%, WSFG below F0%, above major benchmarks, 54884 pivot resistance, 53462–52414 reversal support.
- EMD: YSFG/MSFG/WSFG above F0%, above rising benchmarks, 3906.8–3908.0 pivot resistance, 3789.8–3683.4 support.
- RTY: MSFG/YSFG above F0%, WSFG below F0%, above rising benchmarks, 3053.8–3068.4 resistance, 2962.7–2902.3 support.
- FDAX: YSFG/MSFG/WSFG above F0%, above rising benchmarks, 26527 pivot resistance, 25859 reversal level, 25508–25301 benchmark support.
Overall State
- Short-Term: Bullish
- Intermediate-Term: Bullish
- Long-Term: Bullish
Conclusion
ES, NQ, EMD, RTY, and FDAX retain aligned higher-timeframe upward structures, with price above rising benchmark averages and YSFG/MSFG support. ES, NQ, EMD, and FDAX are testing pivot-high resistance after fast advances. YM has the weakest short-term correlation, with daily and weekly WSFG conditions below F0% following rejection from 54884. RTY also holds below weekly F0% while intermediate and long-term structure remains upward. Pivot-reversal levels define nearby structural support across the group.
Note: Intra-day counter-trend pullbacks or retracements may occur, HTF is context for informational usage and market structure. Glossary: Session Fib Grids periods of YSFG:’Yearly’, MSFG:’Monthly’, WSFG:’Weekly’
For full details visit: AlphaWebTrader Technicals
ES Daily View
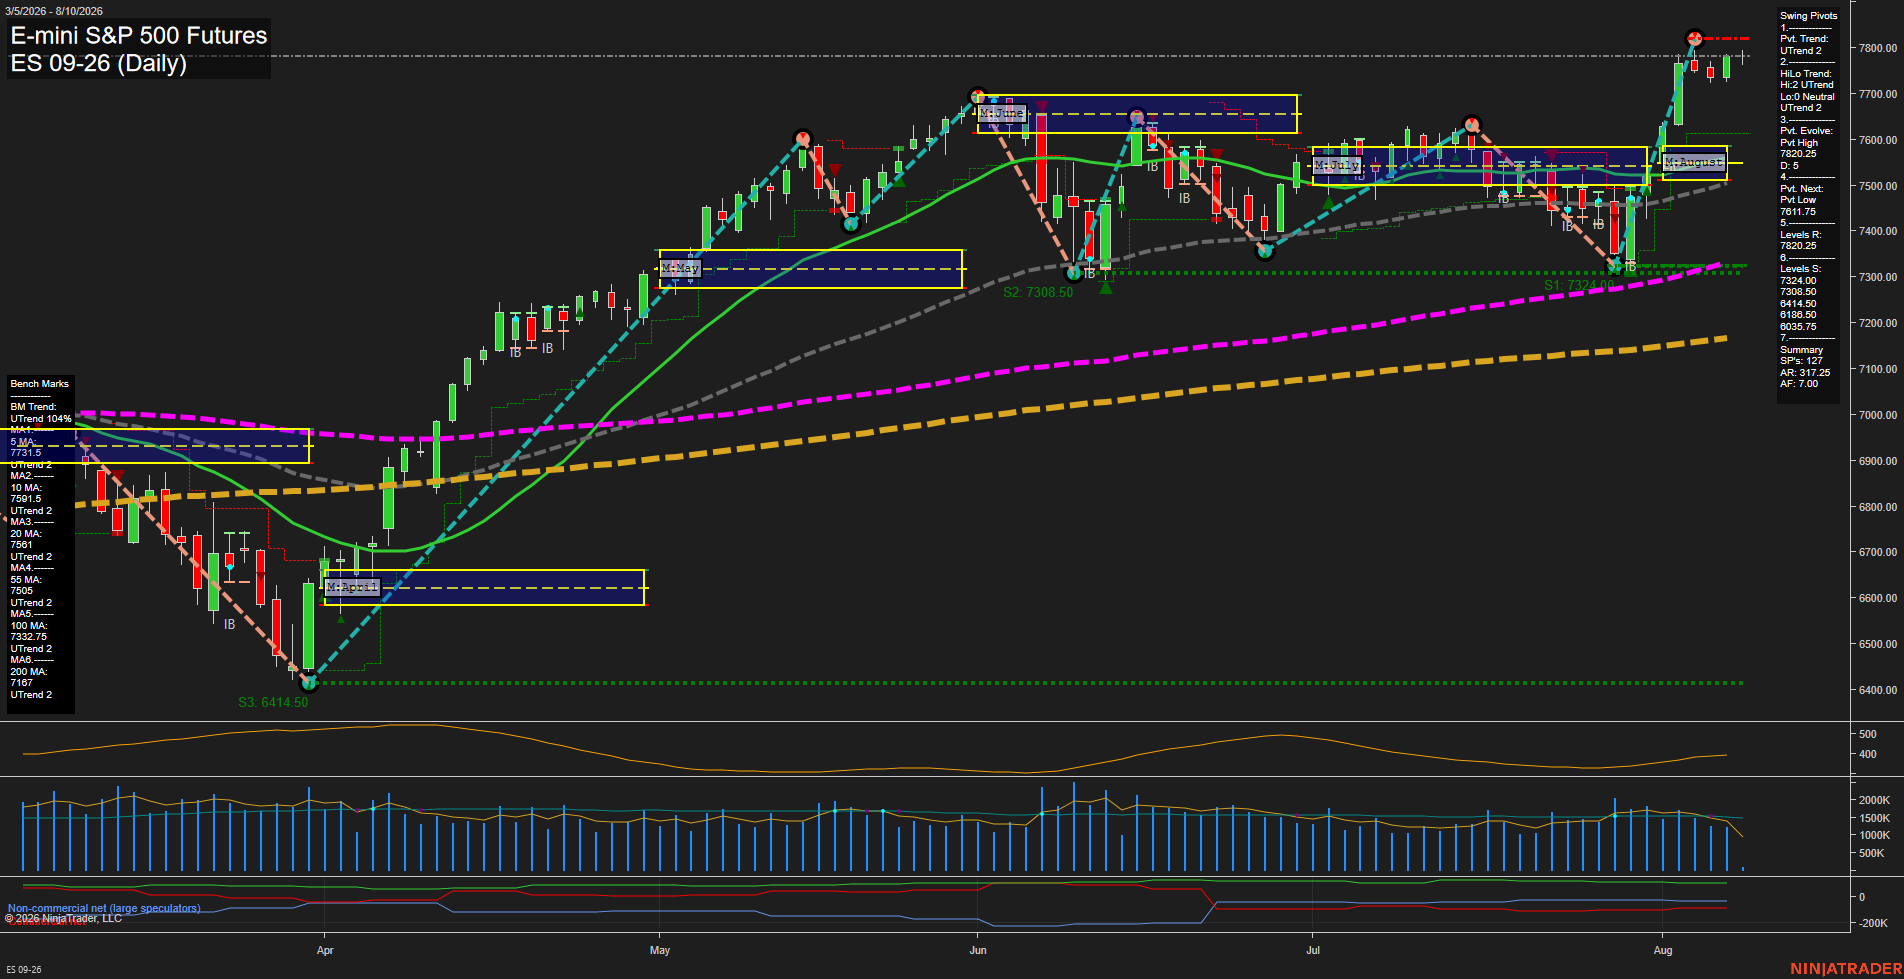
Overall Rating
- Short-Term: Bullish
- Intermediate-Term: Bullish
- Long-Term: Bullish.
Key Insights Summary
The daily swing structure is broadly bullish, with price extending from the early-August higher low into a fresh pivot-high test near 7802.25. Price is above all six rising benchmark averages, while weekly, monthly, and yearly Fib-grid biases remain above F0%, confirming alignment across the short-, intermediate-, and long-term trend layers. The recent advance has been fast and is pressing directly beneath pivot resistance, following a sharp V-shaped recovery from the late-July support area. Volume is broadly steady rather than expanding aggressively, while the next pivot reversal level at 7617.75 defines the nearby short-term structural line separating continuation from a deeper retracement.
View charts on: AlphaWebTrader HTF Charts
NQ Daily View
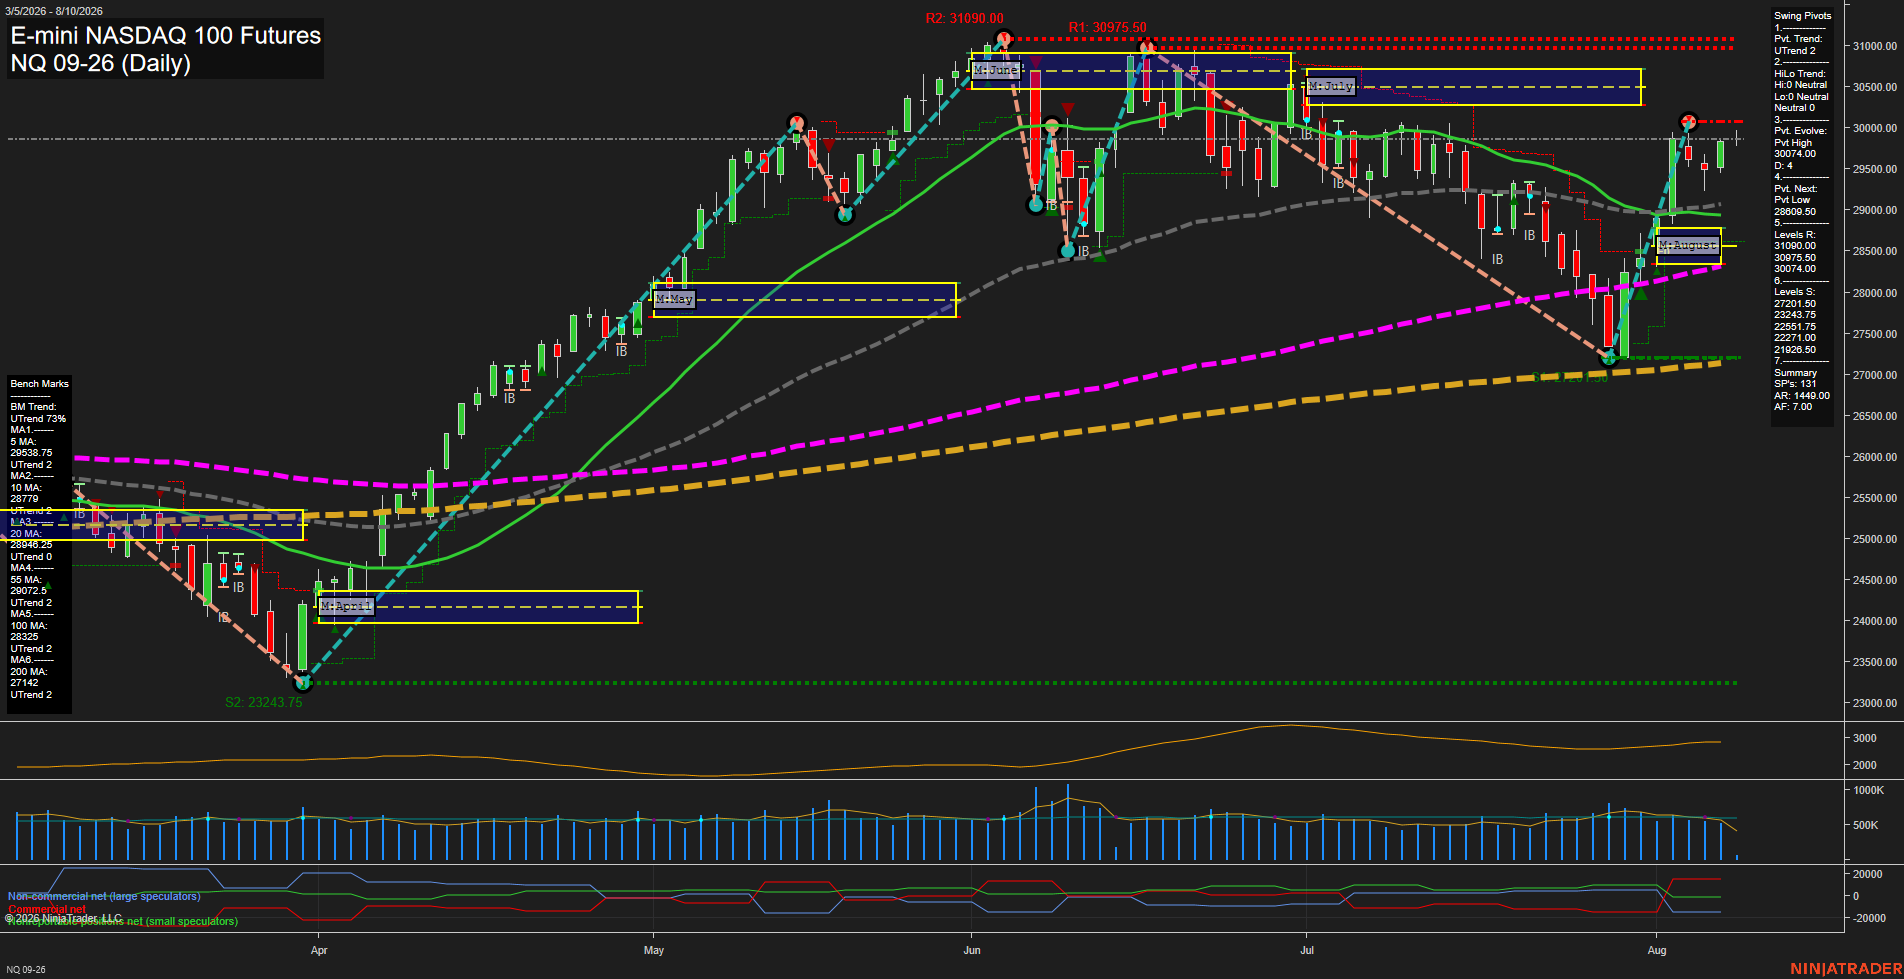
Overall Rating
- Short-Term: Bullish
- Intermediate-Term: Bullish
- Long-Term: Bullish.
Key Insights Summary
Price has produced a strong V-recovery from the late-July swing low near 27201.50 and is now consolidating just above 30000. The short-term pivot trend is up, price is above all benchmark averages, and the weekly, monthly, and yearly fib-grid structures remain positive. The 30074 pivot-high area is the immediate inflection level, while 30975.50 and 31090 define the higher resistance cluster. The intermediate pivot structure remains neutral following the sharp recovery, although rising 20-day and 55-day benchmarks and price above the August MSFG support the broader bullish continuation theme. The 28809.50 pivot-low reversal level is the principal nearby structural support beneath the current advance.
View charts on: AlphaWebTrader HTF Charts
CL Daily View
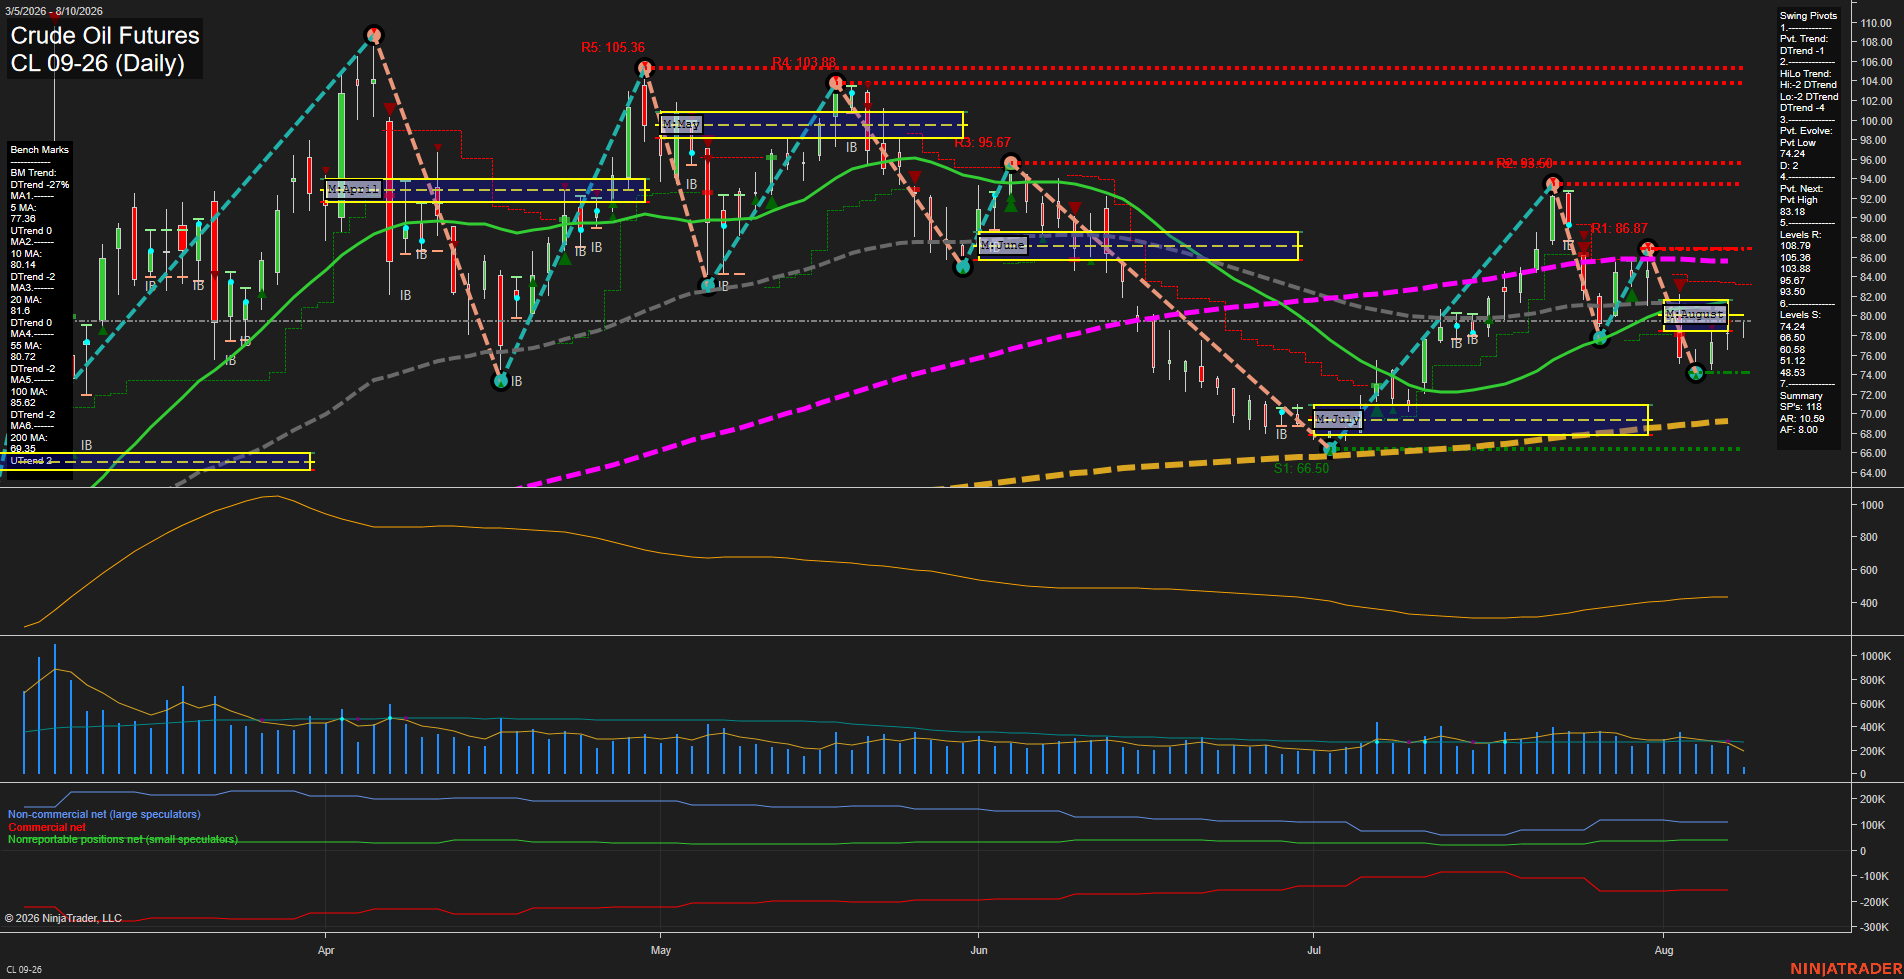
Overall Rating
- Short-Term: Bearish
- Intermediate-Term: Bearish
- Long-Term: Bullish.
Key Insights Summary
CL is rebounding from the 74.24 swing-low pivot and is marginally above the weekly F0% area, but the short-term pivot structure remains in a DTrend with 83.18 defining the next swing-high reversal threshold. Price is beneath the 10, 20, 55, and 100-day benchmarks, reflecting a counter-trend bounce within a broader intermediate decline. The August MSFG remains below F0%, while the longer-term yearly grid and rising 100-day and 200-day benchmarks preserve the larger bullish structure. The market is currently compressed between the 74.24 support pivot and the nearby 80.72 to 81.60 benchmark cluster, with 86.87 and 93.50 representing higher resistance areas.
View charts on: AlphaWebTrader HTF Charts
GC Daily View
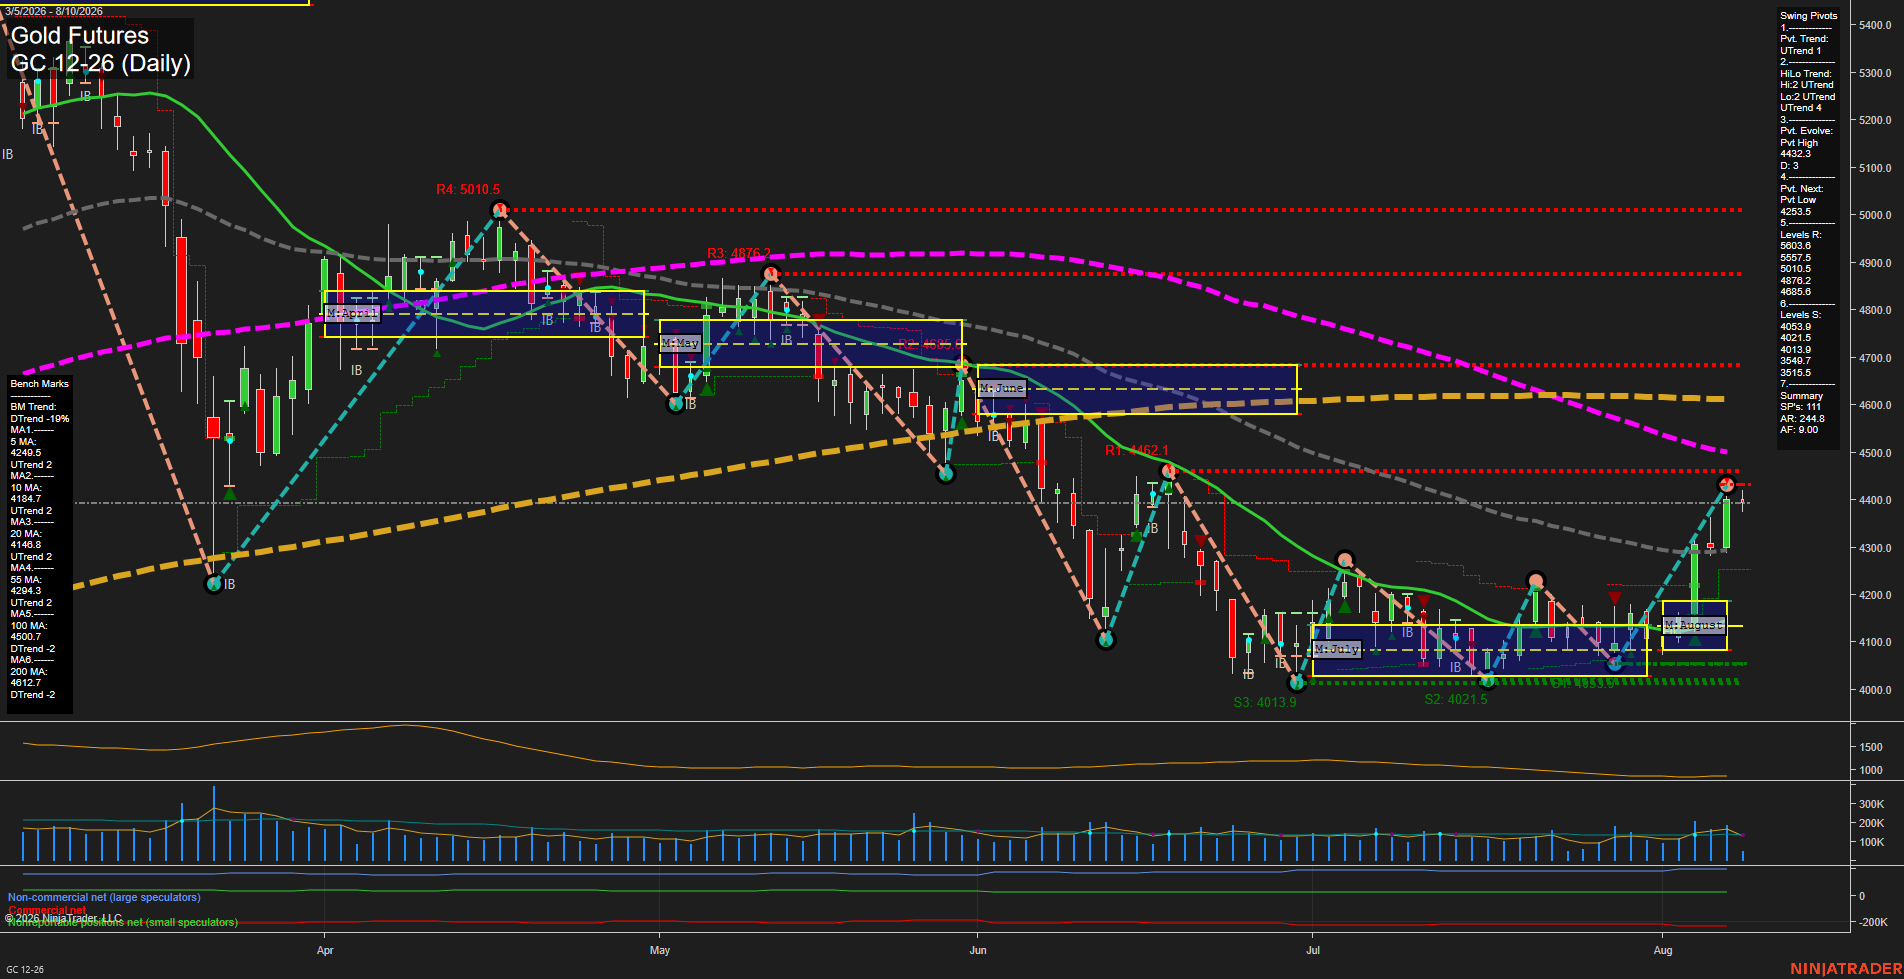
Overall Rating
- Short-Term: Bullish
- Intermediate-Term: Bullish
- Long-Term: Bearish.
Key Insights Summary
GC has produced a sharp V-style recovery from the early-August 4,000 area, reclaiming the 5-, 10-, 20-, and 55-day benchmarks while establishing an UTrend in both the short-term pivot and intermediate HiLo structures. The rally is approaching the 4432.3 evolving pivot high, with 4685.6 the next major overhead pivot resistance. Weekly fib positioning remains marginally below F0%, creating a countertrend element within the stronger monthly upswing. Long-term structure remains bearish because price is still below declining 100- and 200-day benchmarks and the yearly grid remains below F0%; the current advance therefore represents a high-momentum recovery inside a broader long-term decline.
View charts on: AlphaWebTrader HTF Charts