U.S. stocks closed lower as Iran-related oil disruption lifted crude and gold, while record valuations and inflation concerns kept markets cautious.
Fundamentals: U.S. equities ended lower despite record-high index levels and stronger-than-expected earnings, as Iran-related supply disruption pushed oil prices higher and supported safe-haven demand for gold. Investors weighed elevated equity valuations, rising energy costs and renewed inflation sensitivity, while developments around the Strait of Hormuz remained a key market focus.
Technicals: US market leaders were mixed at the close, with gains in USO, Meta and Tesla offset by declines in Apple, Amazon and Alphabet. Futures analyses showed bullish intermediate- and long-term structures across ES, NQ, YM, EMD, RTY and FDAX, though several contracts were consolidating below pivot highs as short-term momentum and fib readings turned mixed.
After Market Close daily snapshot: market news summary and sentiment, major ETFs, Magnificent 7 analysis, Indices Futures Higher Time Frame Analysis, and E-mini S&P500, Nasdaq 100, NYMEX Crude, Gold Futures Daily Chart analysis.
As of: August 11, 2026 05:00 CT
Market News Summary:
U.S. equities finished lower despite record-high index levels and strong earnings, while Iran-related oil disruption lifted energy prices and safe-haven demand.
Primary Drivers & Risks:
- Primary Driver: Iran-related oil supply disruption
- Primary Risk: Elevated equity valuations and inflation
Tone:
Cautious risk-off, with energy and safe havens firm.
Stock Market / ETFs / Indices:
Stocks traded lower by midday and at the close, even as the S&P 500 remained at record highs and earnings exceeded Wall Street expectations. The S&P 500’s Shiller P/E of 42 was described as its highest since the dot-com era, highlighting valuation sensitivity. AI capital spending, semiconductor interest, and robotics enthusiasm remained important equity-market themes.
Geopolitical:
Iran war concerns and the Strait of Hormuz standoff remained central market catalysts. Pakistan said the United States and Iran were close to an arrangement, while both sides maintained firmer public positions; the Strait of Hormuz and Red Sea remained critical energy choke points.
Oil / Energy:
Oil prices advanced as traders focused on constrained Middle East production and the absence of a near-term U.S.-Iran agreement. WTI was cited at $82.47 per barrel, up 5.5% from a month earlier, while technical commentary focused on $94.34 after a breakout. The EIA said some Middle East output would remain shut through next year and production restoration could extend through 2027. Higher crude and a potential U.S. natural-gas shortage added to inflation and consumer-cost concerns.
Gold / Metals:
Gold held near a two-month high after reaching $4,435, supported by safe-haven demand linked to the Hormuz standoff despite a firmer dollar and elevated rates. Chinese first-half gold consumption rose 1.23%, as investment demand offset weaker jewelry sales. Gold, silver, and platinum also saw intraday profit-taking pressure.
Fed / Financials:
Higher oil prices renewed inflation concerns, while commentary cited potential rate hikes among longer-term market risks. Goldman Sachs described a higher-volatility regime but said credit fundamentals remained resilient, with limited broader contagion from wider hyperscaler funding spreads.
Macro / Other:
AI infrastructure spending remained a major capital-expenditure theme, with 2027 estimates above $1 trillion. Data-center demand increased power-market pressure in Virginia, where Dominion’s fuel costs have risen sharply amid volatile wholesale electricity prices.
Conclusion:
Middle East supply disruption drove crude higher and supported gold as equities declined. Record-high U.S. index levels remained supported by earnings and technology investment themes.
High valuations, rising energy costs, and inflation sensitivity formed the main cross-currents. Hormuz negotiations and the pace of Middle East output restoration remained key uncertainty factors.
Market News Sentiment
Market News Articles: 39
- Neutral: 58.97%
- Positive: 25.64%
- Negative: 15.38%
Sentiment Summary: Among 39 market news articles, sentiment was 59% neutral, 26% positive, and 15% negative.
Conclusion: The news flow was predominantly neutral, with positive coverage exceeding negative coverage.
GLD,Gold Articles: 7
- Positive: 57.14%
- Negative: 28.57%
- Neutral: 14.29%
Sentiment Summary: GLD/Gold coverage is moderately positive, with 57% positive, 29% negative, and 14% neutral articles across 7 items.
Conclusion: Gold-related news tone is positive overall, while nearly one-third of coverage remains negative.
USO,Oil Articles: 15
- Negative: 46.67%
- Positive: 33.33%
- Neutral: 20.00%
Sentiment Summary: USO and oil coverage was mixed-to-negative, with 47% negative, 33% positive, and 20% neutral articles.
Conclusion: For indices futures day traders, oil-related news tone showed more negative than positive coverage, indicating a modestly cautious energy-news backdrop.
Market Data Snapshot
ETF Snapshot of major stock market ETFs, Mag7, and others as of: August 11, 2026 05:00
Top Movers & Losers
- USO 127.61 Bullish 1.34% ▲
- META 599.12 Bullish 0.71% ▲
- TSLA 332.81 Bullish 0.58% ▲
- AAPL 304.91 Bearish -1.09% ▼
- AMZN 272.27 Bearish -2.09% ▼
- GOOG 343.00 Bearish -3.61% ▼
Major Index ETFs: SPY, QQQ, DIA, IWM, IJH
- IWM 300.99 Bullish 0.34% ▲
- IJH 77.77 Bullish 0.30% ▲
- DIA 537.28 Bearish -0.32% ▼
- SPY 770.56 Bearish -0.32% ▼
- QQQ 718.45 Bearish -0.34% ▼
Mixed index ETF snapshot: IWM is the most bullish mover at +0.34%, followed by IJH at +0.30%. QQQ is the most bearish mover at -0.34%, while SPY and DIA each declined -0.32%.
Mag 7 Stocks: AAPL, MSFT, GOOG, AMZN, META, NVDA, TSLA
- META 599.12 Bullish 0.71% ▲
- TSLA 332.81 Bullish 0.58% ▲
- NVDA 217.50 Bearish -0.02% ▼
- MSFT 503.81 Bearish -0.44% ▼
- AAPL 304.91 Bearish -1.09% ▼
- AMZN 272.27 Bearish -2.09% ▼
- GOOG 343.00 Bearish -3.61% ▼
Mixed: META is the most bullish mover at +0.71%, followed by TSLA at +0.58%. NVDA is marginally Bearish at -0.02%. GOOG is the most bearish mover at -3.61%, with AMZN -2.09%, AAPL -1.09%, and MSFT -0.44% also Bearish.
Cross-Market ETFs: TLT, GLD, USO, IBIT
- USO 127.61 Bullish 1.34% ▲
- TLT 82.19 Bullish 0.16% ▲
- GLD 400.96 Bearish -0.39% ▼
- IBIT 35.94 Bearish -0.80% ▼
Mixed cross-market context: USO is the most bullish mover at +1.34%, while TLT is marginally Bullish at +0.16%. IBIT is the most bearish mover at -0.80%, with GLD also Bearish at -0.39%.
ETF, Mag7, and Cross-Market ETF Insights
Overall Tone
Mixed conditions: small-cap and mid-cap equity ETFs were Bullish while major large-cap ETFs and most Mag7 names were Bearish, alongside strong oil and weaker bitcoin exposure.
Equity ETFs and Mag7:
Major Index ETFs were mixed, with IWM at +0.34% and IJH at +0.30% contrasting with QQQ at -0.34%, SPY and DIA each at -0.32%. Mag7 performance was selective: META was the most bullish mover at +0.71%, followed by TSLA at +0.58%, while GOOG was the most bearish mover at -3.61%; NVDA was marginally Bearish at -0.02%.
Cross-Market ETFs:
Cross-market ETFs were mixed, led by USO as the most bullish mover at +1.34%, while TLT was modestly Bullish at +0.16%. GLD was Bearish at -0.39%, and IBIT was the most bearish mover at -0.80%, diverging from oil strength.
Futures Indices – Higher Time Frame Analysis
Summary of the current state of US Indices Futures based on higher time-frame (HTF) technical analysis as of: 2026-08-11: 17:00 CT.
US Indices Futures
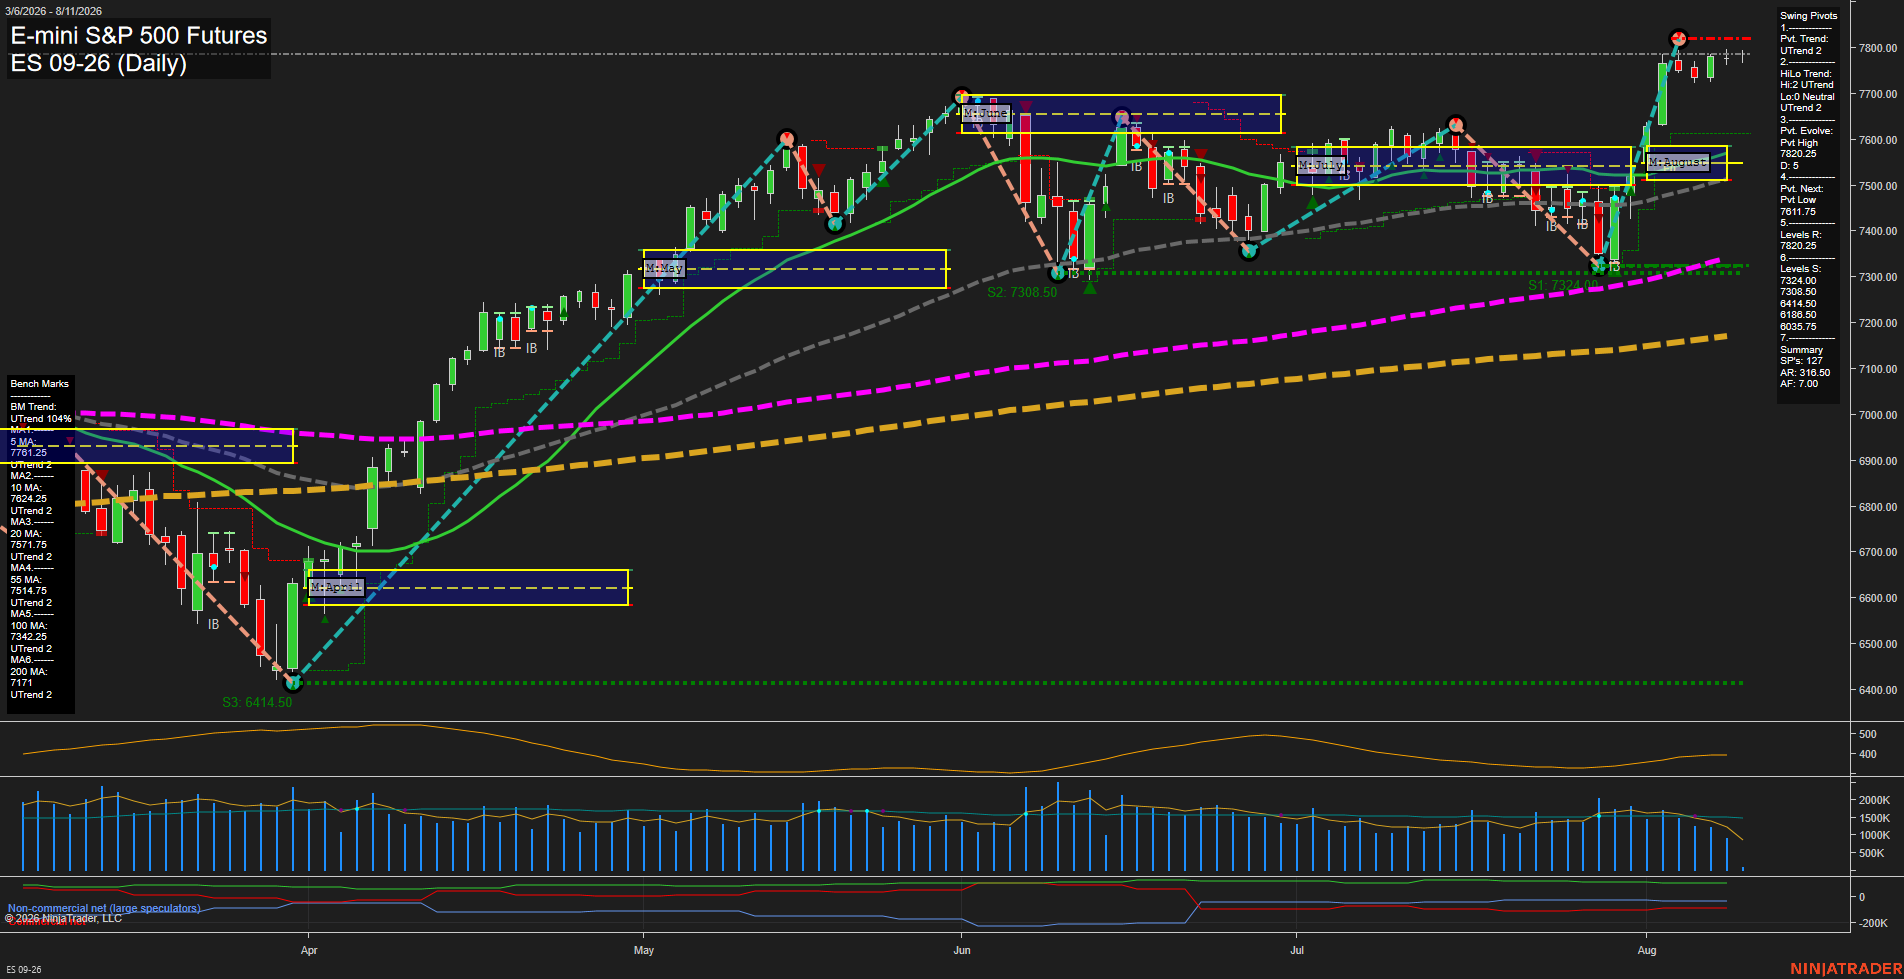
- ES Bullish YSFG/MSFG/WSFG alignment, above rising benchmarks, 7820.25 resistance, 7617.75 pivot support; higher highs and lows intact.
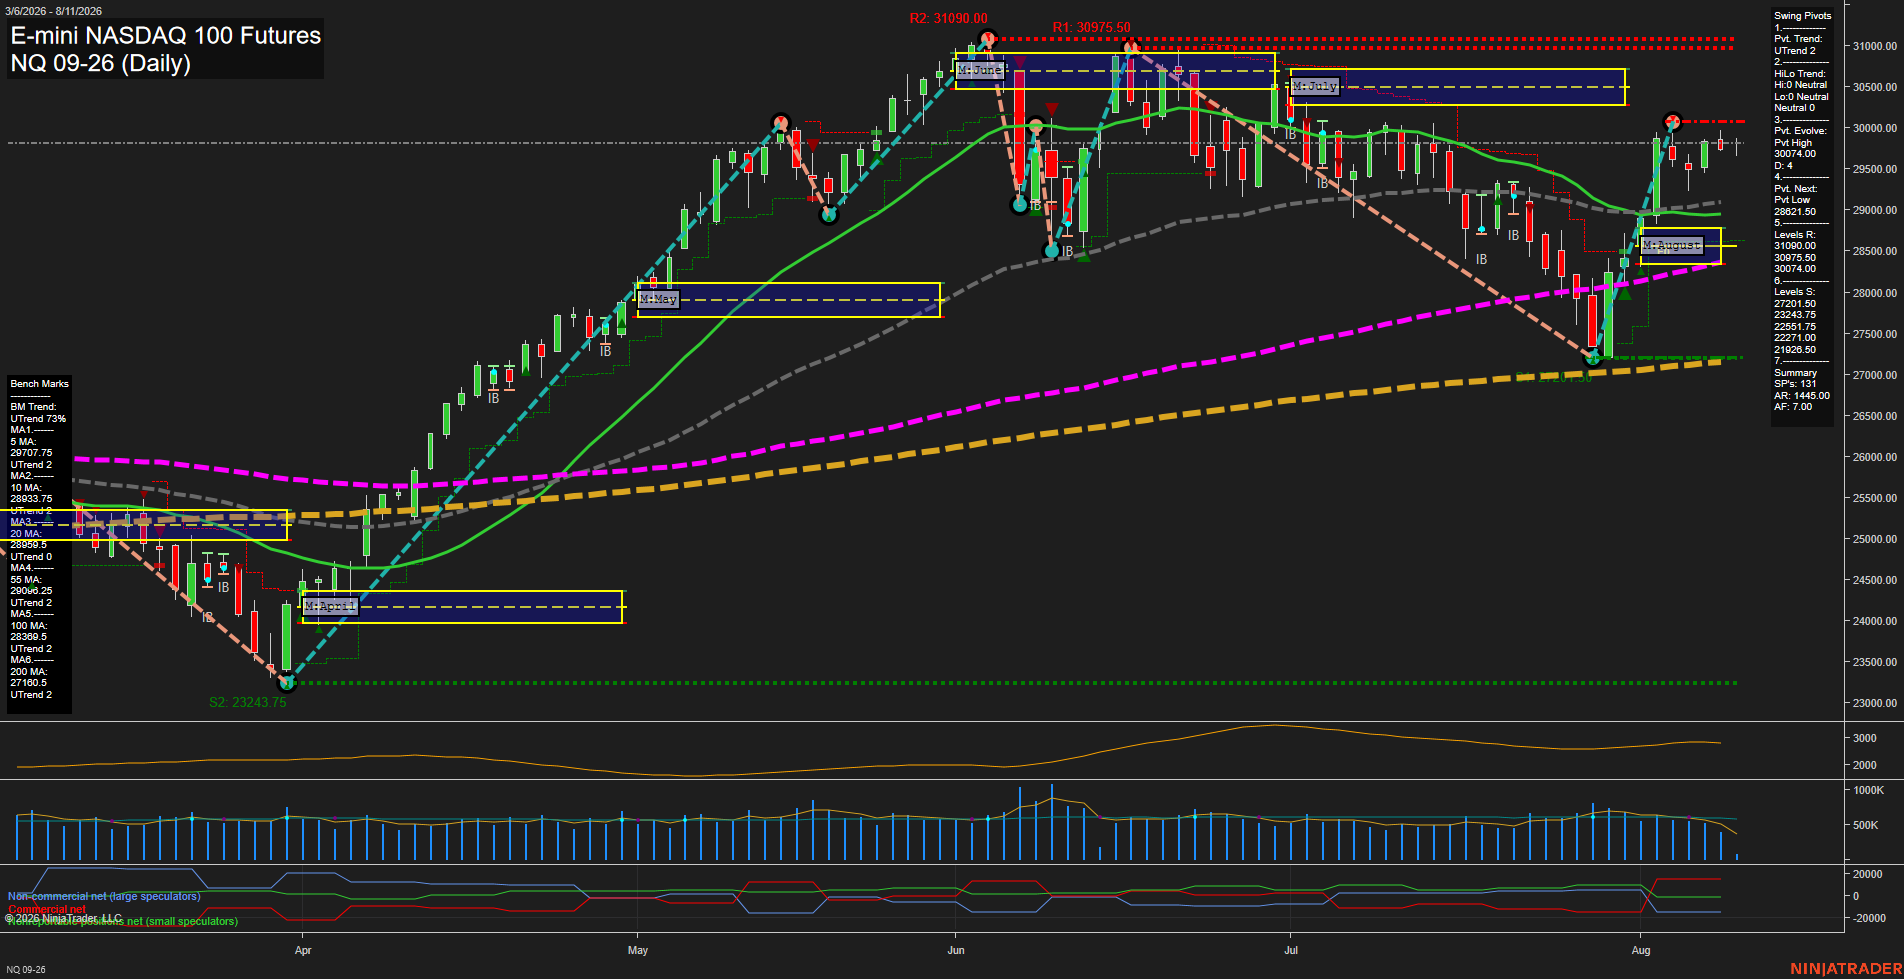
- NQ Neutral short-term, bullish MSFG/YSFG and benchmarks; WSFG below F0%, 30074 resistance, 28621.50 reversal pivot support.
- YM Neutral short-term: WSFG below F0% and short signal; MSFG/YSFG and benchmarks rising, 54884 resistance, 53402 pivot support.
- EMD Bullish, neutral WSFG at F0%; MSFG/YSFG, pivots and rising benchmarks aligned, 3906.8 resistance, 3789.8 reversal support.
- RTY Neutral short-term: WSFG down below F0%; MSFG/YSFG and benchmarks rising, 3068.4 resistance, 2902.3 and 2828.1 support.
- FDAX Bullish daily, neutral weekly; MSFG/YSFG and rising benchmarks aligned, 26527 resistance, 25885 pivot and 24715 swing support.
Overall State
- Short-Term: Neutral
- Intermediate-Term: Bullish
- Long-Term: Bullish
Conclusion
Intermediate- and long-term directional correlation remains bullish across ES, NQ, YM, EMD, RTY, and FDAX: MSFG/YSFG positioning, rising benchmark stacks, and upward pivot structures remain broadly aligned. ES, NQ, EMD, RTY, and FDAX are testing pivot-high resistance, while YM is consolidating beneath 54884. Short-term WSFG conditions are mixed, with NQ, YM, and RTY below weekly F0% references; EMD is neutral at F0%, while ES remains aligned upward. Recent compression and short-duration countertrend signals occur near resistance, with listed pivot supports defining the nearest structural references.
Note: Intra-day counter-trend pullbacks or retracements may occur, HTF is context for informational usage and market structure. Glossary: Session Fib Grids periods of YSFG:’Yearly’, MSFG:’Monthly’, WSFG:’Weekly’
For full details visit: AlphaWebTrader Technicals
ES Daily View
Overall Rating
- Short-Term: Bullish
- Intermediate-Term: Bullish
- Long-Term: Bullish.
Key Insights Summary
The daily structure remains broadly bullish: price is above every benchmark average, all benchmark trends are rising, and both the short-term pivot and intermediate HiLo pivot trends are UTrend. The August advance produced a sharp V-shaped recovery from the 7308-7332 support area and carried ES back to the 7820.25 pivot resistance zone. Recent small candles beneath that high indicate consolidation following a fast momentum leg rather than a completed bearish reversal. Weekly, monthly, and yearly Fib-grid positioning remains above their F0%/NTZ reference areas, supporting alignment across the short-, intermediate-, and long-term trend frames. The 7820.25 swing high is the immediate overhead technical boundary, while 7617.75 is the defined short-term pivot reversal level; the 7571.75 20-day and 7514.75 55-day averages form the next intermediate trend-reference area below.
View charts on: AlphaWebTrader HTF Charts
NQ Daily View
Overall Rating
- Short-Term: Neutral
- Intermediate-Term: Bullish
- Long-Term: Bullish.
Key Insights Summary
Price has staged a sharp V-recovery from the late-July low near 27200 and is consolidating immediately beneath the 30074 swing-high pivot. The short-term pivot structure remains upward and price is above all benchmark averages, but the weekly fib position is marginally below F0%, reflecting near-term compression after the recovery surge. Intermediate and long-term conditions remain constructive, supported by rising 20-, 55-, 100-, and 200-day benchmarks, positive monthly and yearly fib-grid positions, and recent long-direction system signals. The 30074 pivot is the immediate structural ceiling, with 30975.50 and 31090 marking the higher resistance band; the 28621.50 pivot-next level defines the major reversal threshold within the current upswing.
View charts on: AlphaWebTrader HTF Charts
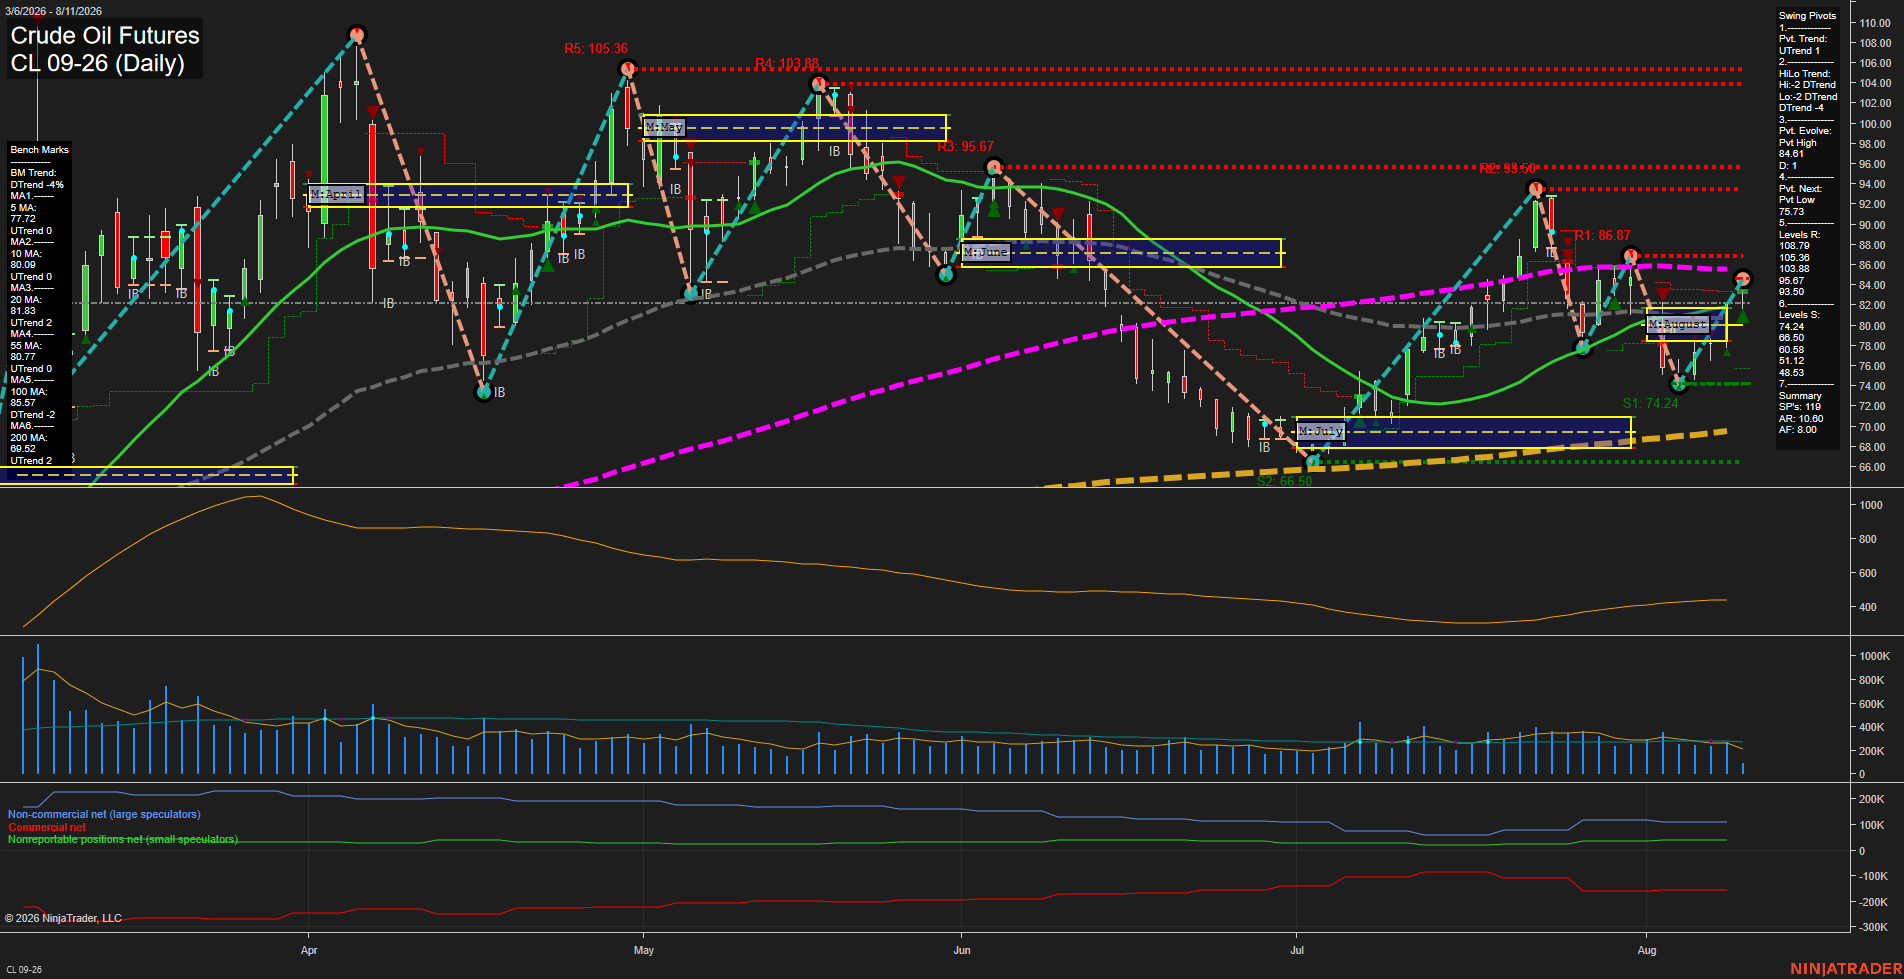
CL Daily View
Overall Rating
- Short-Term: Bullish
- Intermediate-Term: Bullish
- Long-Term: Bullish.
Key Insights Summary
CL has staged a sharp V-style recovery from the July 66.50 swing low, restoring price above the rising 5, 10, 20, and 55-day benchmarks. The short-term pivot structure is upward, although the intermediate HiLo structure remains in a downtrend and the 100-day average at 85.57 remains an overhead longer-term trend barrier. August MSFG and weekly grids are positive with price above their F0% areas, while 86.87 is the nearest pivot resistance and 74.24 is the principal swing support beneath the current recovery structure. Small recent bars and moderating ATR indicate the rally is consolidating after a high-velocity rebound rather than accelerating in a broad breakout phase.
View charts on: AlphaWebTrader HTF Charts
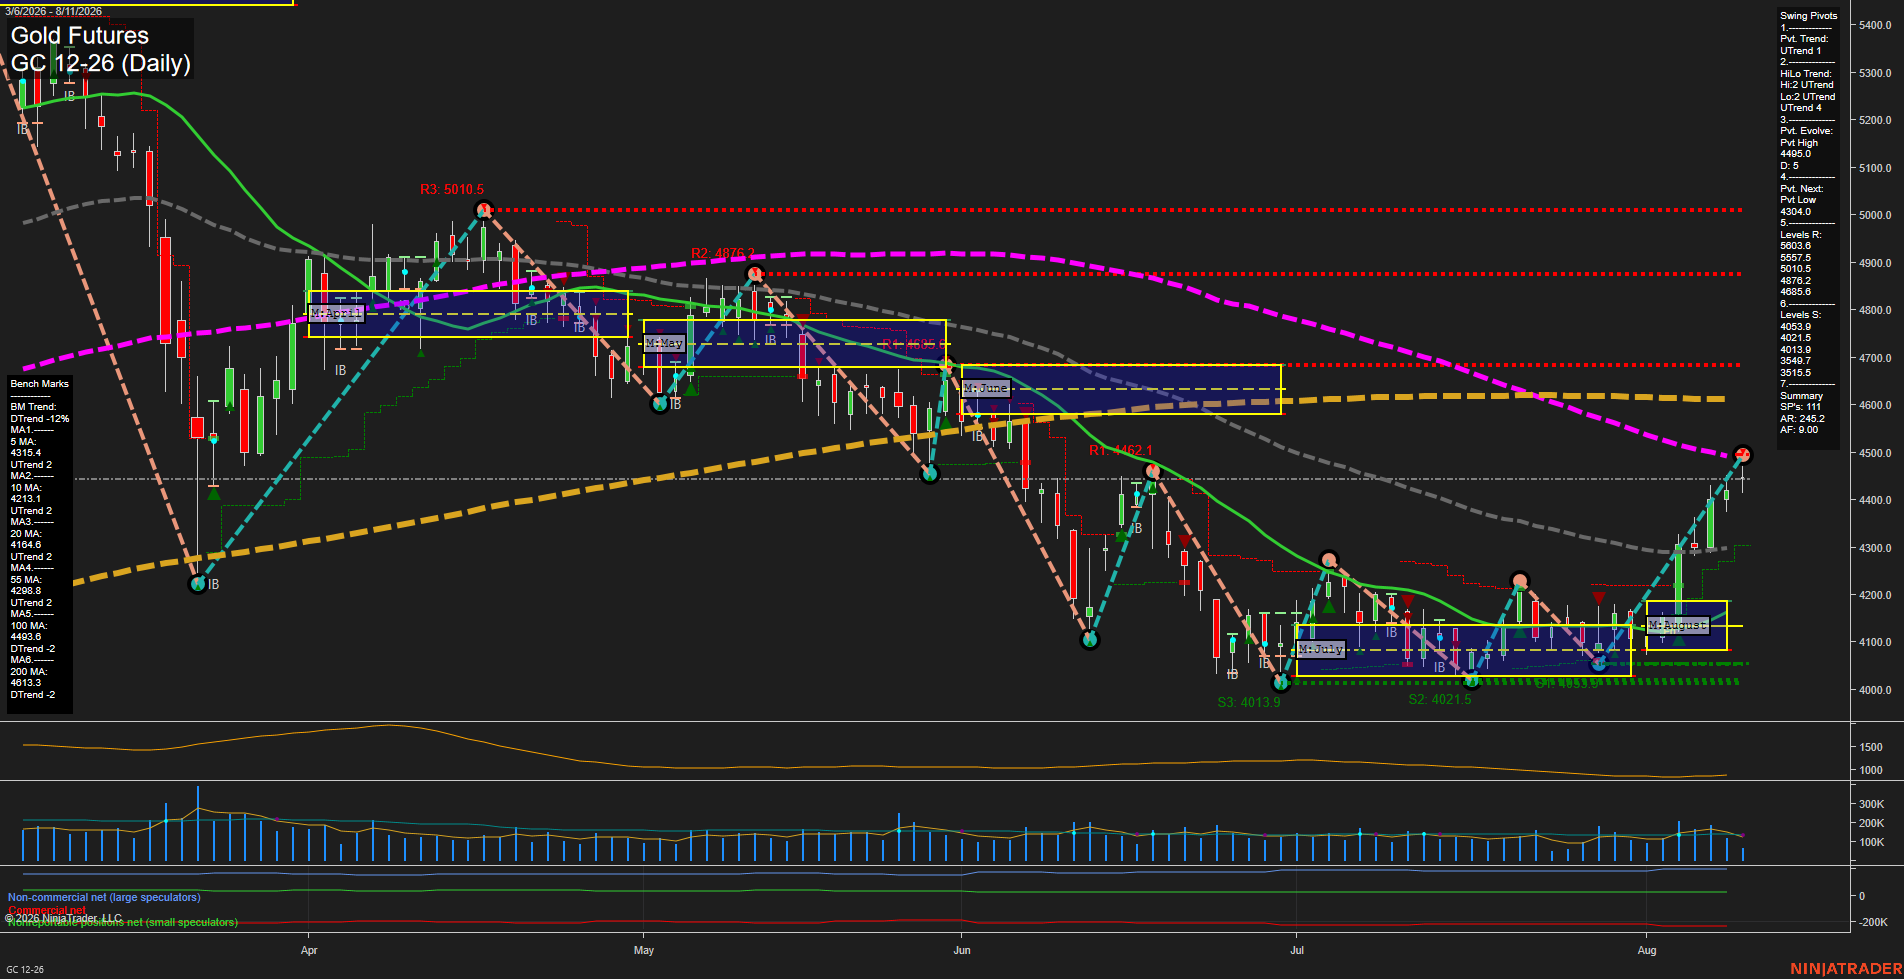
GC Daily View
Overall Rating
- Short-Term: Bullish
- Intermediate-Term: Bullish
- Long-Term: Bearish.
Key Insights Summary
Price has produced a fast V-shaped recovery from the early-August 4,014 area, with higher lows and a sequence of strong expansion bars lifting the short-term pivot structure into an UTrend. The rally has moved above the weekly and monthly fib-grid centers and all short- and intermediate-term benchmarks are rising. Price is now testing the declining 100-day average near 4,494 and remains below the declining 200-day average near 4,613, leaving the broader-year structure counter-trend bearish. The 4,685.6 pivot resistance is the nearest significant overhead swing level, while 4,340.4 is the new pivot-reversal reference and 4,053.9 to 4,013.9 forms the principal support cluster. Elevated ATR and the sharp recovery profile indicate a high-volatility swing phase rather than a mature low-volatility consolidation.
View charts on: AlphaWebTrader HTF Charts