U.S. futures ease as Hormuz tensions lift oil and Treasury yields, while traders assess inflation data, Super Micro earnings and index resistance.
Fundamentals: U.S. index futures were mostly lower as stalled U.S.-Iran talks over the Strait of Hormuz lifted crude prices and added to inflation concerns. Brent neared $90 and U.S. oil topped $84, while Treasury yields rose ahead of key inflation reports. The S&P 500 remained near record levels, with AI investment themes and short positioning providing offsetting equity support.
Technicals: USO led prior-session gains, while Amazon and Microsoft advanced and Nvidia, Apple and IBIT declined. ES, NQ, EMD and FDAX retain broadly bullish multi-timeframe structures as prices test pivot resistance areas. YM and RTY show more mixed short-term conditions, with consolidation and countertrend signals appearing near recent highs.
Pre-Market Trading 360° view Market Radar of: holidays, earnings, eco-news, market-news summary, news sentiment, prior session major ETFs, MAG7, Higher Time Frame Analysis Indices Futures Summary, and E-mini S&P500, Nasdaq 100, NYMEX Crude, Gold Futures Daily Chart analysis.
As of: August 11, 2026 07:16 CT
Earnings Radar
Monitoring for earnings releases by the Magnificent 7, AI-tech-related firms, and major financial institutions.
- SMCI Release: 2026-08-11 T:AMC
Conclusion: Super Micro Computer (SMCI) reports after the close on August 11, placing AI server and semiconductor-infrastructure sentiment in focus for the next index-futures session. Market momentum and volume can slow ahead of this major AI-related tech earnings release.
For full details visit: Yahoo Earnings Calendar
EcoNews Radar U.S. Events
| Day | Time | Impact | Event |
|---|---|---|---|
| Wed | 08:30 | High | Core CPI m/m |
| Wed | 08:30 | High | Core CPI y/y |
| Wed | 08:30 | High | CPI m/m |
| Wed | 08:30 | High | CPI y/y |
| Wed | 10:30 | Low | Crude Oil Inventories |
| Thu | 08:30 | High | Core PPI m/m |
| Thu | 08:30 | High | PPI m/m |
| Thu | 08:30 | Medium | Unemployment Claims |
| Fri | 08:30 | Medium | Core Retail Sales m/m |
| Fri | 08:30 | Medium | Retail Sales m/m |
| Fri | 10:00 | Medium | Prelim UoM Consumer Sentiment |
| Fri | 10:00 | Medium | Prelim UoM Inflation Expectations |
EcoNews Summary
Wednesday’s inflation releases dominate the calendar, with four high-impact Consumer Price Index measures at 08:30. Thursday adds high-impact producer inflation data. Wednesday’s crude oil inventories provide an energy-focused supply update at 10:30.
Event Notes:
- Wednesday 08:30 – USD Core CPI m/m: Measures the monthly change in consumer prices excluding food and energy; monitored for underlying inflation pressure.
- Wednesday 08:30 – USD Core CPI y/y: Measures annual underlying consumer inflation excluding food and energy; monitored for broader inflation trends.
- Wednesday 08:30 – USD CPI m/m: Measures the monthly change in the overall consumer price level; monitored for current inflation momentum.
- Wednesday 08:30 – USD CPI y/y: Measures the annual change in overall consumer prices; monitored as a key broad inflation gauge.
- Wednesday 10:30 – USD Crude Oil Inventories: Measures weekly changes in U.S. crude oil stockpiles; monitored for petroleum supply conditions and energy-price pressure.
- Thursday 08:30 – USD Core PPI m/m: Measures monthly producer-price changes excluding food and energy; monitored for underlying pipeline inflation.
- Thursday 08:30 – USD PPI m/m: Measures the monthly change in prices received by producers; monitored for inflation pressure earlier in the supply chain.
Conclusion:
The single most important event is Wednesday 08:30 USD CPI y/y, alongside the related CPI releases. Market momentum and volume often slow ahead of CPI, with increased volatility at release time. Wednesday’s 10:30 crude inventory report also provides an energy-supply catalyst; news around the 10 AM time cycle acts as a catalyst for reversals or continuations. High oil prices directly affect markets through inflation and geopolitical concerns.
For full details visit: Forex Factory EcoNews
Market News Summary:
Index futures softened as Middle East supply disruption lifted oil, Treasury yields rose, and markets awaited inflation data.
Primary Drivers & Risks:
- Primary Driver: Hormuz tensions lift oil prices
- Primary Risk: Inflation pressure and higher yields
Tone:
Cautious, with energy-driven inflation concerns offsetting equity resilience.
Stock Market / ETFs / Indices:
U.S. futures were mostly lower after all three major indexes declined Monday. The S&P 500 remained near record highs, while short positioning and AI-capex themes continued to support bullish equity narratives. Intel’s planned $15 billion common-stock offering added a company-specific equity-supply concern.
Geopolitical:
U.S.-Iran negotiations remained deadlocked over reopening the Strait of Hormuz, with compensation demands adding friction. The U.S. stated it had cleared mines and controlled the waterway, but the impasse continued to weigh on risk sentiment.
Oil / Energy:
Brent approached $90 and U.S. oil topped $84 as hopes for a near-term Hormuz reopening faded. Refinery disruptions, reduced refined-product availability, and a Strategic Petroleum Reserve below 300 million barrels reinforced supply concerns.
Gold / Metals:
Gold moved back toward $4,400 per ounce, supported by lower real yields, easing Fed expectations, central-bank buying, and improved market flows. Barrick Mining released its second-quarter earnings-call transcript.
Fed / Financials:
Upcoming inflation reports were central to whether the Federal Reserve raises rates in September or extends its pause. Treasury yields rose alongside oil prices, while JPMorgan reported corporate-bank revenue growth above 20% in Asia Pacific.
Macro / Other:
U.S. small-business optimism rose to 99.8, its highest reading since August 2025. The yen strengthened modestly amid discussion of coordinated Japan-U.S. currency intervention.
Conclusion:
Hormuz-related oil supply risk and the inflation-data calendar were the main near-term index-futures drivers. Higher crude prices coincided with rising Treasury yields and softer U.S. futures.
Record-level S&P 500 conditions, persistent short positioning, and AI investment themes provided equity support. The Middle East deadlock, refinery tightness, and inflation-sensitive rate expectations remained important cross-currents.
Market News Sentiment
Market News Articles: 41
- Neutral: 56.10%
- Positive: 29.27%
- Negative: 14.63%
Sentiment Summary: Of 41 market news articles, 56% were neutral, 29% positive, and 15% negative.
Conclusion: News sentiment is predominantly neutral, with positive coverage exceeding negative coverage.
GLD,Gold Articles: 7
- Positive: 85.71%
- Neutral: 14.29%
Sentiment Summary: GLD/Gold coverage is 86% positive and 14% neutral across 7 articles, indicating predominantly favorable tone.
Conclusion: Gold-related news sentiment is positive, with no negative articles in the snapshot.
USO,Oil Articles: 18
- Negative: 50.00%
- Positive: 27.78%
- Neutral: 22.22%
Sentiment Summary: USO and oil coverage is predominantly negative, with 50% negative, 28% positive, and 22% neutral articles across 18 reports.
Conclusion: Oil-related news flow presents a net-negative sentiment backdrop for indices futures day traders.
Market Data Snapshot
ETF Snapshot of major stock market ETFs, Mag7, and others as of: August 11, 2026 07:16
Top Movers & Losers
- USO 125.92 Bullish 6.73% ▲
- AMZN 278.09 Bullish 1.32% ▲
- MSFT 506.06 Bullish 1.21% ▲
- IBIT 36.23 Bearish -1.55% ▼
- AAPL 308.26 Bearish -1.62% ▼
- NVDA 217.55 Bearish -2.86% ▼
Major Index ETFs: SPY, QQQ, DIA, IWM, IJH
- SPY 773.03 Bearish -0.03% ▼
- DIA 538.99 Bearish -0.12% ▼
- QQQ 720.87 Bearish -0.30% ▼
- IJH 77.54 Bearish -0.32% ▼
- IWM 299.98 Bearish -0.52% ▼
Major index ETFs are Bearish across the group. IWM is the most bearish mover at -0.52%, followed by IJH at -0.32% and QQQ at -0.30%. DIA is down -0.12%, while SPY is the least negative mover and near-flat at -0.03%.
Mag 7 Stocks: AAPL, MSFT, GOOG, AMZN, META, NVDA, TSLA
- AMZN 278.09 Bullish 1.32% ▲
- MSFT 506.06 Bullish 1.21% ▲
- TSLA 330.88 Bullish 0.70% ▲
- GOOG 355.84 Bullish 0.67% ▲
- META 594.92 Bullish 0.48% ▲
- AAPL 308.26 Bearish -1.62% ▼
- NVDA 217.55 Bearish -2.86% ▼
Mixed: AMZN is the most bullish mover at +1.32%, followed by MSFT at +1.21%. TSLA, GOOG, and META are Bullish at +0.70%, +0.67%, and +0.48%. NVDA is the most bearish mover at -2.86%, while AAPL is Bearish at -1.62%.
Cross-Market ETFs: TLT, GLD, USO, IBIT
- USO 125.92 Bullish 6.73% ▲
- GLD 402.54 Bullish 1.02% ▲
- TLT 82.06 Bearish -0.85% ▼
- IBIT 36.23 Bearish -1.55% ▼
Mixed cross-market context: USO is the most bullish mover at +6.73%, with GLD also Bullish at +1.02%. IBIT is the most bearish mover at -1.55%, while TLT is Bearish at -0.85%.
ETF, Mag7, and Cross-Market ETF Insights
Overall Tone
Mixed: Mag7 strength is selective while major equity ETFs are modestly Bearish, alongside strong oil gains and weakness in bonds and bitcoin.
Equity ETFs and Mag7:
Major Index ETFs are broadly Bearish but relatively contained: SPY is marginal at -0.03%, DIA is -0.12%, QQQ is -0.30%, IJH is -0.32%, and IWM lags at -0.52%. Mag7 action is Mixed, led by AMZN at +1.32% and MSFT at +1.21%, while AAPL is down -1.62% and NVDA is the most bearish equity mover at -2.86%. GOOG gains +0.67%, TSLA rises +0.70%, and META adds +0.48%, showing selective leadership rather than broad equity alignment.
Cross-Market ETFs:
Cross-market ETFs are Mixed, with USO the most bullish mover at +6.73% and GLD also Bullish at +1.02%. TLT is Bearish at -0.85%, while IBIT is the most bearish cross-market mover at -1.55%. Oil and gold strength diverge from the modestly Bearish equity ETF complex, while bond and bitcoin weakness remain evident.
Futures Indices – Higher Time Frame Analysis
Summary of the current state of US Indices Futures based on higher time-frame (HTF) technical analysis as of: 2026-08-11: 07:16 CT.
US Indices Futures
- ES YSFG/MSFG/WSFG above F0%/NTZ, rising benchmarks, UTrend pivots; 7820.25 resistance, 7617.75 reversal, 7571.75/7514.75 support.
- NQ MSFG/YSFG above F0%, WSFG marginally below; rising benchmarks and pivots; 30074-30109 resistance, 28621.50 reversal.
- YM MSFG/YSFG above F0%, WSFG below; rising benchmarks and upward pivots; 54384-54884 resistance, 53402 reversal, 51630 support.
- EMD MSFG/YSFG above F0%, WSFG neutral; rising benchmarks, UTrend pivots; 3900.0-3906.8 resistance, 3789.8 reversal, 3730.5-3724.0 support.
- RTY MSFG/YSFG above F0%, WSFG below; rising benchmarks and upward pivots; 3053.8-3068.4 resistance, 2902.3/2828.1 support.
- FDAX MSFG/YSFG above F0%, rising benchmarks and UTrend pivots; 26527 resistance, 25885 reversal, 24923 and 24715 support.
Overall State
- Short-Term: Neutral
- Intermediate-Term: Bullish
- Long-Term: Bullish
Conclusion
Intermediate- and long-term directional correlation remains bullish across all contracts: MSFG and YSFG positioning, rising benchmark averages, and higher pivot structures remain aligned. ES, EMD, and FDAX retain bullish short-term ratings; NQ, YM, and RTY have neutral short-term conditions from WSFG compression or decline near pivot-high resistance. All markets are testing or consolidating near defined swing-pivot ceilings, with recent short signals in YM, RTY, EMD, and FDAX contrasting with broader benchmark and pivot alignment.
Note: Intra-day counter-trend pullbacks or retracements may occur, HTF is context for informational usage and market structure. Glossary: Session Fib Grids periods of YSFG:’Yearly’, MSFG:’Monthly’, WSFG:’Weekly’
For full details visit: AlphaWebTrader Technicals
ES Daily View
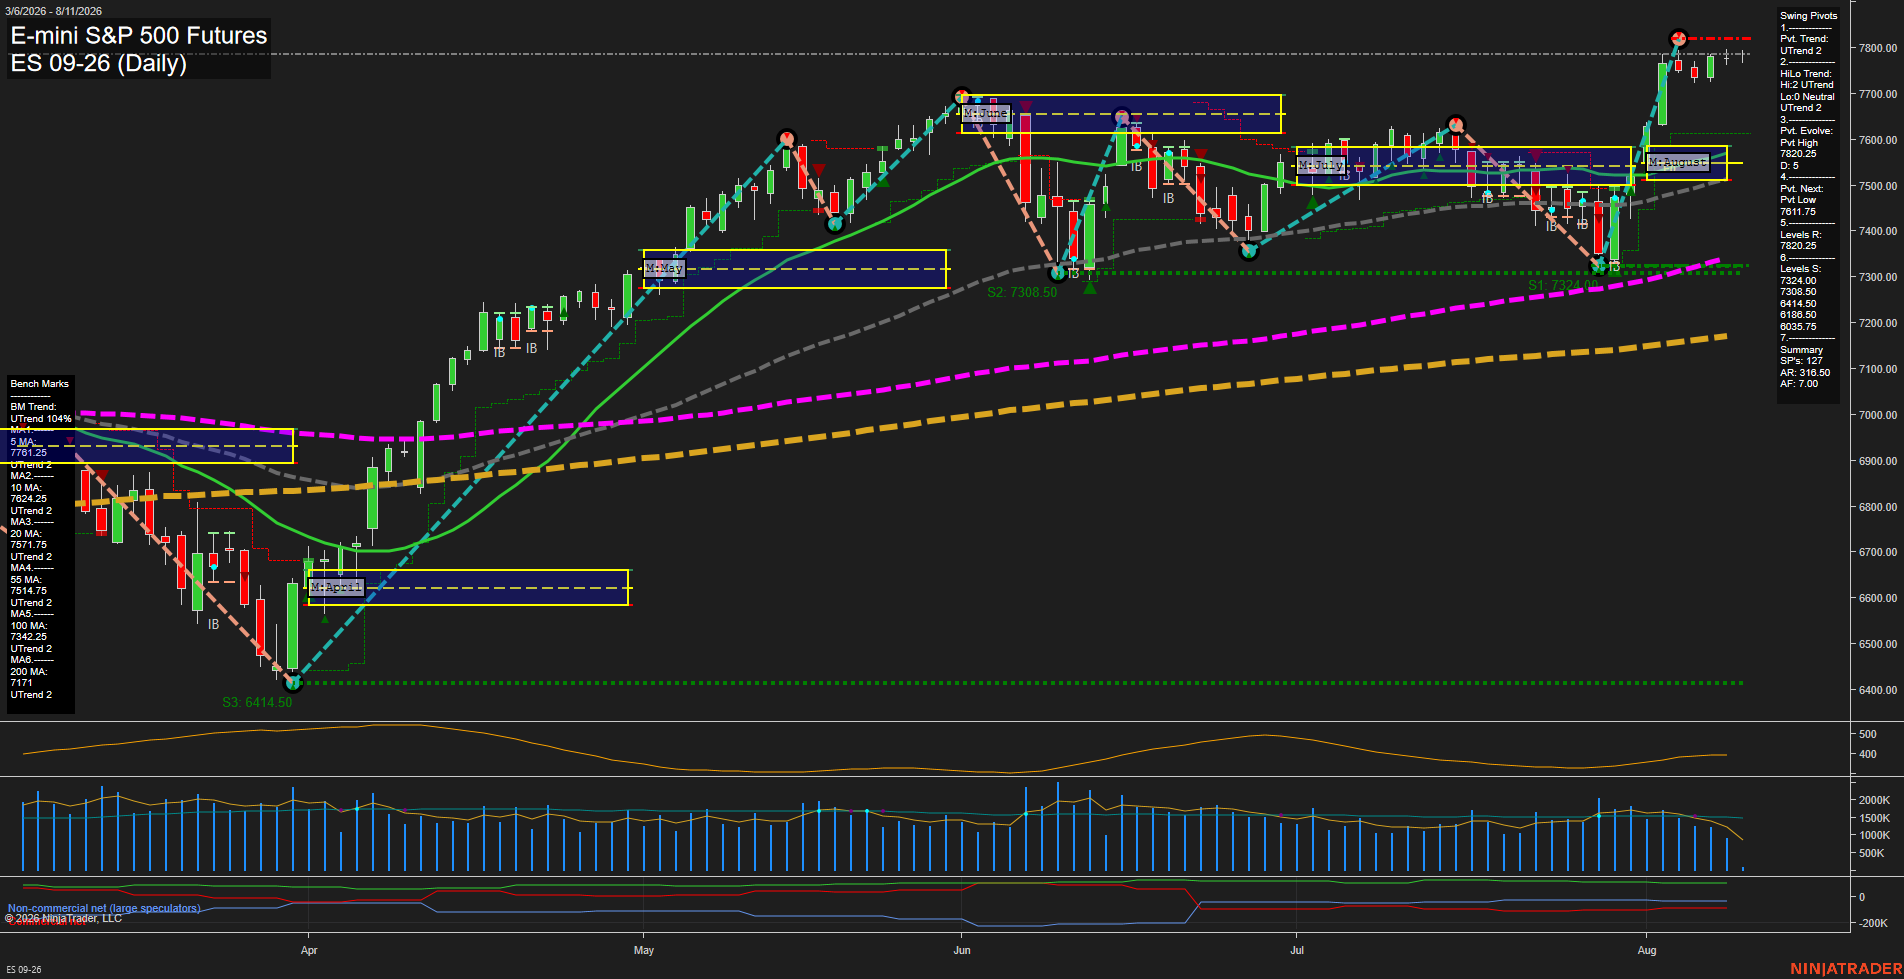
Overall Rating
- Short-Term: Bullish
- Intermediate-Term: Bullish
- Long-Term: Bullish.
Key Insights Summary
The daily structure remains broadly bullish: price is above every benchmark average, all benchmark trends are rising, and both the short-term pivot and intermediate HiLo pivot trends are UTrend. The August advance produced a sharp V-shaped recovery from the 7308-7332 support area and carried ES back to the 7820.25 pivot resistance zone. Recent small candles beneath that high indicate consolidation following a fast momentum leg rather than a completed bearish reversal. Weekly, monthly, and yearly Fib-grid positioning remains above their F0%/NTZ reference areas, supporting alignment across the short-, intermediate-, and long-term trend frames. The 7820.25 swing high is the immediate overhead technical boundary, while 7617.75 is the defined short-term pivot reversal level; the 7571.75 20-day and 7514.75 55-day averages form the next intermediate trend-reference area below.
View charts on: AlphaWebTrader HTF Charts
NQ Daily View
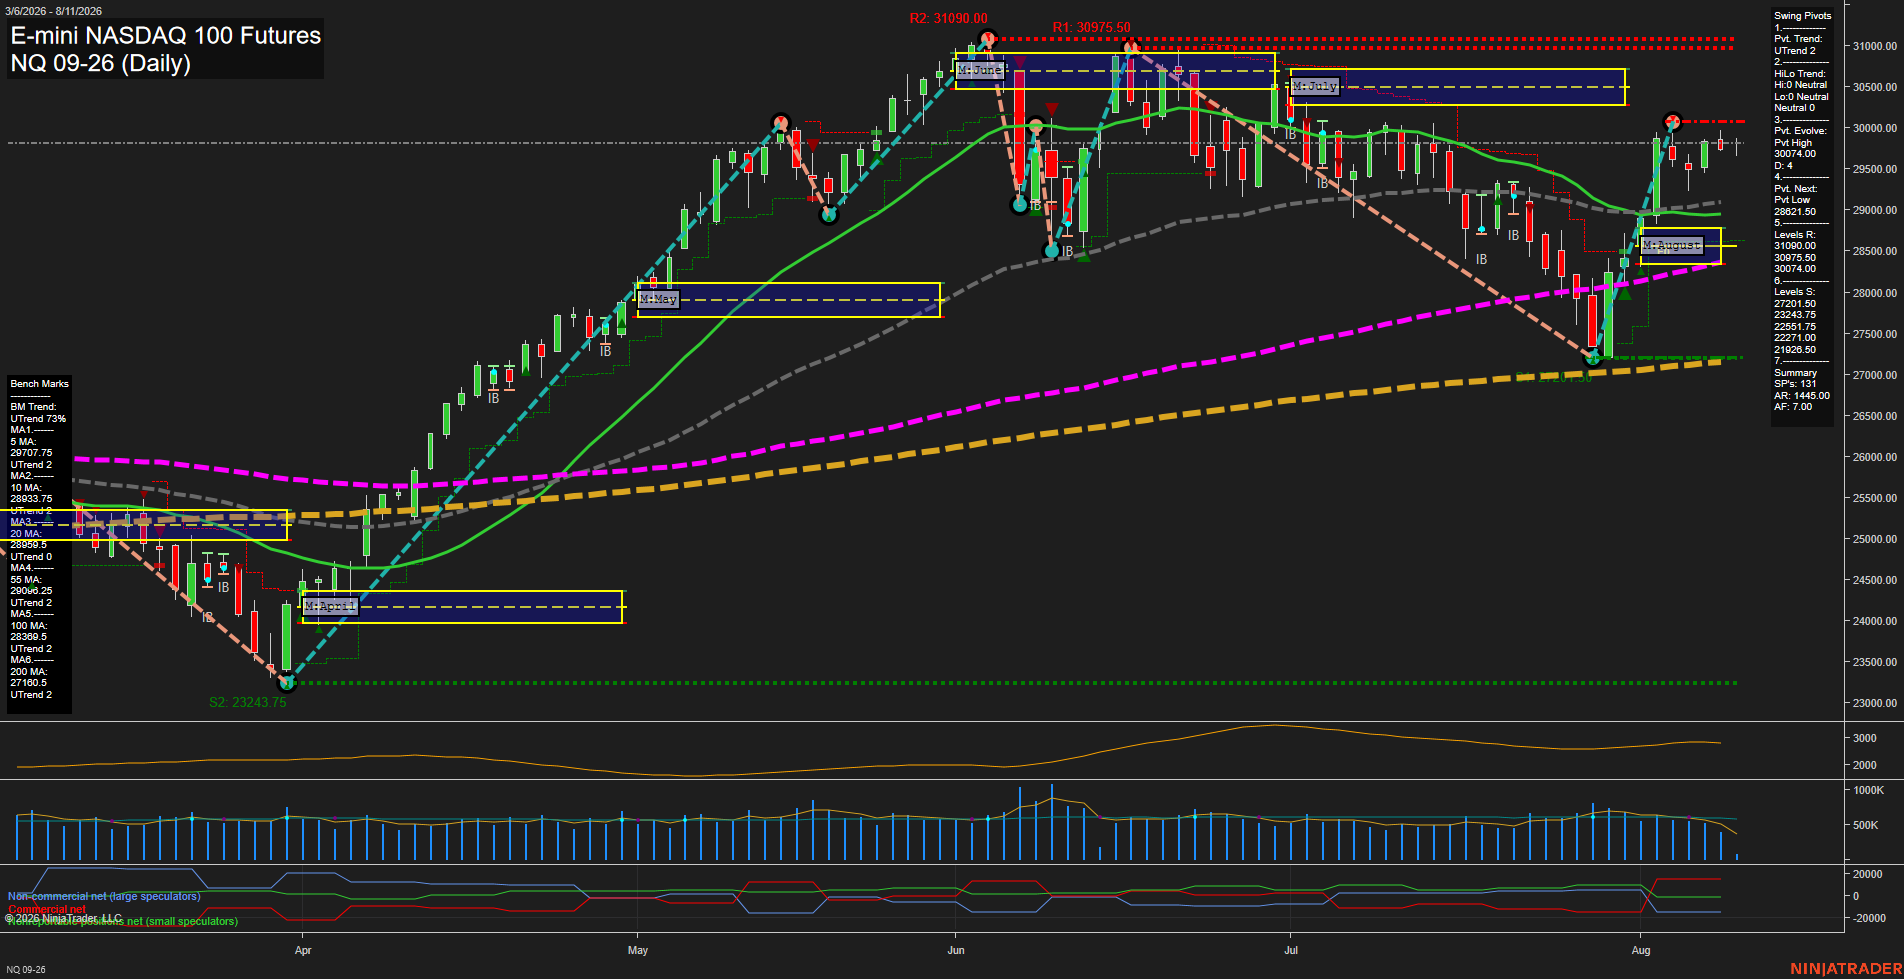
Overall Rating
- Short-Term: Neutral
- Intermediate-Term: Bullish
- Long-Term: Bullish.
Key Insights Summary
Price has staged a sharp V-recovery from the late-July low near 27200 and is consolidating immediately beneath the 30074 swing-high pivot. The short-term pivot structure remains upward and price is above all benchmark averages, but the weekly fib position is marginally below F0%, reflecting near-term compression after the recovery surge. Intermediate and long-term conditions remain constructive, supported by rising 20-, 55-, 100-, and 200-day benchmarks, positive monthly and yearly fib-grid positions, and recent long-direction system signals. The 30074 pivot is the immediate structural ceiling, with 30975.50 and 31090 marking the higher resistance band; the 28621.50 pivot-next level defines the major reversal threshold within the current upswing.
View charts on: AlphaWebTrader HTF Charts
CL Daily View
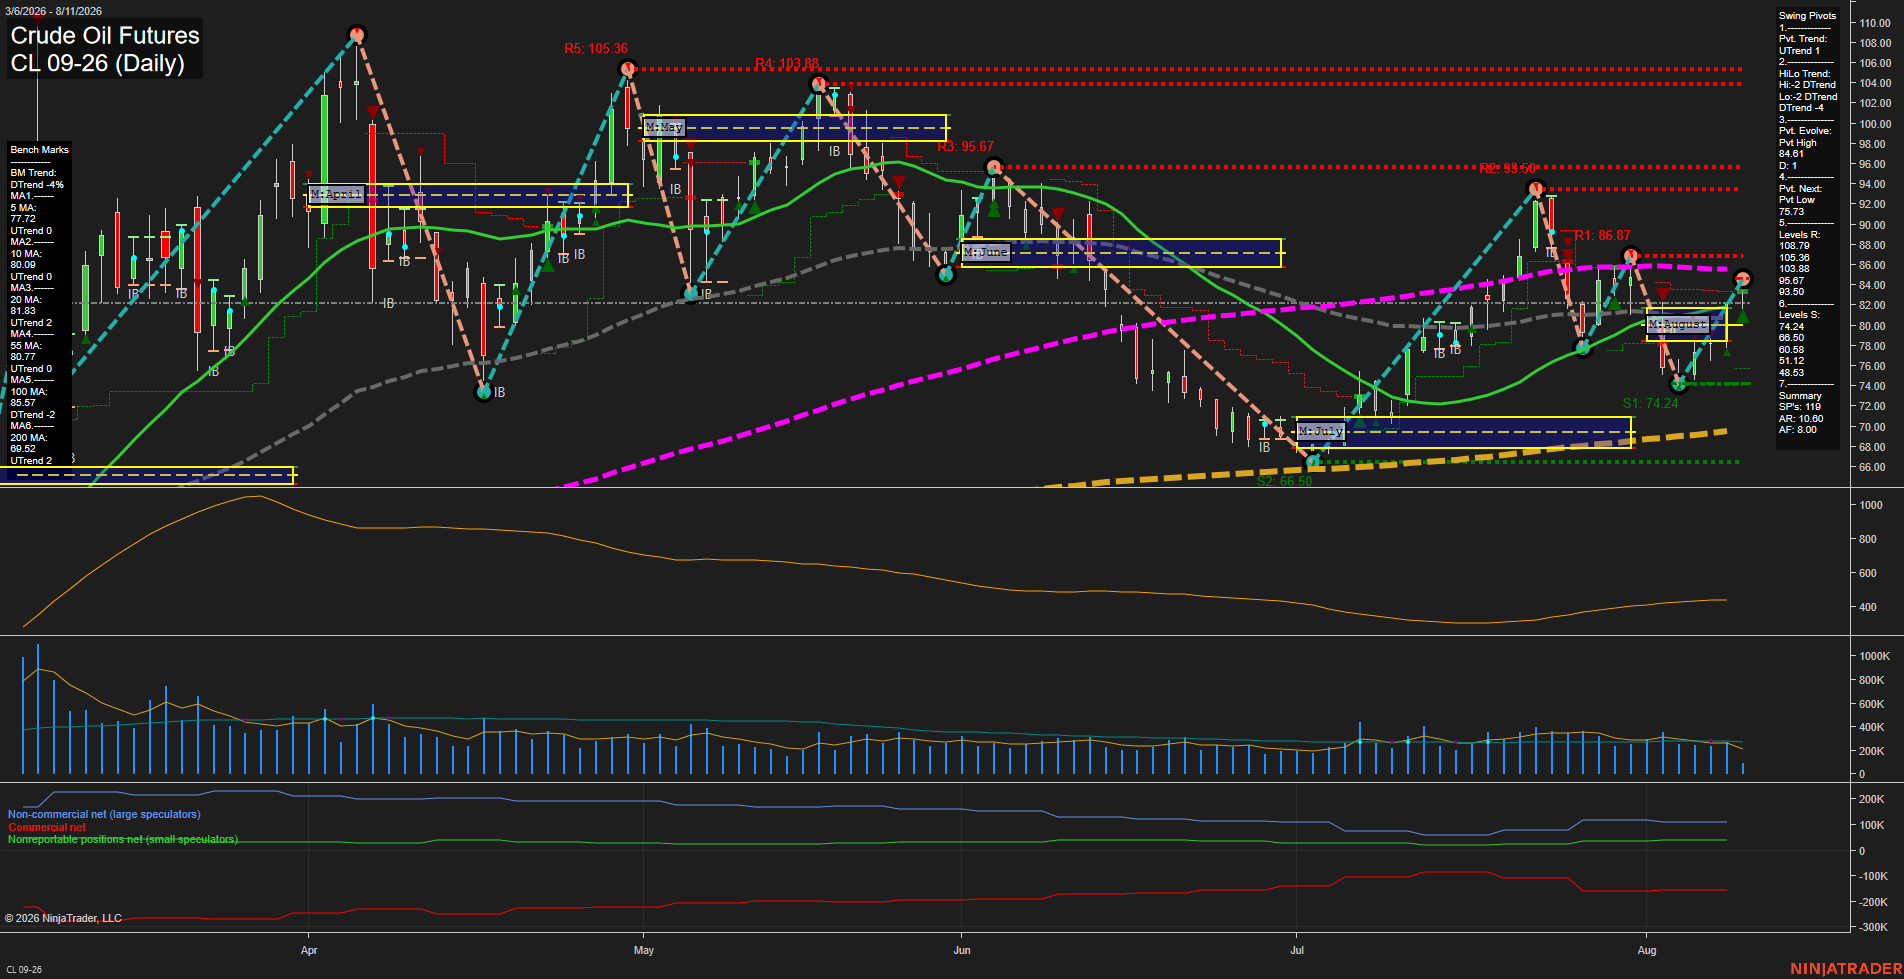
Overall Rating
- Short-Term: Bullish
- Intermediate-Term: Bullish
- Long-Term: Bullish.
Key Insights Summary
CL has staged a sharp V-style recovery from the July 66.50 swing low, restoring price above the rising 5, 10, 20, and 55-day benchmarks. The short-term pivot structure is upward, although the intermediate HiLo structure remains in a downtrend and the 100-day average at 85.57 remains an overhead longer-term trend barrier. August MSFG and weekly grids are positive with price above their F0% areas, while 86.87 is the nearest pivot resistance and 74.24 is the principal swing support beneath the current recovery structure. Small recent bars and moderating ATR indicate the rally is consolidating after a high-velocity rebound rather than accelerating in a broad breakout phase.
View charts on: AlphaWebTrader HTF Charts
GC Daily View
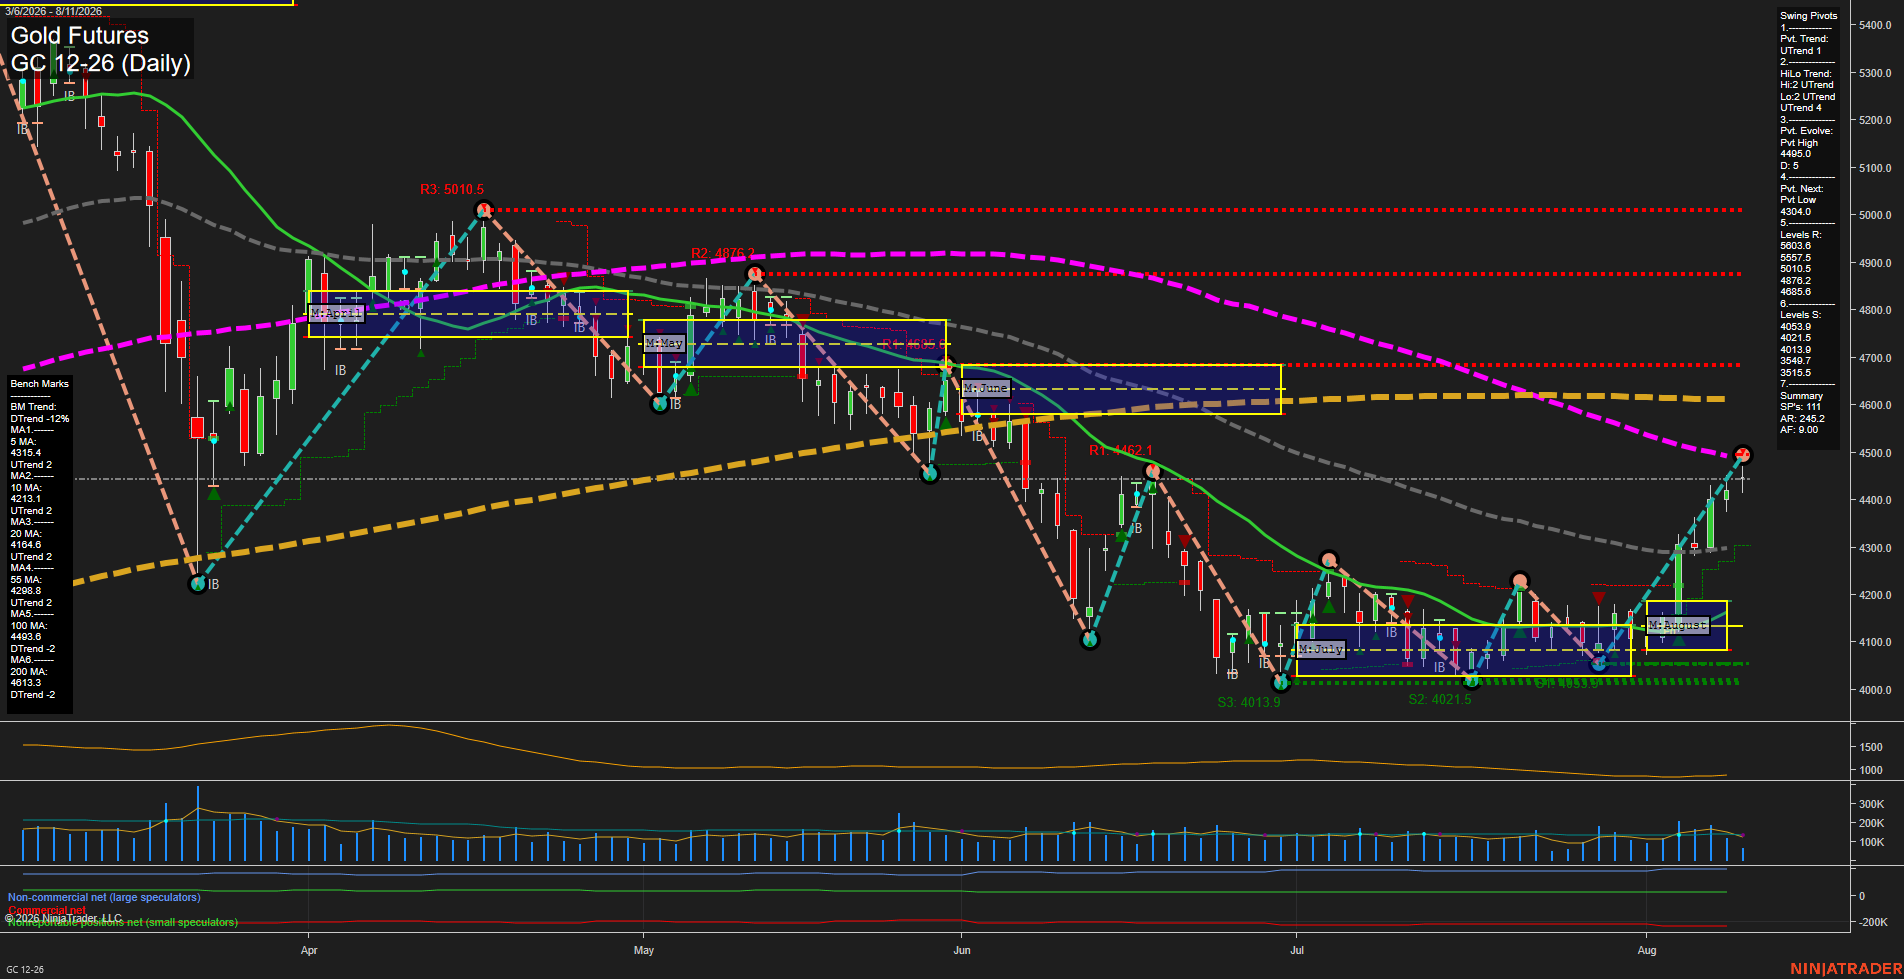
Overall Rating
- Short-Term: Bullish
- Intermediate-Term: Bullish
- Long-Term: Bearish.
Key Insights Summary
Price has produced a fast V-shaped recovery from the early-August 4,014 area, with higher lows and a sequence of strong expansion bars lifting the short-term pivot structure into an UTrend. The rally has moved above the weekly and monthly fib-grid centers and all short- and intermediate-term benchmarks are rising. Price is now testing the declining 100-day average near 4,494 and remains below the declining 200-day average near 4,613, leaving the broader-year structure counter-trend bearish. The 4,685.6 pivot resistance is the nearest significant overhead swing level, while 4,340.4 is the new pivot-reversal reference and 4,053.9 to 4,013.9 forms the principal support cluster. Elevated ATR and the sharp recovery profile indicate a high-volatility swing phase rather than a mature low-volatility consolidation.
View charts on: AlphaWebTrader HTF Charts