NYSE pre-market radar tracks CPI, Treasury yields and Fed policy as futures hold broad bullish trends amid earnings, ETF moves, oil and shipping risks.
Fundamentals: U.S. CPI data is the central focus for NYSE pre-market trading, with investors assessing its implications for Fed policy, Treasury yields and the dollar. Strong earnings and raised technology guidance provide support, while softer equity sentiment, AI valuation concerns and Middle East shipping disruptions add uncertainty. Oil-demand revisions, Hormuz constraints and yen weakness remain key cross-market factors.
Technicals: U.S. futures enter the NYSE pre-market session with broad intermediate- and long-term bullish structures across major contracts, while several markets consolidate near pivot resistance. ES, NQ and EMD retain constructive alignment, whereas YM shows a short-term pullback tone. ETF activity featured gains in USO, Meta and Tesla and declines in Apple, Amazon and Alphabet.
Pre-Market Trading 360° view Market Radar of: holidays, earnings, eco-news, market-news summary, news sentiment, prior session major ETFs, MAG7, Higher Time Frame Analysis Indices Futures Summary, and E-mini S&P500, Nasdaq 100, NYMEX Crude, Gold Futures Daily Chart analysis.
As of: August 12, 2026 07:16 CT
EcoNews Radar U.S. Events
| Day | Time | Impact | Event |
|---|---|---|---|
| Wed | 08:30 | High | Core CPI m/m |
| Wed | 08:30 | High | Core CPI y/y |
| Wed | 08:30 | High | CPI m/m |
| Wed | 08:30 | High | CPI y/y |
| Wed | 10:30 | Low | Crude Oil Inventories |
| Thu | 08:30 | High | Core PPI m/m |
| Thu | 08:30 | High | PPI m/m |
| Thu | 08:30 | Medium | Unemployment Claims |
| Fri | 08:30 | Medium | Core Retail Sales m/m |
| Fri | 08:30 | Medium | Retail Sales m/m |
| Fri | 10:00 | Medium | Prelim UoM Consumer Sentiment |
| Fri | 10:00 | Medium | Prelim UoM Inflation Expectations |
EcoNews Summary
Wednesday and Thursday contain the week’s qualifying high-impact U.S. inflation releases. Wednesday’s consumer inflation data and Thursday’s producer inflation data provide key readings on price pressures, with broad relevance for index futures and interest-rate-sensitive sectors. Market momentum and volume often slow ahead of major events such as CPI, with increased volatility at release time.
Event Notes:
- Wednesday 08:30 – USD Core CPI m/m and y/y: Measures monthly and annual consumer-price changes excluding food and energy. Traders monitor core inflation for underlying price-pressure trends.
- Wednesday 08:30 – USD CPI m/m and y/y: Measures monthly and annual changes in consumer prices across a broad basket of goods and services. Traders monitor it as a major inflation indicator with broad market relevance.
- Thursday 08:30 – USD Core PPI m/m: Measures monthly producer-price changes excluding food and energy. Traders monitor it for underlying pipeline inflation pressures.
- Thursday 08:30 – USD PPI m/m: Measures monthly changes in prices received by producers. Traders monitor it for inflation trends earlier in the supply chain.
Conclusion:
The single most important event of the week is Wednesday at 08:30, the USD CPI release. Its core and headline readings provide the week’s central consumer-inflation data point, followed by Thursday’s producer-inflation releases for additional price-pressure context.
For full details visit: Forex Factory EcoNews
Market News Summary:
U.S. inflation data is the immediate market focus amid strong earnings, softer equity sentiment, and escalating Middle East shipping disruptions.
Primary Drivers & Risks:
- Primary Driver: U.S. CPI and Fed path
- Primary Risk: Middle East shipping disruption
Tone:
Cautious and mixed, with inflation and geopolitical risks offsetting earnings strength.
Stock Market / ETFs / Indices:
The S&P 500 fell for a second session before the inflation report, while sentiment declined but remained in the “Greed” zone. Earnings results remain broadly strong: 77% of reporting companies exceeded EPS estimates, and nearly one-third of technology companies raised guidance. Technology exposure and AI valuation concerns remain prominent cross-currents.
Geopolitical:
Houthi attacks in the Bab el-Mandeb Strait killed six people, while U.S. forces struck a vessel connected to the Iran blockade. The incidents intensified concerns over a wider Middle East escalation and disruption to maritime trade routes.
Oil / Energy:
The IEA said a Hormuz closure and shipping constraints are depleting oil inventories and worsening oil-demand destruction, projecting a 1.6 million-barrel-per-day decline in 2026 demand. OPEC also cut its 2026 global oil-demand-growth forecast for a fourth consecutive month, to 580,000 barrels per day.
Gold / Metals:
Gold and silver remained firm as traders weighed CPI, Fed policy, geopolitical tensions, Hormuz risks, and central-bank demand. CPI is identified as a key near-term catalyst for gold price direction.
Fed / Financials:
Treasury yields and the dollar held steady ahead of CPI. Goldman Sachs’ chief economist does not see a Fed rate hike this year, while other coverage framed the report as determining whether officials retain patience or consider tighter policy; Japanese yen weakness near 160 per dollar also remains a market risk.
Macro / Other:
Asian currencies consolidated against the dollar before CPI. Japan’s rising government-bond yields are drawing domestic retail interest, while the yen’s continued decline highlights currency-market stress.
Conclusion:
U.S. CPI and its implications for Fed policy are the central near-term drivers for index futures. Strong Q2 earnings and raised technology guidance provide an offsetting equity-supportive backdrop.
Middle East shipping attacks, the Hormuz impasse, and oil-market disruptions raise geopolitical and inflation-related risks. Falling oil-demand projections, yen weakness, and AI-bubble concerns add conflicting signals across macro and risk assets.
Market News Sentiment
Market News Articles: 39
- Neutral: 53.85%
- Positive: 25.64%
- Negative: 20.51%
Sentiment Summary: Of 39 market news articles, 54% were neutral, 26% positive, and 21% negative.
Conclusion: Coverage was predominantly neutral, with positive articles modestly outnumbering negative articles.
GLD,Gold Articles: 12
- Negative: 41.67%
- Positive: 33.33%
- Neutral: 25.00%
Sentiment Summary: GLD and gold coverage is mixed to negative, with 42% negative, 33% positive, and 25% neutral articles.
Conclusion: Gold-related news tone may represent a modest risk-sensitive backdrop for indices futures day traders.
USO,Oil Articles: 13
- Positive: 53.85%
- Negative: 30.77%
- Neutral: 15.38%
Sentiment Summary: USO/Oil coverage is moderately positive, with 54% positive, 31% negative, and 15% neutral articles across 13 items.
Conclusion: Oil-related news tone is positive overall, though a meaningful share of negative coverage remains relevant for indices futures monitoring.
Market Data Snapshot
ETF Snapshot of major stock market ETFs, Mag7, and others as of: August 12, 2026 07:16
Top Movers & Losers
- USO 127.61 Bullish 1.34% ▲
- META 599.12 Bullish 0.71% ▲
- TSLA 332.81 Bullish 0.58% ▲
- AAPL 304.91 Bearish -1.09% ▼
- AMZN 272.27 Bearish -2.09% ▼
- GOOG 343.00 Bearish -3.61% ▼
Major Index ETFs: SPY, QQQ, DIA, IWM, IJH
- IWM 300.99 Bullish 0.34% ▲
- IJH 77.77 Bullish 0.30% ▲
- DIA 537.28 Bearish -0.32% ▼
- SPY 770.56 Bearish -0.32% ▼
- QQQ 718.45 Bearish -0.34% ▼
Mixed index ETF snapshot: IWM is the most bullish mover at +0.34%, followed by IJH at +0.30%. QQQ is the most bearish mover at -0.34%, while SPY and DIA both decline -0.32%.
Mag 7 Stocks: AAPL, MSFT, GOOG, AMZN, META, NVDA, TSLA
- META 599.12 Bullish 0.71% ▲
- TSLA 332.81 Bullish 0.58% ▲
- NVDA 217.50 Bearish -0.02% ▼
- MSFT 503.81 Bearish -0.44% ▼
- AAPL 304.91 Bearish -1.09% ▼
- AMZN 272.27 Bearish -2.09% ▼
- GOOG 343.00 Bearish -3.61% ▼
Mixed: META is the most bullish mover at +0.71%, followed by TSLA at +0.58%. GOOG is the most bearish mover at -3.61%, with AMZN also Bearish at -2.09%; NVDA is marginally Bearish at -0.02%.
Cross-Market ETFs: TLT, GLD, USO, IBIT
- USO 127.61 Bullish 1.34% ▲
- TLT 82.19 Bullish 0.16% ▲
- GLD 400.96 Bearish -0.39% ▼
- IBIT 35.94 Bearish -0.80% ▼
Mixed cross-market snapshot: USO is the most bullish mover at +1.34%, while TLT is marginally Bullish at +0.16%. IBIT is the most bearish mover at -0.80%, with GLD also Bearish at -0.39%.
ETF, Mag7, and Cross-Market ETF Insights
Overall Tone
Mixed tone: small-cap and mid-cap ETFs were Bullish while major index ETFs and most Mag7 names were Bearish, alongside strong oil and weaker gold and bitcoin exposure.
Equity ETFs and Mag7:
IWM +0.34% and IJH +0.30% were Bullish, while SPY -0.32%, DIA -0.32%, and QQQ -0.34% were modestly Bearish, showing selective rather than broad equity alignment. META +0.71% was the most bullish Mag7 mover, followed by TSLA +0.58%, while NVDA -0.02% was marginally Bearish. GOOG -3.61% was the most bearish mover across equities and Mag7, with AMZN -2.09% and AAPL -1.09% also Bearish.
Cross-Market ETFs:
USO +1.34% was the most bullish cross-market mover, indicating commodity strength, while TLT +0.16% was modestly Bullish. GLD -0.39% was Bearish and IBIT -0.80% was the most bearish cross-market mover. The cross-market picture was Mixed, with oil strength diverging from weaker gold and bitcoin exposure.
Futures Indices – Higher Time Frame Analysis
Summary of the current state of US Indices Futures based on higher time-frame (HTF) technical analysis as of: 2026-08-12: 07:16 CT.
US Indices Futures
- ES YSFG/MSFG up, WSFG below F0%, benchmarks rising, pivot resistance 7820.25, downside pivot 7617.25; weekly short signal contrasts broader bullish structure.
- NQ YSFG/MSFG up, WSFG neutral at F0%, benchmarks rising, resistance 30074 then 30975.50–31090, pivot reversal reference 28689.
- YM YSFG/MSFG up, WSFG below F0%, benchmarks rising, high pivot 54384–54884 resistance, downside references 53470 and 52402; weekly countertrend structure.
- EMD YSFG/MSFG/WSFG up, benchmarks rising, pivot resistance 3914.8, reversal reference 3804.8, deeper support 3730.5–3692.9; WSFG long aligns with advance.
- RTY YSFG/MSFG/WSFG up, benchmarks rising, resistance 3053.8–3068.4, pivot reversal 2857.8, deeper support 2429.8–2357.1; weekly short signal near highs.
- FDAX YSFG/MSFG/WSFG above F0%, benchmarks rising, new pivot highs 26613–26618, opposite pivot support 25992–25008; WSFG and MSFG long alignment.
Overall State
- Short-Term: Neutral
- Intermediate-Term: Bullish
- Long-Term: Bullish
Conclusion
Intermediate- and long-term correlations remain upward across all six indices, supported by rising benchmark stacks, YSFG/MSFG alignment, and higher-high/higher-low pivot structures. EMD, RTY, and FDAX retain aligned WSFG strength near pivot highs. ES and NQ are compressing beneath resistance, while YM and selected weekly WSFG readings reflect countertrend rotation. Primary resistance remains at active pivot highs; stated pivot-next levels define structural support references.
Note: Intra-day counter-trend pullbacks or retracements may occur, HTF is context for informational usage and market structure. Glossary: Session Fib Grids periods of YSFG:’Yearly’, MSFG:’Monthly’, WSFG:’Weekly’
For full details visit: AlphaWebTrader Technicals
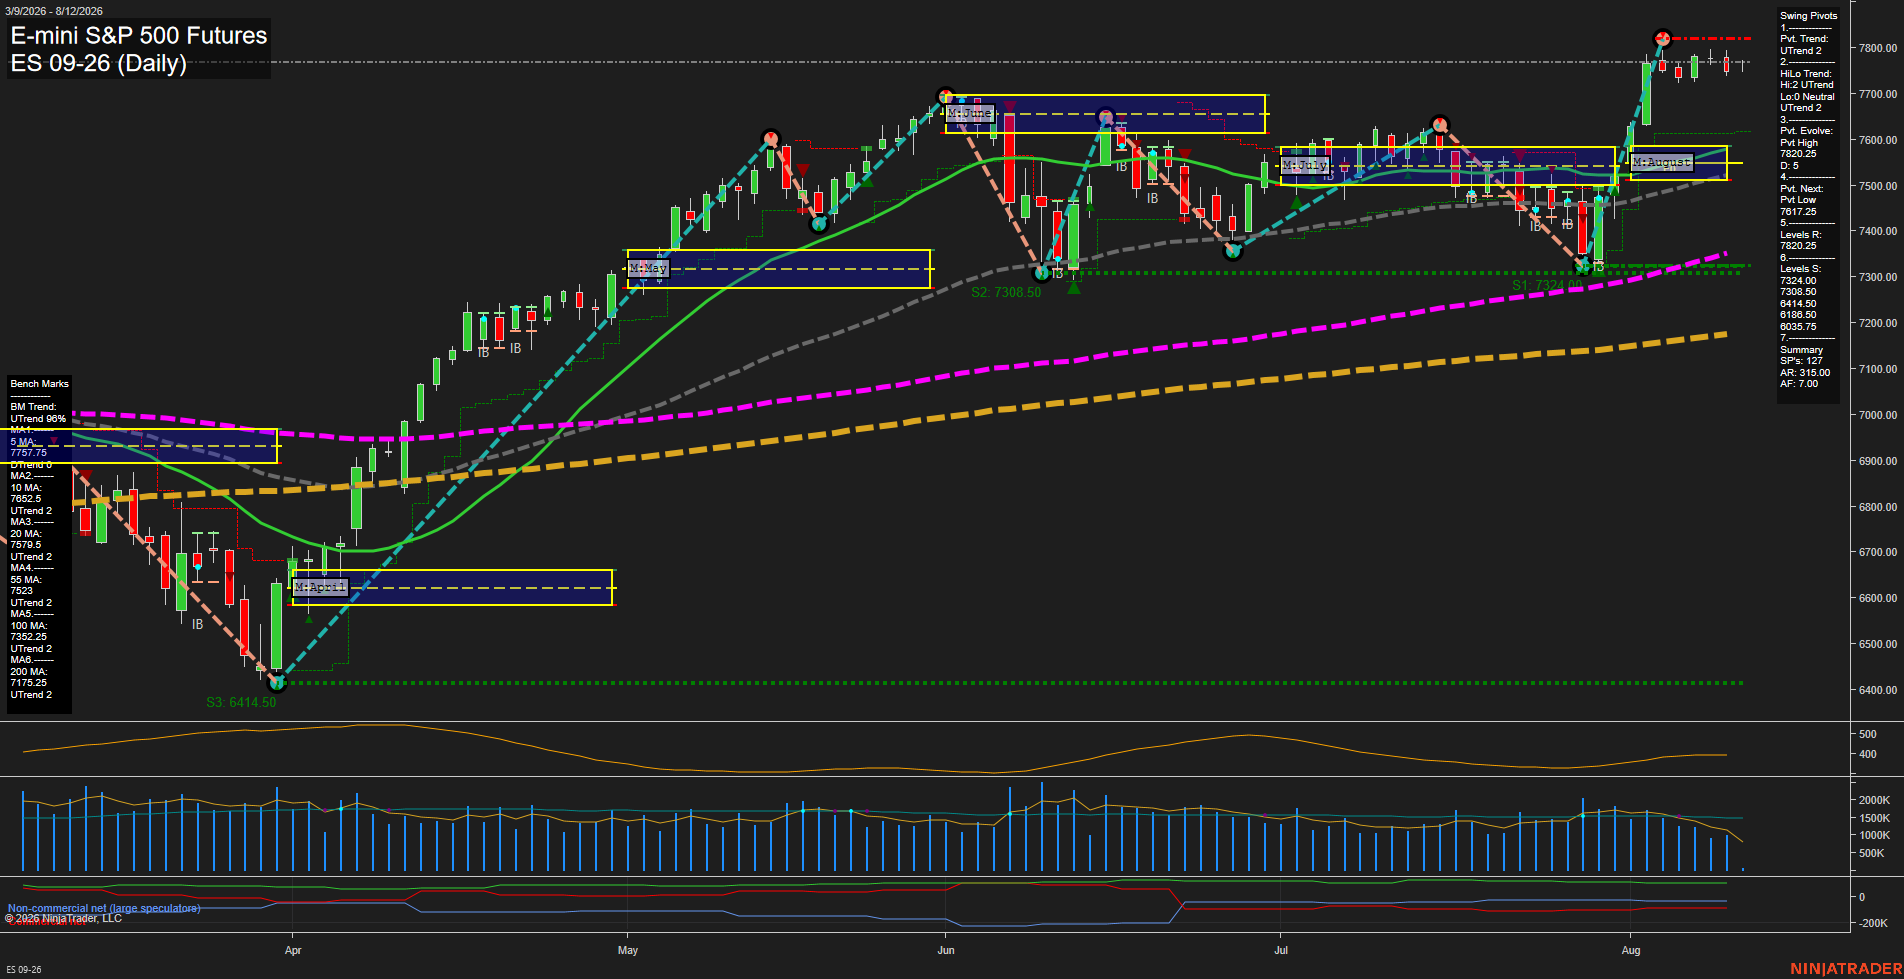
ES Daily View
Overall Rating
- Short-Term: Neutral
- Intermediate-Term: Bullish
- Long-Term: Bullish.
Key Insights Summary
The daily structure remains broadly constructive, with price holding above all rising benchmark averages and the intermediate pivot sequence retaining higher-high and higher-low characteristics. The early-August surge produced a new pivot high near 7810.25, followed by small, compressed daily bars beneath 7820.50 resistance, indicating consolidation after a fast upside expansion. Short-term conditions are mixed: the weekly fib-grid bias is down and the recent WSFG signal is short, while the daily pivot trend and short-term moving averages remain upward. The 7617.25 pivot-next level defines the key downside reversal threshold within the current swing structure. Monthly and yearly fib-grid positioning, together with rising 20-, 55-, 100-, and 200-day averages, preserve the bullish intermediate and long-term trend backdrop.
View charts on: AlphaWebTrader HTF Charts
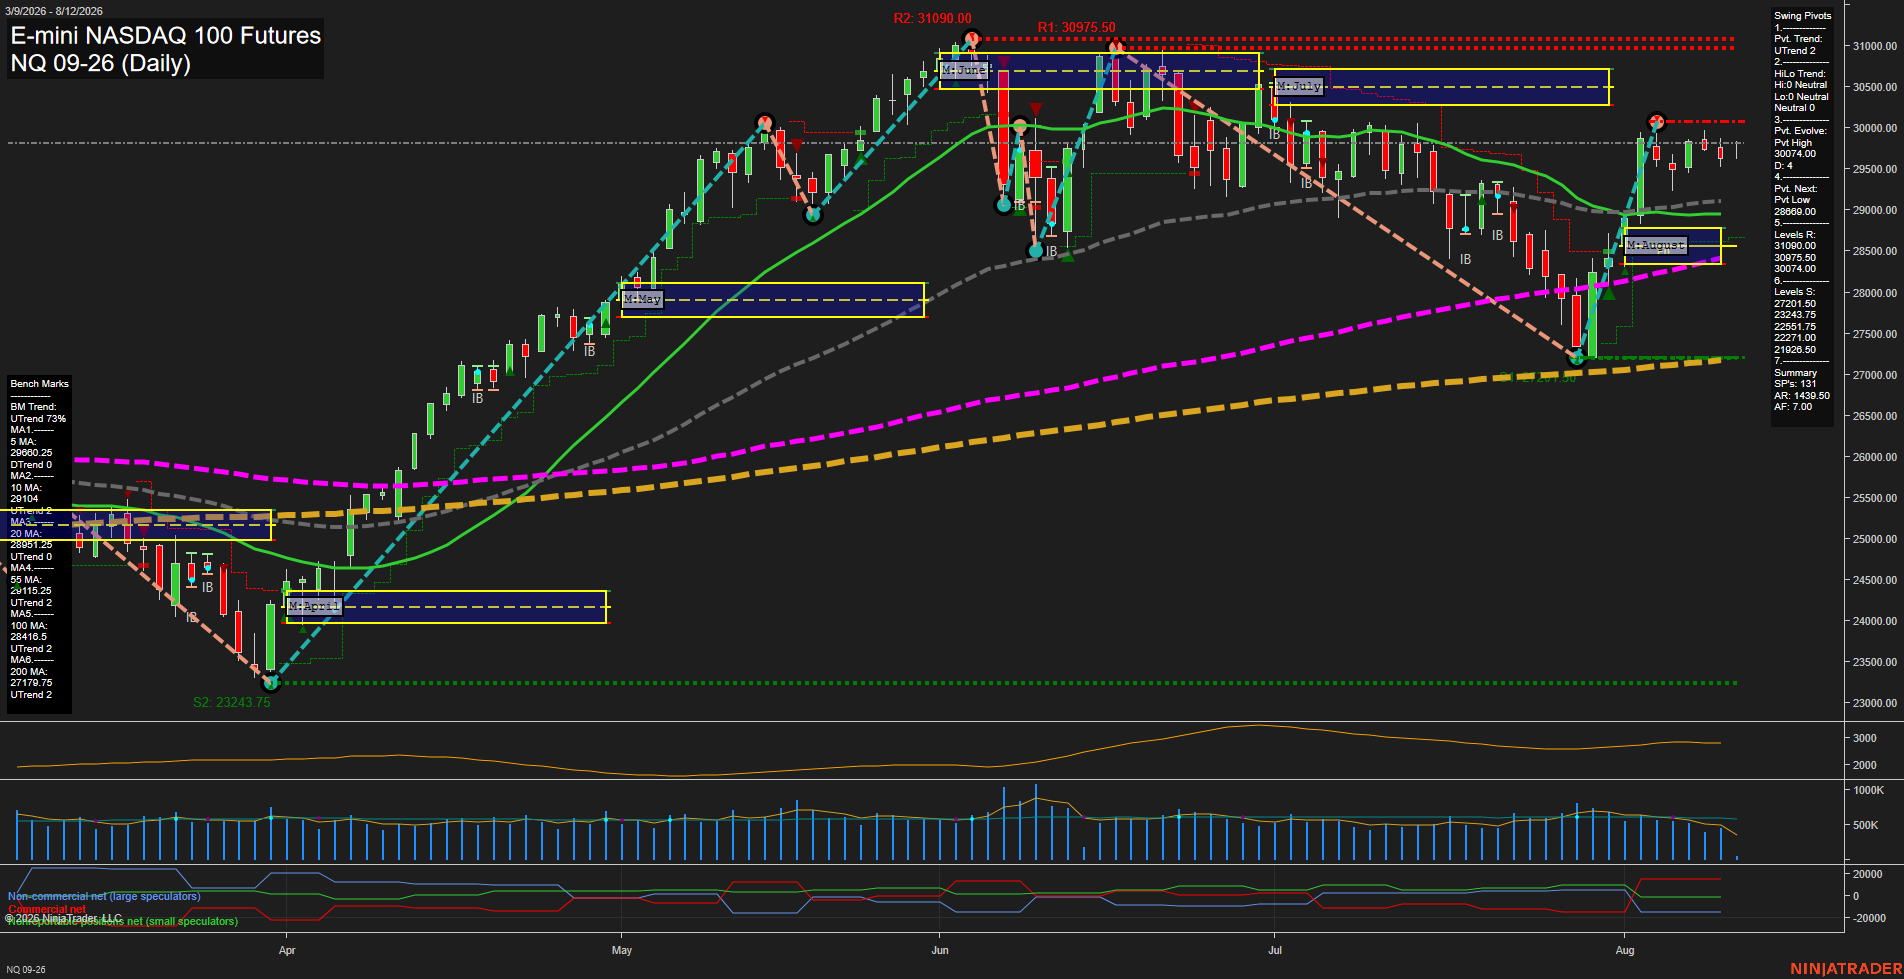
NQ Daily View
Overall Rating
- Short-Term: Bullish
- Intermediate-Term: Bullish
- Long-Term: Bullish.
Key Insights Summary
Price is consolidating just beneath the 30074 pivot-high resistance after a sharp August recovery from the late-July washout. Small daily bars and slowing momentum characterize a choppy compression phase, while the short-term WSFG remains neutral. The broader structure remains constructive: price is above the rising 20-, 55-, 100-, and 200-day benchmarks, the monthly and yearly fib-grid trends are up, and the pivot structure remains in an UTrend. The nearby 30074 level is the immediate structural ceiling, with 30975.50 to 31090 marking the higher resistance band; 28689 is the pivotal reversal reference beneath the current recovery structure.
View charts on: AlphaWebTrader HTF Charts
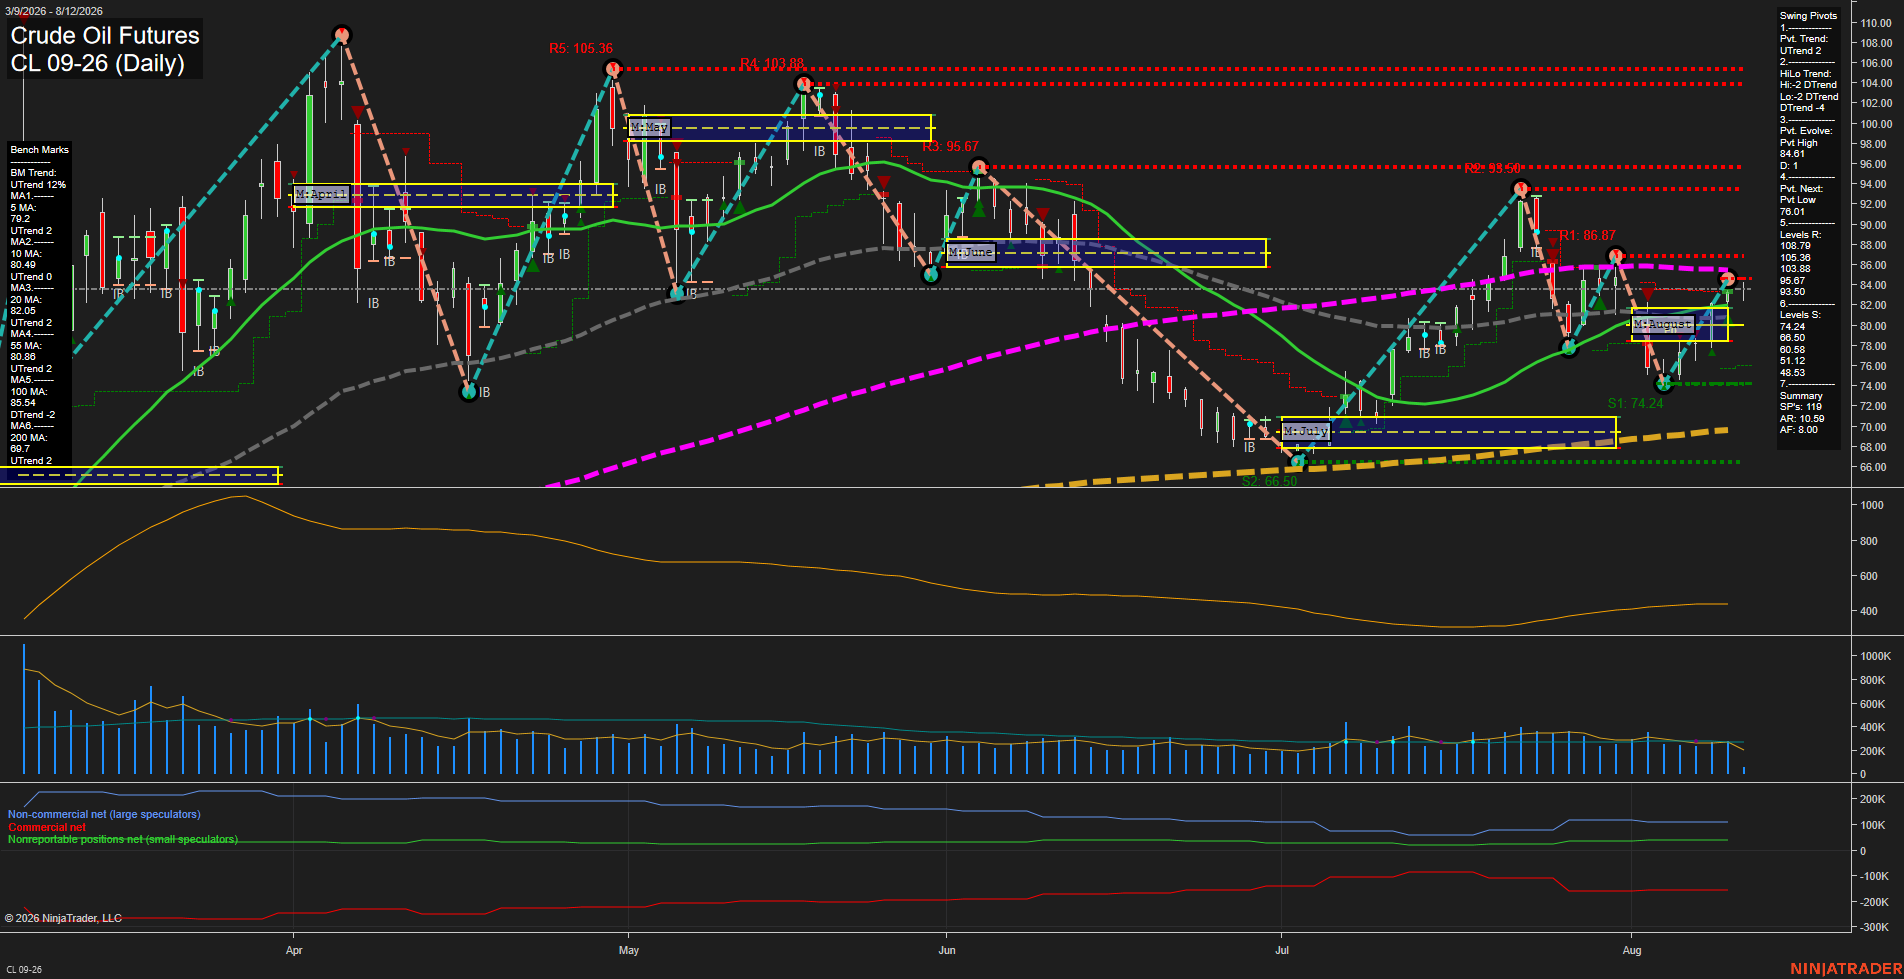
CL Daily View
Overall Rating
- Short-Term: Bullish
- Intermediate-Term: Neutral
- Long-Term: Bullish.
Key Insights Summary
Price is recovering from the late-July selloff and has rebuilt a short-term UTrend, holding above the 5-day and 10-day benchmarks while remaining above the weekly and monthly F0% grid references. The recovery has approached the 55-day and 100-day benchmark cluster near 85.5 to 85.8, with 86.87 the nearest defined swing resistance. Intermediate structure remains mixed because the HiLo pivot trend is still down despite the August rebound. The broader yearly structure remains constructive above the rising 200-day benchmark, while the 76.01, 74.24, and 66.50 swing supports define the major downside reference sequence.
View charts on: AlphaWebTrader HTF Charts
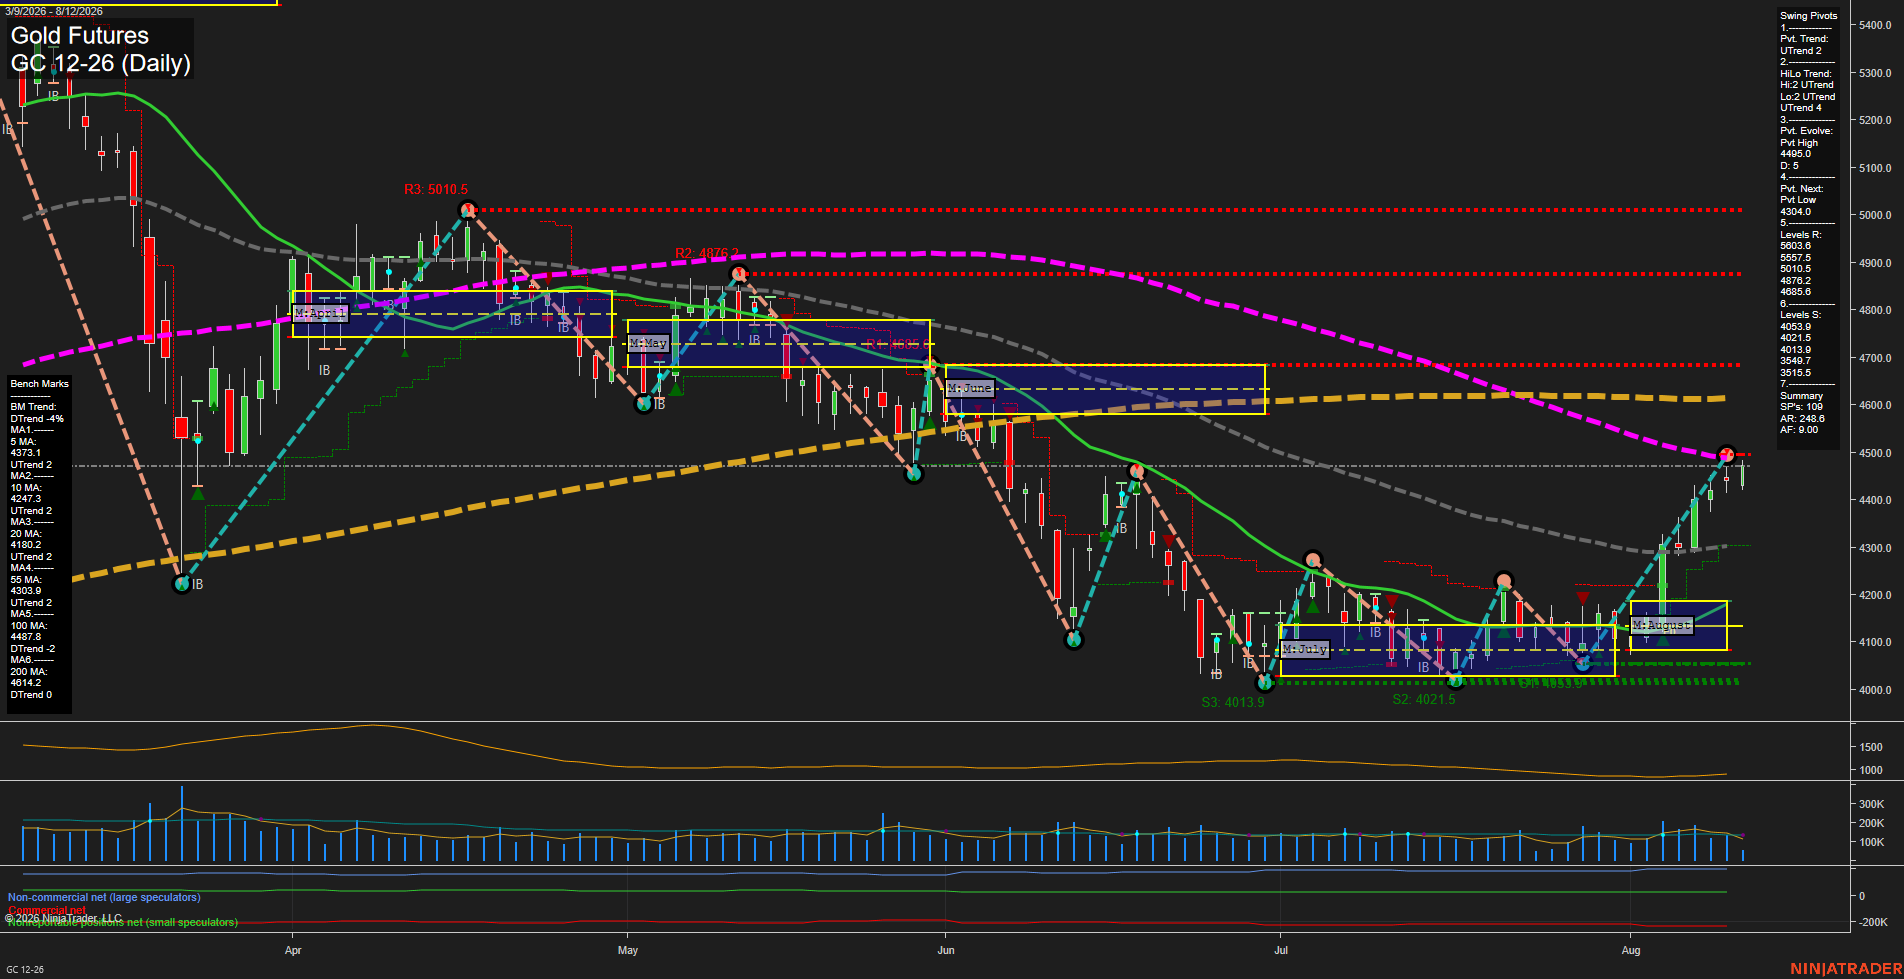
GC Daily View
Overall Rating
- Short-Term: Bullish
- Intermediate-Term: Bullish
- Long-Term: Bearish.
Key Insights Summary
Gold has staged a fast V-style recovery from the July/August 4014-4054 support area, producing higher lows and restoring the short-term and intermediate-term pivot structures to uptrend. Price is above the weekly and monthly F0% grids and above the rising 5-, 10-, 20-, and 55-day benchmarks. The recovery is now testing the 4495 pivot-high area and the declining 100-day benchmark near 4487.8, creating an important overhead confluence zone. The broader structure remains counter-trend versus the declining 100- and 200-day benchmarks and the negative yearly grid bias, while elevated ATR conditions reflect a volatile swing environment.
View charts on: AlphaWebTrader HTF Charts