NYSE pre-market radar tracks ETF movers, bullish equity futures, PPI and jobless claims, gold support, oil inventories and Middle East supply risks.
Fundamentals: U.S. equity futures edged higher after softer CPI eased near-term rate-hike expectations, while gold and silver held support ahead of producer-price data and unemployment claims. Oil declined amid weaker demand projections and rising U.S. crude inventories, though Middle East conflict, maritime disruptions and uncertainty over Hormuz flows remained key energy-market factors. Asian technology shares also advanced on AI and memory-chip strength.
Technicals: Prior-session ETF leaders included NVDA, GLD and QQQ, while AMZN, MSFT and META declined. Futures technical readings show bullish short-, intermediate- and long-term structures across ES, NQ, EMD, RTY and FDAX, with prices testing nearby resistance after strong advances. YM retains bullish intermediate and long-term conditions, while its short-term signals remain mixed.
Pre-Market Trading 360° view Market Radar of: holidays, earnings, eco-news, market-news summary, news sentiment, prior session major ETFs, MAG7, Higher Time Frame Analysis Indices Futures Summary, and E-mini S&P500, Nasdaq 100, NYMEX Crude, Gold Futures Daily Chart analysis.
As of: August 13, 2026 07:16 CT
EcoNews Radar U.S. Events
| Day | Time | Impact | Event |
|---|---|---|---|
| Thu | 08:30 | High | Core PPI m/m |
| Thu | 08:30 | High | PPI m/m |
| Thu | 08:30 | Medium | Unemployment Claims |
| Fri | 08:30 | Medium | Core Retail Sales m/m |
| Fri | 08:30 | Medium | Retail Sales m/m |
| Fri | 10:00 | Medium | Prelim UoM Consumer Sentiment |
| Fri | 10:00 | Medium | Prelim UoM Inflation Expectations |
EcoNews Summary
Thursday’s 08:30 producer inflation releases are the week’s qualifying high-impact EcoNews events. The headline and core Producer Price Index reports provide an update on inflation pressures at the producer level, a key input for interest-rate and broad index-futures market sensitivity.
Event Notes:
- Thursday 08:30 – USD Core PPI m/m: Measures the monthly change in producer prices excluding food and energy. Traders monitor core producer inflation for underlying price-pressure trends.
- Thursday 08:30 – USD PPI m/m: Measures the monthly change in prices received by domestic producers for goods and services. Traders monitor it for producer-level inflation conditions and potential pressure on broader price measures.
Conclusion:
The single most important event is Thursday’s 08:30 USD Core PPI m/m release. Its focus on underlying producer inflation places it at the center of the week’s listed high-impact economic calendar.
For full details visit: Forex Factory EcoNews
Market News Summary:
Softer U.S. inflation supported equity futures and metals, while oil faced demand and inventory pressure amid Middle East supply disruptions.
Primary Drivers & Risks:
- Primary Driver: Softer CPI and Fed repricing
- Primary Risk: Middle East oil supply disruption
Tone:
Cautiously constructive, with inflation and energy cross-currents.
Stock Market / ETFs / Indices:
Wall Street index futures edged higher as crude retreated ahead of U.S. producer-price data. Softer CPI supported U.S. stocks, while Japanese chip and electronics shares rose 1.8% and South Korea’s Kospi entered bull-market territory on renewed AI and memory-chip strength. Tariff refunds supported earnings at companies including Apple, Nike, and FedEx, while concerns persisted that AI equities carry demanding valuations.
Geopolitical:
U.S.-Israeli conflict with Iran disrupted demand projections and kept supply concerns focused on Hormuz, the Gulf of Oman, and the Red Sea. Deadlock in U.S.-Iran talks, attacks on vessels, and a worsening tanker spill near Oman added to energy-market uncertainty. U.S. officials also cited efforts to address tariff evasion linked to Chinese transshipment.
Oil / Energy:
Oil declined on weaker 2026 demand forecasts, unexpectedly rising U.S. crude inventories, and a reported 17.4 million-barrel crude build. Conflict-related supply constraints, uncertain Hormuz flows, and shipping disruptions provided an offsetting floor for crude prices. Refining disruptions supported the outlook for isolated-market refinery margins.
Gold / Metals:
Gold gained after July CPI showed only a marginal month-to-month increase, reducing rate-hike expectations. Gold and silver remained supported as attention shifted to producer-price inflation and the Fed policy outlook.
Fed / Financials:
Inflation data eased near-term rate-hike expectations, helping risk assets and Asian currencies. Policy views remained divided: Robert Kaplan supported the Fed’s July decision not to raise rates, while Eddie Ghabour cited potential tightening signals at Jackson Hole. Japan’s substantial reserves were cited as capacity for further yen intervention, dependent on Japanese-U.S. rate differentials.
Macro / Other:
Producer-price data stood as the next inflation reading for markets assessing the interest-rate path. AI demand remained visible in technology activity, including higher DeepSeek API pricing and a U.S. hyperscaler data-center contract.
Conclusion:
Softer CPI underpinned higher equity futures, stronger Asian technology shares, and gains in gold. PPI data and Fed-policy signals remained central near-term macro inputs.
Oil faced pressure from weak demand projections and elevated U.S. inventories. Middle East conflict, maritime disruptions, and Hormuz supply uncertainty remained significant cross-currents, while elevated AI valuations posed an equity-market risk.
Market News Sentiment
Market News Articles: 49
- Neutral: 59.18%
- Positive: 30.61%
- Negative: 10.20%
Sentiment Summary: Among 49 market news articles, 59% were neutral, 31% positive, and 10% negative, indicating predominantly neutral coverage with a positive skew.
Conclusion: Indices futures day traders face a news backdrop with limited negative sentiment and more positive than negative articles.
GLD,Gold Articles: 10
- Positive: 70.00%
- Neutral: 20.00%
- Negative: 10.00%
Sentiment Summary: GLD/Gold coverage is predominantly positive at 70%, with 20% neutral and 10% negative articles.
Conclusion: Gold-related news tone is positive overall, indicating favorable media sentiment toward GLD/Gold.
USO,Oil Articles: 13
- Negative: 61.54%
- Neutral: 23.08%
- Positive: 15.38%
Sentiment Summary: USO/Oil coverage is predominantly negative at 62%, with 23% neutral and 15% positive across 13 articles.
Conclusion: Oil-related news tone is negative overall, which may be relevant context for indices futures traders monitoring energy-sector sentiment.
Market Data Snapshot
ETF Snapshot of major stock market ETFs, Mag7, and others as of: August 13, 2026 07:16
Top Movers & Losers
- NVDA 224.09 Bullish 3.03% ▲
- GLD 404.92 Bullish 0.99% ▲
- QQQ 723.70 Bullish 0.73% ▲
- AMZN 267.28 Bearish -1.83% ▼
- MSFT 492.43 Bearish -2.26% ▼
- META 578.85 Bearish -3.38% ▼
Major Index ETFs: SPY, QQQ, DIA, IWM, IJH
- QQQ 723.70 Bullish 0.73% ▲
- IWM 302.71 Bullish 0.57% ▲
- IJH 78.06 Bullish 0.37% ▲
- SPY 772.49 Bullish 0.25% ▲
- DIA 537.15 Bearish -0.02% ▼
Mixed index ETF snapshot: QQQ is the most bullish mover at +0.73%, followed by IWM at +0.57%, IJH at +0.37%, and SPY at +0.25%. DIA is the most bearish mover, though marginally lower at -0.02%.
Mag 7 Stocks: AAPL, MSFT, GOOG, AMZN, META, NVDA, TSLA
- NVDA 224.09 Bullish 3.03% ▲
- GOOG 342.37 Bearish -0.18% ▼
- AAPL 302.25 Bearish -0.87% ▼
- TSLA 327.51 Bearish -1.59% ▼
- AMZN 267.28 Bearish -1.83% ▼
- MSFT 492.43 Bearish -2.26% ▼
- META 578.85 Bearish -3.38% ▼
Mag7 conditions are Bearish overall: NVDA is the most bullish mover at +3.03%, while META is the most bearish mover at -3.38%. GOOG is marginally Bearish at -0.18%; AAPL is Bearish at -0.87%, TSLA at -1.59%, AMZN at -1.83%, and MSFT at -2.26%.
Cross-Market ETFs: TLT, GLD, USO, IBIT
- GLD 404.92 Bullish 0.99% ▲
- TLT 82.11 Bearish -0.10% ▼
- IBIT 35.89 Bearish -0.14% ▼
- USO 127.30 Bearish -0.24% ▼
Mixed cross-market snapshot: GLD is the most bullish mover at +0.99%, while USO is the most bearish mover at -0.24%. IBIT is modestly Bearish at -0.14%, and TLT is marginally Bearish at -0.10%.
ETF, Mag7, and Cross-Market ETF Insights
Overall Tone
Mixed: major equity ETFs are mostly Bullish, while broad Bearish pressure across Mag7 and mixed cross-market ETF performance creates uneven participation.
Equity ETFs and Mag7:
Major Index ETFs were broadly Bullish, led by QQQ +0.73%, IWM +0.57%, IJH +0.37%, and SPY +0.25%, while DIA was near-flat Bearish at -0.02%. Mag7 performance was selective and Bearish overall: NVDA gained +3.03%, while GOOG fell -0.18%, AAPL -0.87%, TSLA -1.59%, AMZN -1.83%, MSFT -2.26%, and META -3.38%. NVDA was the most Bullish mover, while META was the most Bearish mover.
Cross-Market ETFs:
GLD was Bullish at +0.99%, diverging from Bearish TLT at -0.10%, IBIT at -0.14%, and USO at -0.24%. GLD was the most Bullish cross-market mover, while USO was the most Bearish; TLT was marginally Bearish.
Futures Indices – Higher Time Frame Analysis
Summary of the current state of US Indices Futures based on higher time-frame (HTF) technical analysis as of: 2026-08-13: 07:16 CT.
US Indices Futures
- ES: YSFG/MSFG/WSFG above F0%, benchmarks rising, higher pivots, resistance 7820.25-7850.25, support 7628.75; WSFG short signal active.
- NQ: YSFG/MSFG/WSFG above F0%, all benchmarks rising, higher pivots, resistance 30074-31090, reversal pivot 27285.50; volatile signal conflict.
- YM: YSFG/MSFG upward, WSFG below F0%, benchmarks rising, pivot resistance 54384-54884, support 53534/52400; short-term countertrend structure.
- EMD: YSFG/MSFG/WSFG above F0%, benchmarks rising, UTrend pivots, resistance 3921-3927, support 3904.7/3814.0; recent long signal.
- RTY: YSFG/MSFG/WSFG above F0%, benchmarks rising, higher pivots, resistance 3062.1-3068.4, reversal pivot 2857.2; momentum remains fast.
- FDAX: YSFG/MSFG/WSFG aligned upward, benchmarks rising, higher pivots, resistance 26665-26685, pullback pivot 26065; consolidation near highs.
Overall State
- Short-Term: Bullish
- Intermediate-Term: Bullish
- Long-Term: Bullish
Conclusion
Broad HTF alignment remains upward across ES, NQ, EMD, RTY, and FDAX: YSFG, MSFG, WSFG, rising benchmarks, and higher pivot structures are correlated. YM retains bullish intermediate- and long-term structure but has a weaker WSFG condition and active short-term countertrend signals. ES and NQ also show short-term signal conflict while testing swing-resistance zones. Most contracts are consolidating or extending near pivot highs, with listed opposite pivots and benchmark bands defining structural support references.
Note: Intra-day counter-trend pullbacks or retracements may occur, HTF is context for informational usage and market structure. Glossary: Session Fib Grids periods of YSFG:’Yearly’, MSFG:’Monthly’, WSFG:’Weekly’
For full details visit: AlphaWebTrader Technicals
ES Daily View
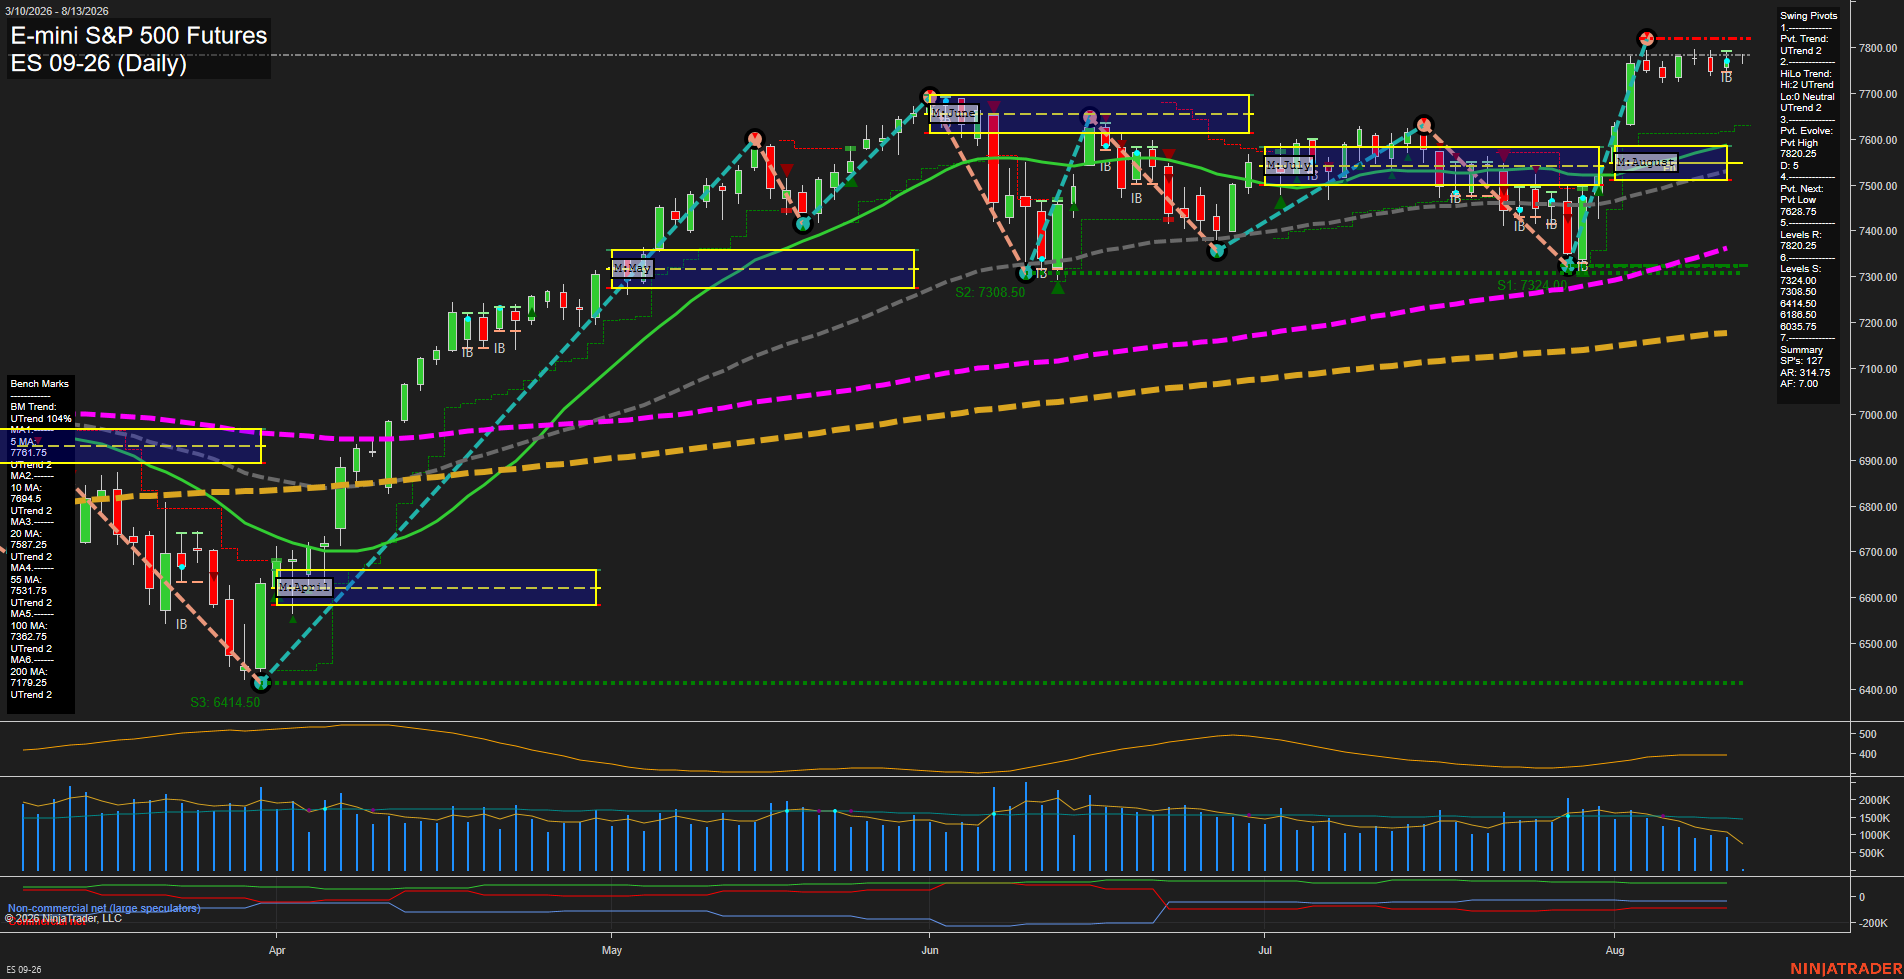
Overall Rating
- Short-Term: Bullish
- Intermediate-Term: Bullish
- Long-Term: Bullish.
Key Insights Summary
Price remains in a broad daily uptrend, holding above every benchmark moving average while both short-term pivot and intermediate HiLo structures remain in UTrend. The August advance reached a new pivot high at 7838.25 and is now consolidating with small, slower-momentum bars just beneath the 7820.25 to 7838.25 resistance area. The weekly, monthly, and yearly fib-grid readings remain above their F0%/NTZ references, preserving positive multi-timeframe structure. The nearest defined pivot reversal level is 7628.75, while the rising 5-day and 10-day averages at 7761.75 and 7694.50 frame the immediate short-term trend condition.
View charts on: AlphaWebTrader HTF Charts
NQ Daily View
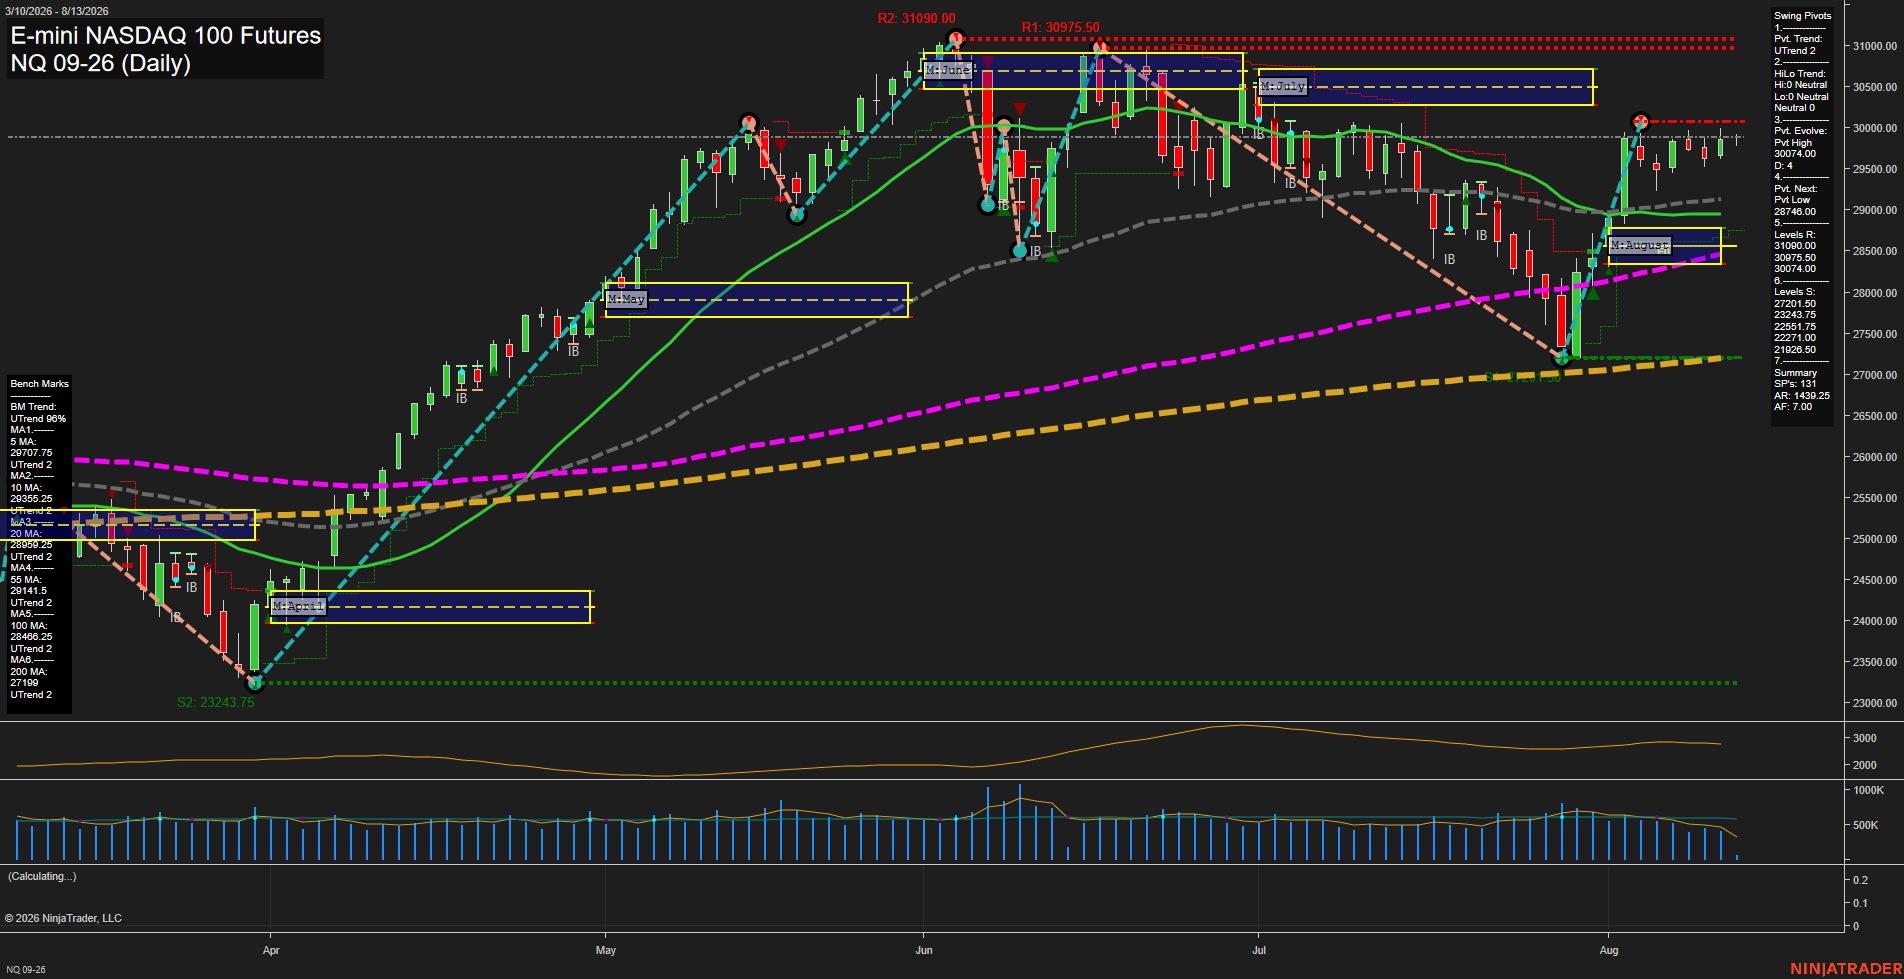
Overall Rating
- Short-Term: Bullish
- Intermediate-Term: Bullish
- Long-Term: Bullish.
Key Insights Summary
Price has staged a sharp V-shaped recovery from the late-July low near 27200 and is consolidating just beneath the 30074 pivot-high trigger. Small recent candles and slowing momentum reflect compression after the rebound, while price remains above the rising 5-, 10-, 20-, 55-, 100-, and 200-day benchmarks. The short-term pivot structure is upward, with 30074 serving as the immediate swing resistance and 30975.50-31090 the higher resistance band. The August monthly grid remains constructive above its F0% area, while the broad 2026 structure retains higher-low characteristics despite the July correction.
View charts on: AlphaWebTrader HTF Charts
CL Daily View
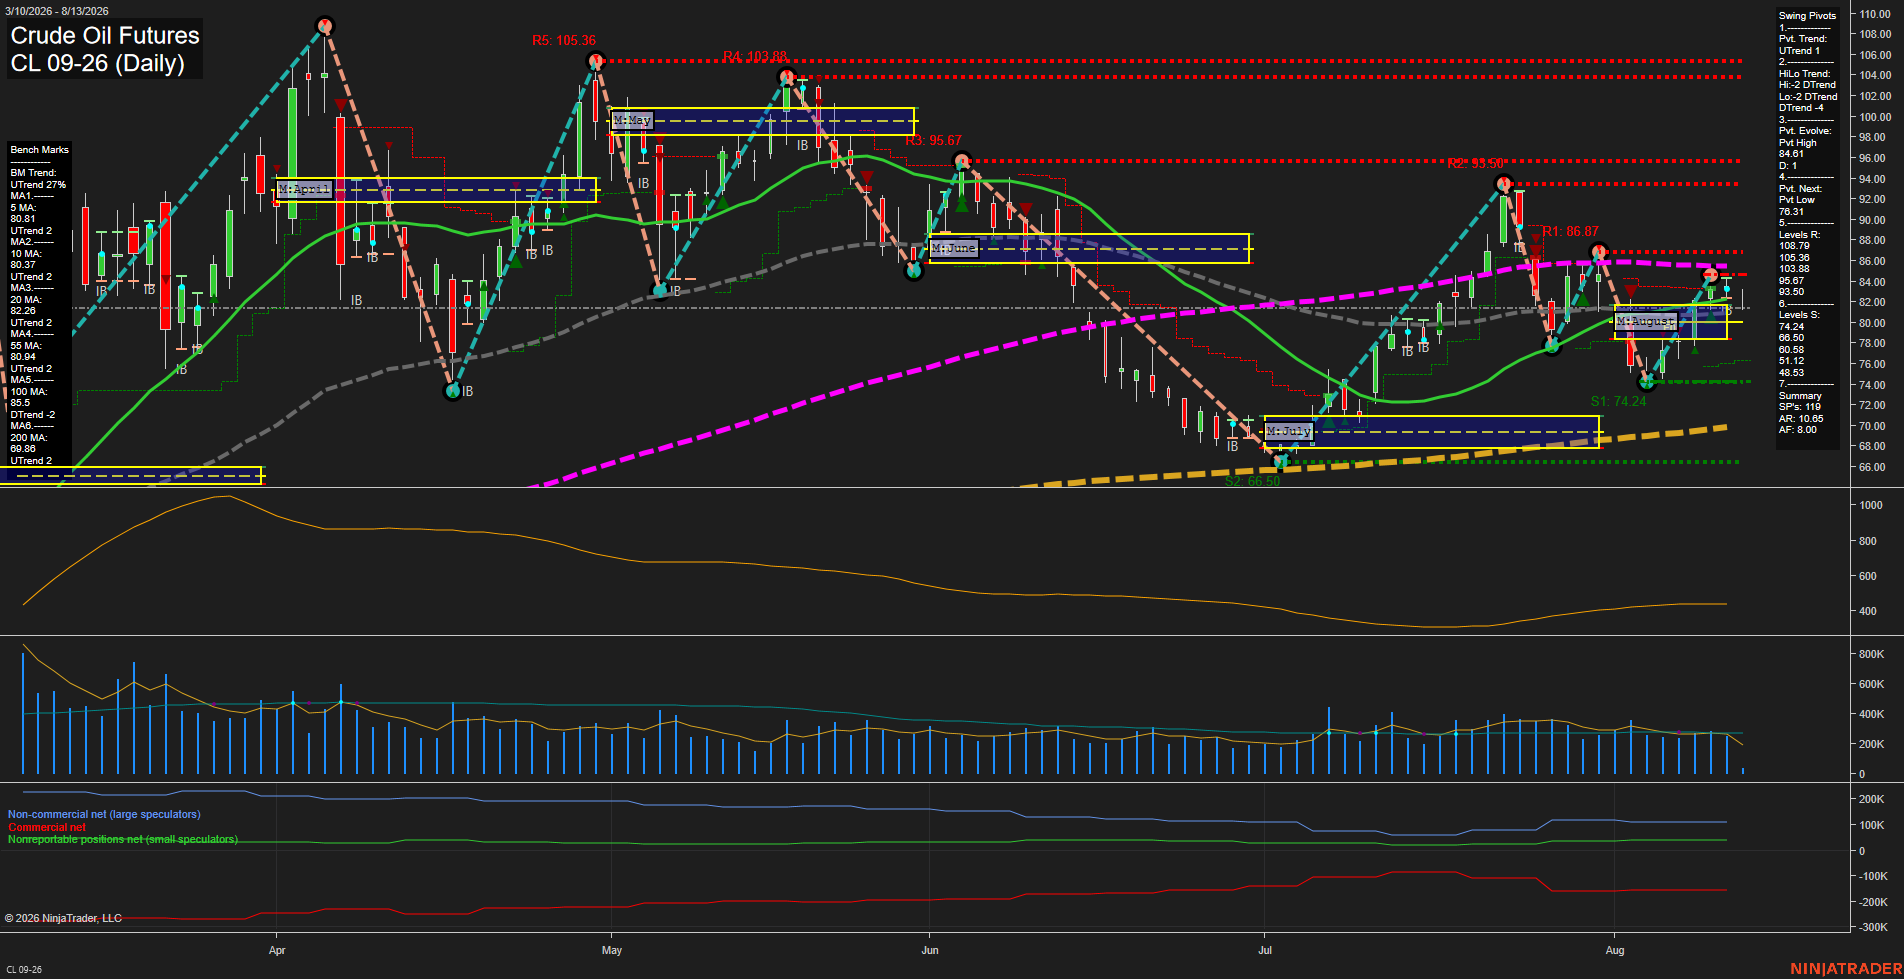
Overall Rating
- Short-Term: Bullish
- Intermediate-Term: Bullish
- Long-Term: Bullish.
Key Insights Summary
Price is consolidating above the rising 5, 10, 20, and 55-day benchmarks after a sharp rebound from the late-July 74.24 swing low. The short-term pivot structure remains in an UTrend, although the active pivot-high evolution at 84.61 and the intermediate HiLo DTrend show that the rally is still operating beneath the larger 85.50 to 86.87 resistance area. Price is above the weekly and monthly F0% levels, supporting constructive near-term and intermediate-term tone, while the yearly grid and rising 200-day average preserve the broader bullish backdrop. Recent daily bars are small and volume is moderating, consistent with consolidation following the recovery rather than a high-momentum breakout.
View charts on: AlphaWebTrader HTF Charts
GC Daily View
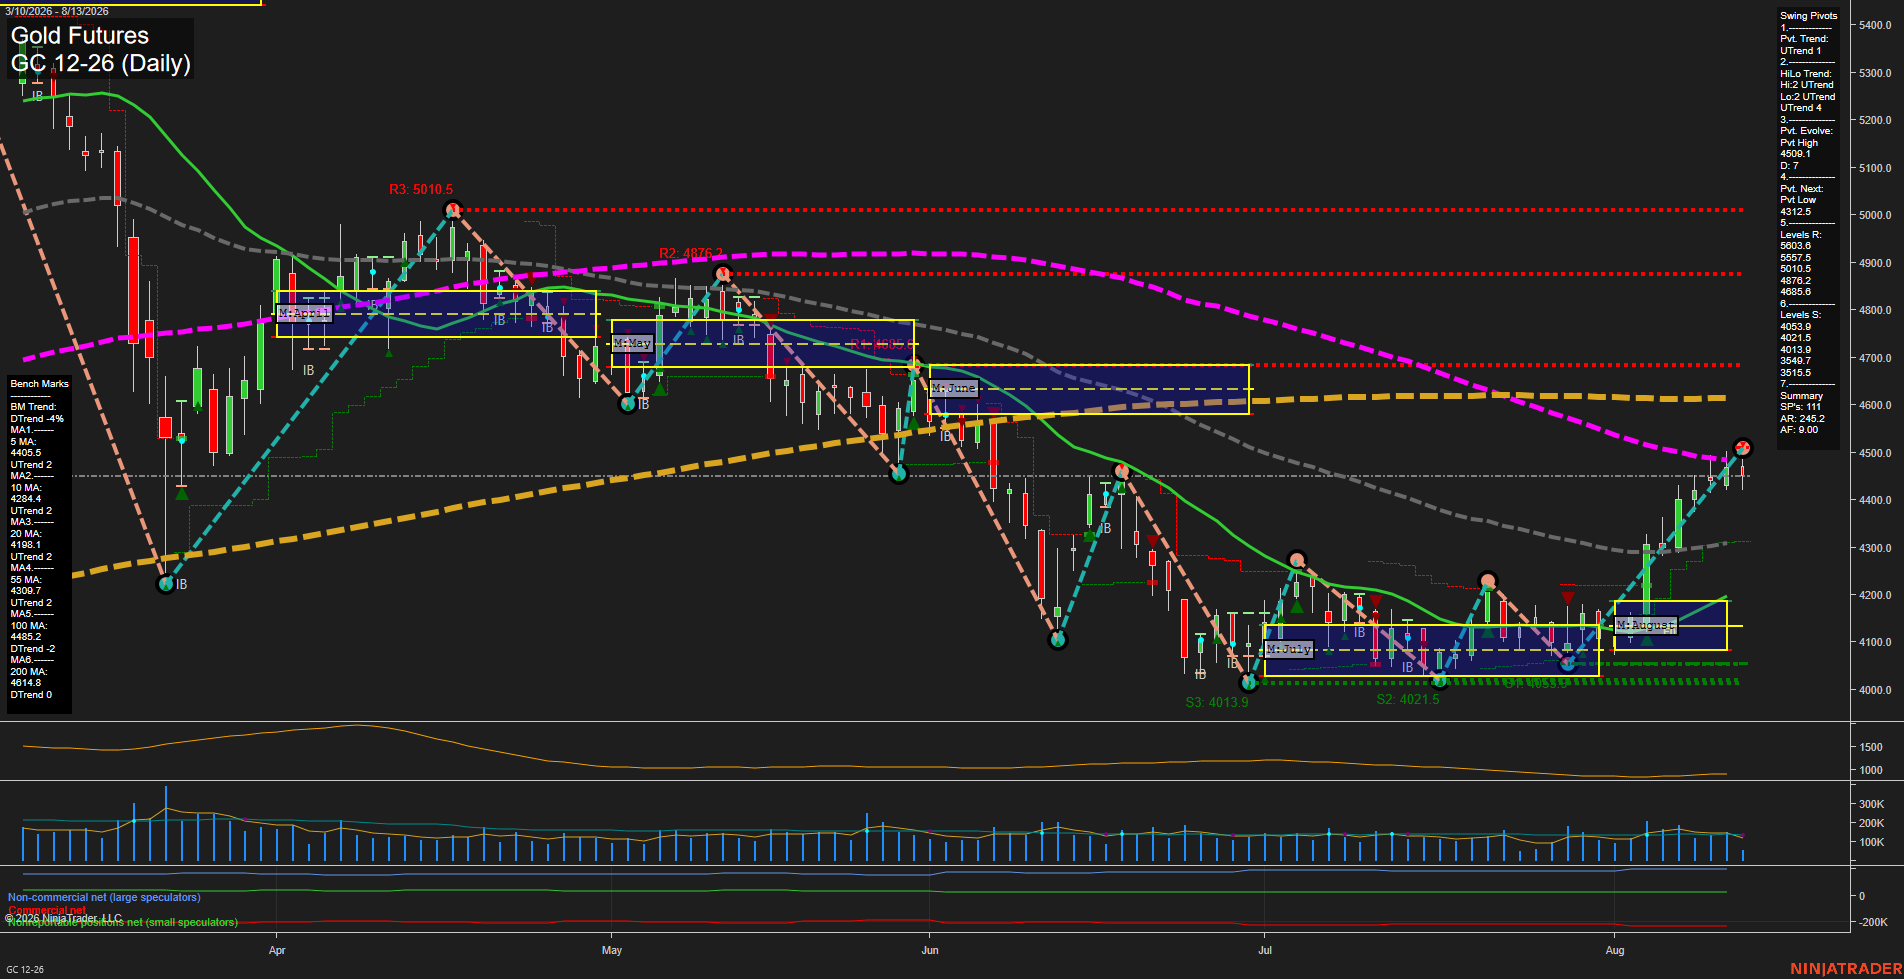
Overall Rating
- Short-Term: Bullish
- Intermediate-Term: Bullish
- Long-Term: Bearish.
Key Insights Summary
Gold has produced a fast V-style recovery from the early-August 4,000 area, creating higher swing lows and restoring both short-term and intermediate pivot trends to UTrend. Price is above the weekly and monthly Fib-grid centers and has reclaimed the rising 5, 10, 20, and 55-day benchmark structure. The rally is testing the 100-day benchmark near 4485 and the newly established 4509.1 pivot high, while 4685.6 remains the next major overhead pivot resistance. The long-term structure remains mixed-to-bearish because price is below the declining 200-day benchmark and the yearly Fib-grid bias remains below its center.
View charts on: AlphaWebTrader HTF Charts