The Dow rose 1.05% as earnings and lower oil supported stocks, while AI financing concerns, weak breadth and soft housing data tempered market strength.
Fundamentals: The Dow gained 548 points to close at 52,513.98, supported by corporate earnings and a retreat in oil prices. Broader market performance was uneven as AI financing concerns weighed on technology shares and market breadth remained weak. Housing data missed forecasts, while Middle East tensions and discussion of further Federal Reserve rate increases added to market risks.
Technicals: US equities showed notable weakness on October 20, 2026, with QQQ down 2.50% and META falling 3.72%, while USO gained 2.83%. Weekly and daily futures charts show broad short-term pressure across the S&P 500, Nasdaq, mid-cap and Russell 2000 contracts. Dow futures remain comparatively resilient, while longer-term weekly trends generally retain bullish structures despite the pullback.
After Market Close daily snapshot: market news summary and sentiment, major ETFs, Magnificent 7 analysis, Indices Futures Higher Time Frame Analysis, and E-mini S&P500, Nasdaq 100, NYMEX Crude, Gold Futures Daily Chart analysis.
As of: October 20, 2026 05:00 CT
Market News Summary:
Earnings strength and retreating oil supported the Dow, while AI financing concerns and weak market breadth limited broader equity strength.
Primary Drivers & Risks:
- Primary Driver: Strong earnings and lower oil prices
- Primary Risk: AI financing stress and narrow market breadth
Tone:
Mixed, with Dow strength contrasting with technology-sector concerns.
Stock Market / ETFs / Indices:
The Dow gained 1.05%, or 548 points, to close at 52,513.98. Closing reports differed on overall market direction, describing equities as higher or mixed, but consistently highlighted earnings support and AI-related pressure on technology. Breadth remained weak: one report placed more than 80% of S&P 500 constituents at least 10% below their highs. Concerns centered on concentrated earnings, debt-funded AI infrastructure and uncertain investment returns. South Korean data-center firm Elice fell 32% in its debut, while Chinese A-shares faced deleveraging and forced selling. General Motors shares declined following a warning about a difficult 2027, despite announcing a $20 billion buyback.
Geopolitical:
Hopes for U.S.-Iran diplomacy accompanied an equity reversal and softer oil prices, against continuing Middle East conflict. China condemned the U.S. government’s exclusion of DeepSeek products, adding a separate technology-policy tension.
Oil / Energy:
Crude reached a five-month high before reversing its gains. Lower oil prices supported Wall Street’s closing performance, while North Dakota producers accelerated well completions as prices rose. Airlines were reported to be absorbing most of the increase in jet-fuel costs.
Gold / Metals:
Gold pulled back toward $4,100, while silver and platinum advanced. Technical commentary identified $4,217 resistance and $4,066 support for gold. The World Gold Council highlighted tokenization as a potential source of longer-term investment demand, rather than a reported current inflow.
Fed / Financials:
September building permits, housing starts and pending sales undershot forecasts as the Federal Reserve considered additional rate increases. A separate economist outlook placed 10-year Treasury yields above 5% into 2027; this was a projection, not a reported current yield. JPMorgan committed $5 billion in equity to national-security, defense-technology and critical-supply-chain companies.
Macro / Other:
Michelin reported slightly lower sales on reduced tire volumes, adding a company-level demand warning alongside housing weakness. BlackRock’s Bitcoin ETF attracted $665 million on Monday, its largest daily inflow since October 2025, while Fidelity and Grayscale recorded outflows. Bitcoin remained between $82,000 and $83,000.
Conclusion:
Corporate earnings and the oil-price pullback supported the Dow’s advance. AI spending and financing concerns restrained technology shares and contributed to an uneven equity session.
Weak breadth and deteriorating housing data contrasted with headline index strength. Middle East developments and renewed rate-hike discussion remained additional risk factors.
Market News Sentiment
Market News Articles: 64
- Negative: 50.00%
- Neutral: 28.12%
- Positive: 21.88%
Sentiment Summary: Of 64 market news articles, 50% were negative, 28% neutral, and 22% positive.
Conclusion: The snapshot shows predominantly negative news sentiment, with negative coverage exceeding neutral and positive coverage individually.
GLD,Gold Articles: 14
- Positive: 42.86%
- Negative: 28.57%
- Neutral: 28.57%
Sentiment Summary: Across 14 GLD/Gold articles, sentiment was 43% positive, 29% negative, and 29% neutral.
Conclusion: Positive sentiment was the largest category, but this gold-focused snapshot provides no direct measure of indices futures sentiment.
USO,Oil Articles: 15
- Negative: 40.00%
- Neutral: 33.33%
- Positive: 26.67%
Sentiment Summary: Across 15 USO and oil articles, sentiment was 40% negative, 33% neutral, and 27% positive.
Conclusion: Negative sentiment was the largest category, but the snapshot covers oil rather than index futures directly.
ETF and stock performance
ETF, Mag7, and Cross-Market ETF Insights
Overall Tone
The daily session had a broadly risk-off tone, with declines across the major equity ETFs and most Mag7 stocks.
Equity ETFs and Mag7
QQQ led equity ETF losses at 2.50%, while DIA was relatively resilient, down 0.40%; small caps also underperformed SPY and mid caps. Six of the seven Mag7 stocks fell, broadly aligning with index weakness: META lagged at −3.72%, while AAPL was the lone gainer.
Cross-Market ETFs
Oil stood out as USO rose 2.83%, diverging sharply from equities, while long-duration Treasuries edged higher through TLT. Gold slipped slightly, and bitcoin exposure through IBIT fell 0.94%, joining the broader risk-asset decline.
| Instrument | Close | Net change % | Vol | Vwap |
|---|---|---|---|---|
| DIA ▼ | 519.10 | -0.40% | 5,373,948 | 520.68 |
| IJH ▼ | 72.35 | -0.93% | 8,882,250 | 72.56 |
| SPY ▼ | 763.25 | -1.11% | 64,456,707 | 765.56 |
| IWM ▼ | 270.44 | -1.69% | 33,867,145 | 271.71 |
| QQQ ▼ | 709.80 | -2.50% | 67,136,528 | 714.70 |
| Average / total | — | -1.32% | 179,716,578 | — |
| Instrument | Close | Net change % | Vol | Vwap |
|---|---|---|---|---|
| AAPL ▲ | 343.46 | +0.43% | 60,100,860 | 344.05 |
| NVDA ▼ | 214.13 | -1.43% | 121,918,561 | 215.65 |
| AMZN ▼ | 250.00 | -1.87% | 40,478,754 | 251.53 |
| MSFT ▼ | 529.05 | -1.93% | 24,934,042 | 531.36 |
| TSLA ▼ | 354.72 | -2.13% | 62,368,886 | 359.38 |
| META ▼ | 709.33 | -3.72% | 20,691,585 | 715.56 |
| Average / total | — | -1.77% | 330,492,688 | — |
| Instrument | Close | Net change % | Vol | Vwap |
|---|---|---|---|---|
| USO ▲ | 161.76 | +2.83% | 6,746,422 | 159.57 |
| TLT ▲ | 80.05 | +0.10% | 42,411,089 | 80.00 |
| GLD ▼ | 382.01 | -0.18% | 9,103,333 | 382.54 |
| IBIT ▼ | 46.15 | -0.94% | 45,508,430 | 46.06 |
| Average / total | — | +0.45% | 103,769,274 | — |
Futures Indices – Higher Time Frame Analysis
Summary of the current state of US Indices Futures based on higher time-frame (HTF) technical analysis as of: 2026-10-20: 17:00 CT.
US Indices Futures
- ES: YSFG upward, MSFG below F0%, WSFG unspecified, below 5–55-day benchmarks, weekly long-term benchmarks rising, support 7657–7676, pivot resistance 7824, major resistance 7897.50–7950.25.
- NQ: YSFG upward, MSFG below F0%, WSFG above F0%, below 5–100-day benchmarks, support 29053–29226, weekly pivot support 29262, reversal pivot 30197, resistance 31375.50–31616.50.
- YM: YSFG/MSFG/WSFG above references, above rising 5–20-day benchmarks, below 55-day benchmark, daily pivots upward, support 50859, resistance 52835, weekly reversal reference 53199.
- EMD: YSFG upward, MSFG below F0% weekly, WSFG midpoint consolidation, below all daily benchmarks, pivots downward, support 3600.3–3609.1, resistance 3635.7 and 3737.8.
- RTY: YSFG upward, MSFG below F0%, WSFG above F0%, below all daily benchmarks, pivots downward, support 2723.3, resistance 2761–2822, daily reversal pivot 2803.5.
- FDAX: YSFG/MSFG above F0%, WSFG below F0%, below 5/20-day benchmarks, short-term pivots downward, 200-day benchmark 25273, support 24897–25170, resistance 25748–25827.
Overall State
- Short-Term: Bearish
- Intermediate-Term: Bearish
- Long-Term: Bullish
Conclusion
Short-term downward pivot structures predominate, with YM’s upward daily pivots marking relative strength. ES, NQ, EMD, and RTY share monthly-grid weakness; YM and FDAX retain stronger monthly structures. Recent ES short signals and NQ’s sharp reversal align with broader corrective conditions. EMD and RTY lag beneath all daily benchmarks, contrasting with bullish weekly long-term structures across the group. Nearby pivot supports frame ongoing consolidations, while benchmark and swing-high resistance remain overhead. YSFG structures retain the broader upward context despite divergent daily long-term ratings.
Note: Intra-day counter-trend pullbacks or retracements may occur, HTF is context for informational usage and market structure. Glossary: Session Fib Grids periods of YSFG:’Yearly’, MSFG:’Monthly’, WSFG:’Weekly’
For full details visit: AlphaWebTrader Technicals
ES Daily View
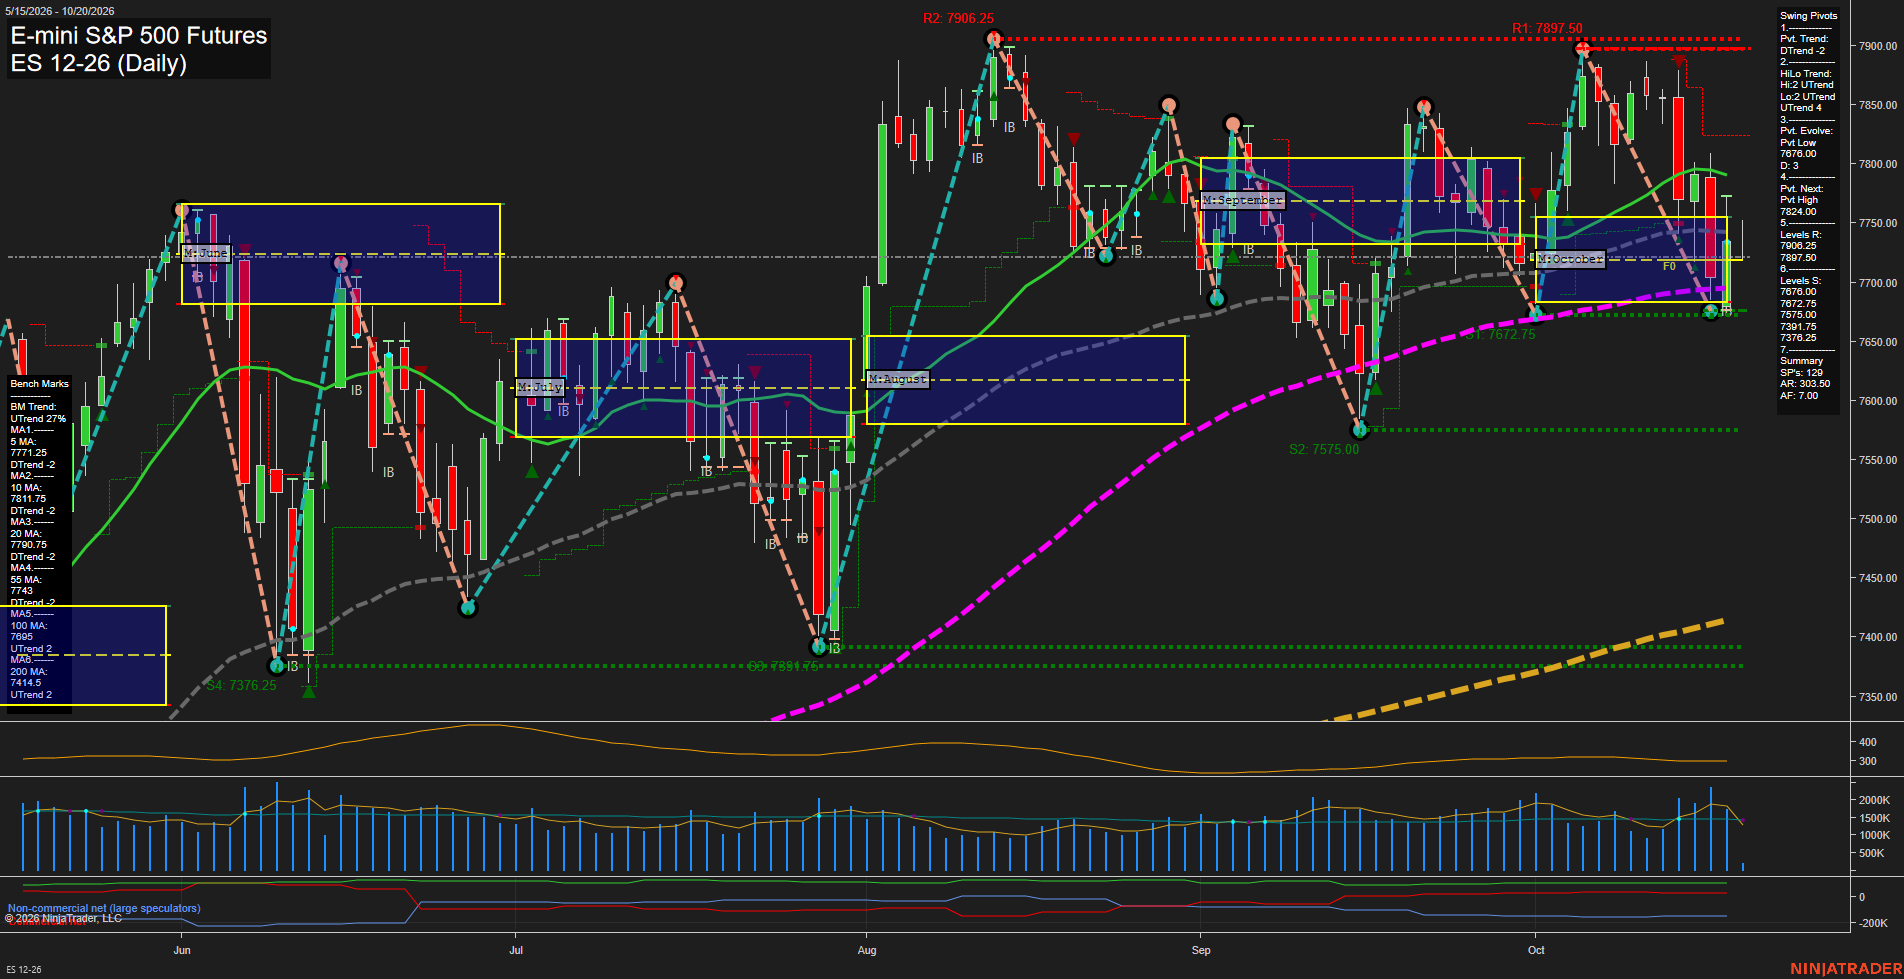
Overall Rating
- Short-Term: Bearish
- Intermediate-Term: Bearish
- Long-Term: Bullish.
Key Insights Summary
The daily structure reflects a short-term corrective downswing within a still constructive long-term advance. Price is below the 5, 10, 20, and 55-day benchmarks, while the pivot trend is DTrend and October MSFG remains below its F0% reference. The 7676 to 7657 support cluster has contained the latest selloff, producing a modest bounce, but momentum remains slow and price is still beneath nearby benchmark resistance. The intermediate HiLo trend remains positive and price holds above rising 100-day and 200-day averages, preserving the broader bullish structure. The current pattern is a volatile consolidation between support near 7676 and overhead pivot resistance at 7824, with major resistance concentrated near 7897.50 to 7906.25.
View charts on: AlphaWebTrader HTF Charts
NQ Daily View
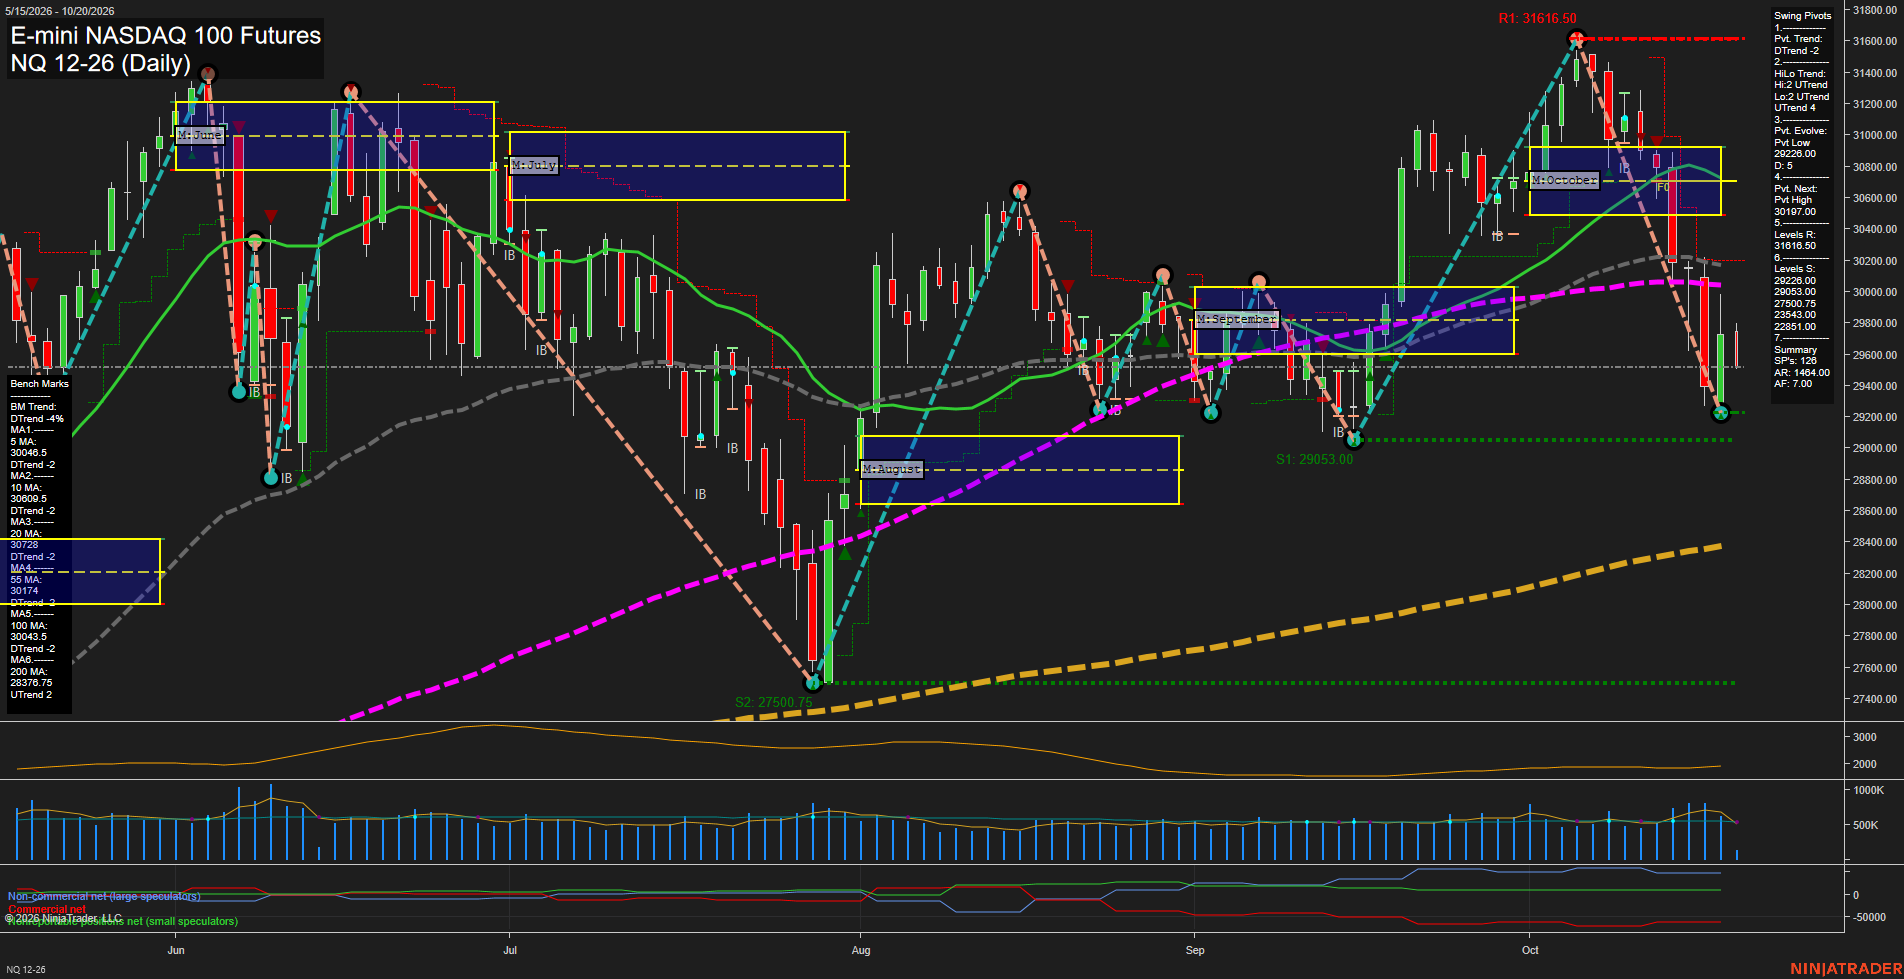
Overall Rating
- Short-Term: Bearish
- Intermediate-Term: Bearish
- Long-Term: Neutral.
Key Insights Summary
Price is rebounding from the 29226-29053 support zone after a sharp October decline, but the daily swing structure remains in a short-term DTrend and price remains beneath all benchmark averages from the 5-day through 100-day. The monthly grid remains below F0% and the clustered 30043-30728 moving-average area defines overhead countertrend resistance, with 30197 the next pivot reversal level. The broader yearly structure and rising 200-day average remain constructive, creating a mixed long-term backdrop while the current daily cycle is a volatile pullback from the 31616.50 swing high.
View charts on: AlphaWebTrader HTF Charts
CL Daily View
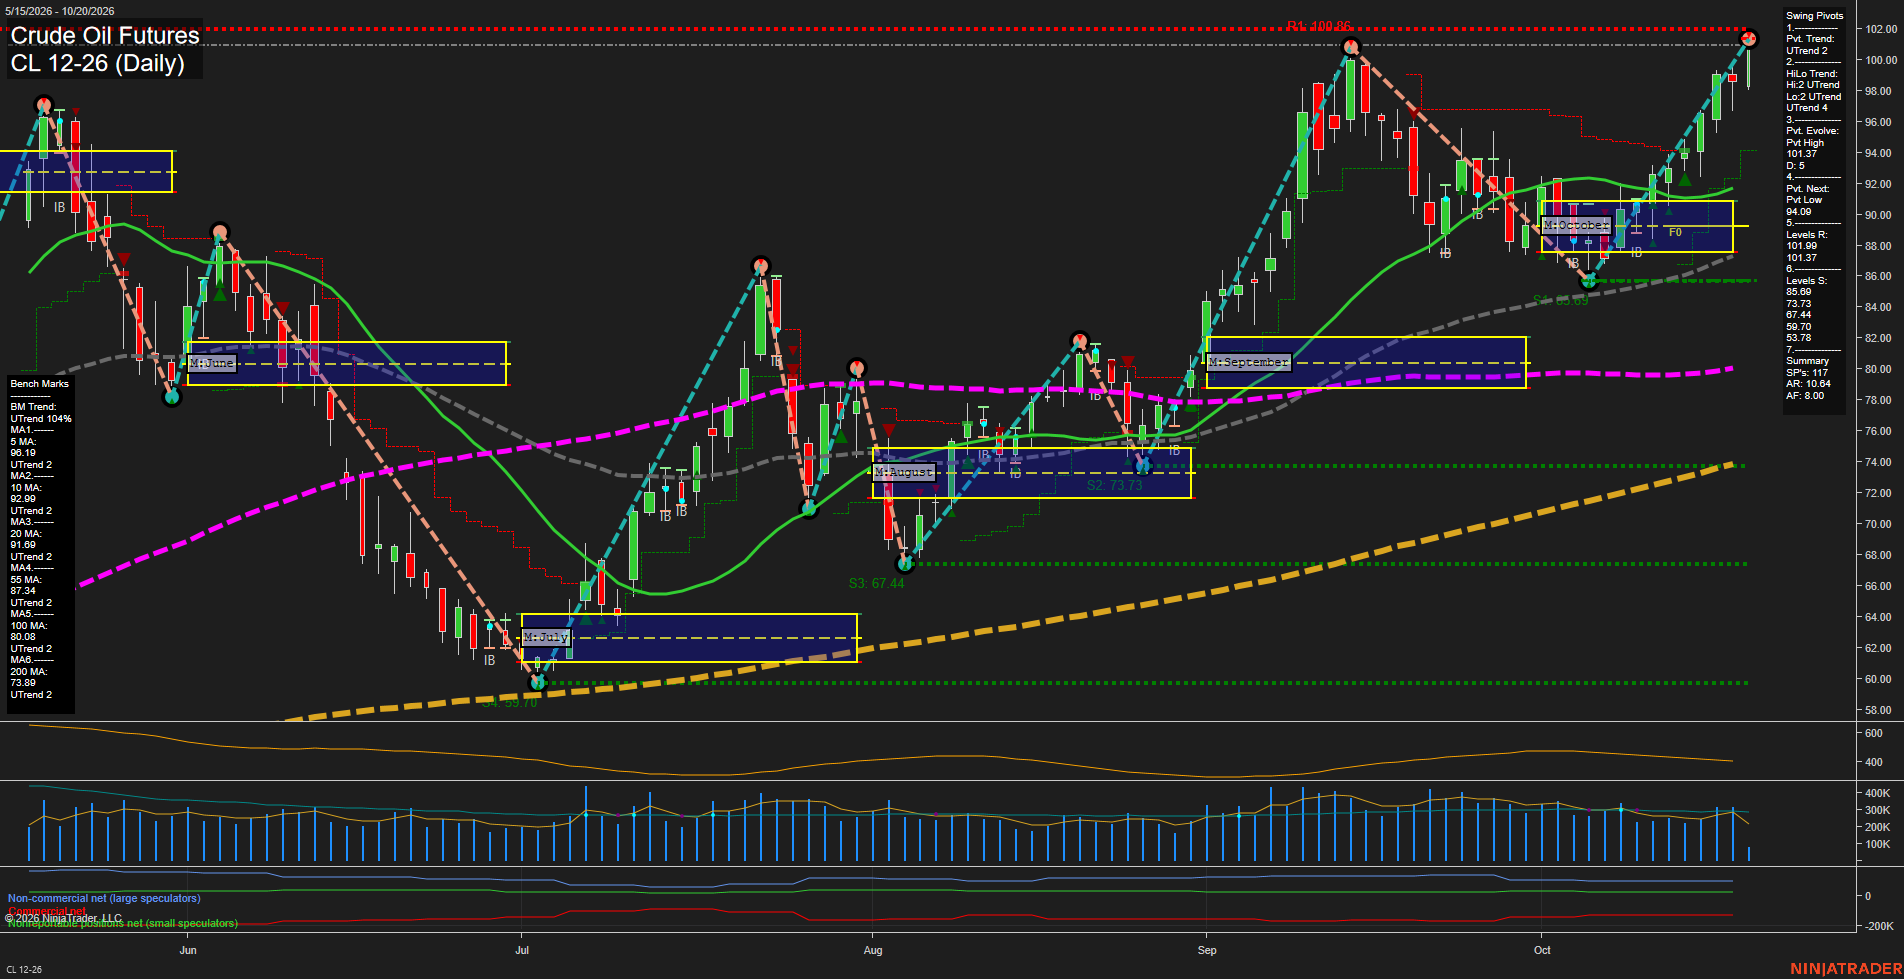
Overall Rating
- Short-Term: Bullish
- Intermediate-Term: Bullish
- Long-Term: Bullish.
Key Insights Summary
Price is in a broad multi-month advance, with higher pivot lows and a renewed push into the 100.86 to 101.37 resistance zone. Momentum is fast following the October recovery from the 85.69 support area, while price remains above every daily benchmark from the 5-day through 200-day average. The short-term pivot structure is bullish, though the active pivot-high area defines the immediate overhead test. Weekly, monthly, and yearly Fib-grid readings are all above their F0%/NTZ reference areas, aligning the short-, intermediate-, and long-term trend structure to the upside.
View charts on: AlphaWebTrader HTF Charts
GC Daily View
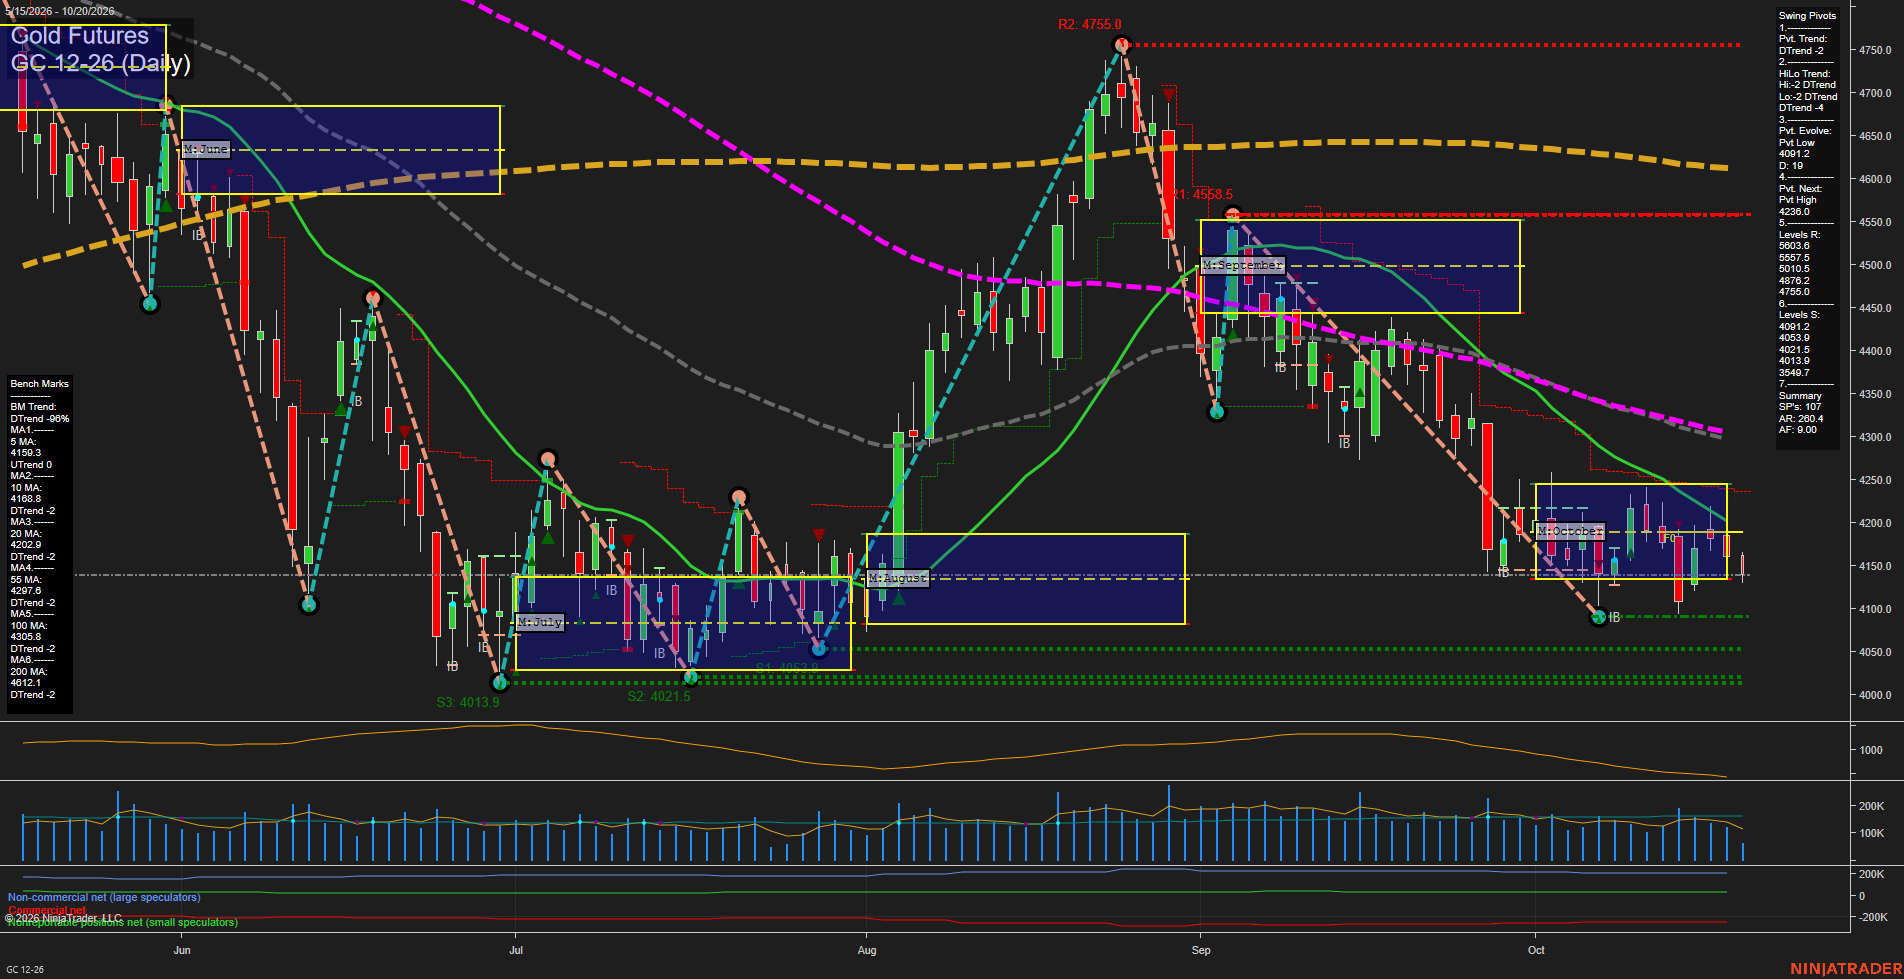
Overall Rating
- Short-Term: Bearish
- Intermediate-Term: Bearish
- Long-Term: Bearish.
Key Insights Summary
GC is in a broad daily-chart decline, with price beneath the weekly, monthly, and yearly Fib-grid centers and below every benchmark moving average except for a marginally rising 5-day average. The pivot structure remains bearish, defined by lower highs and lower lows from the late-August peak, while the current October consolidation is holding above the 4091.2 pivot low. The 4138 area is below the 5-, 10-, and 20-day averages, reinforcing weak short-term participation. A move through the evolving 4091.2 low would extend the established downside sequence toward clustered supports at 4053.9 to 4013.9, while 4236.0 is the next pivot-reversal reference and initial structural resistance. ATR remains elevated, reflecting a volatile correction/consolidation phase following the sharp September selloff.
View charts on: AlphaWebTrader HTF Charts
ZB Daily View
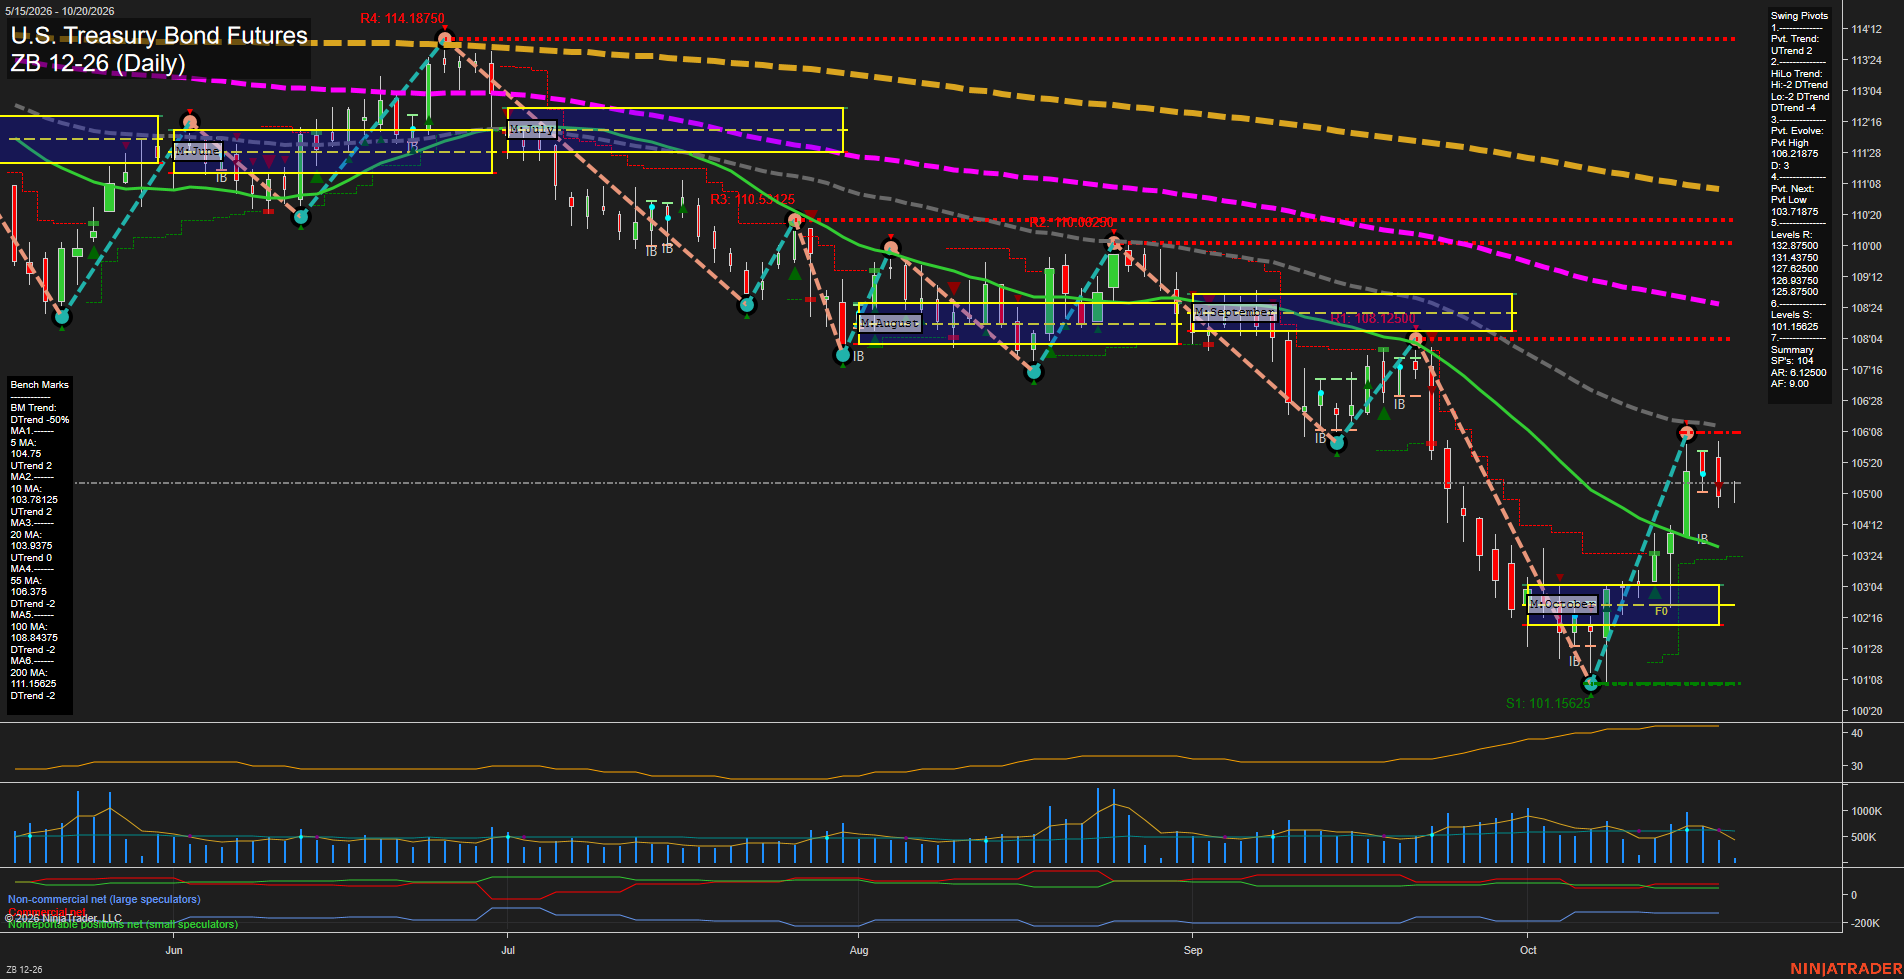
Overall Rating
- Short-Term: Bullish
- Intermediate-Term: Neutral
- Long-Term: Bearish.
Key Insights Summary
Price remains in a short-term recovery structure following the October washout near 101'05, supported by an UTrend pivot condition and rising 5, 10, and 20-day benchmarks. The rebound stalled beneath the 55-day benchmark and the 106'23 pivot high, producing a pullback from the recent recovery peak. Weekly fib positioning remains below its F0%/NTZ area, while the monthly grid remains constructive above its F0% level. The intermediate picture is mixed as the monthly trend is up but the HiLo pivot structure remains in a DTrend. Longer-term structure remains bearish, with price below the declining 55, 100, and 200-day benchmarks and the yearly grid below equilibrium. Volume is moderate relative to the recent rebound, while ATR near 35 reflects an active but contained daily swing environment.
View charts on: AlphaWebTrader HTF Charts