NYSE pre-market radar for May 28, 2026 highlights ETF movers, mostly bullish U.S. futures, and mixed FDAX as traders await PCE, GDP, and claims.
Fundamentals: U.S. equities remained firm after the Dow and Nasdaq closed at record highs, while the S&P 500 extended its winning streak. Risk sentiment stayed supported by AI and semiconductor strength, even as renewed U.S.-Iran tensions pushed oil higher and kept inflation concerns in view. Thursday’s calendar includes PCE, GDP, jobless claims, and new home sales.
Technicals: NYSE pre-market session data shows ETF prior-close movers led by META, AMZN, and TSLA, while IBIT, GLD, and USO finished lower. Futures index analysis remains broadly bullish across ES, NQ, EMD, and RTY on both weekly and daily timeframes, with prices near recent highs. FDAX is the main mixed market, holding a longer-term bullish backdrop while short-term momentum has turned weaker.
Pre-Market Trading 360° view Market Radar of: holidays, earnings, eco-news, market-news summary, news sentiment, prior session major ETFs, MAG7, Higher Time Frame Analysis Indices Futures Summary, and E-mini S&P500, Nasdaq 100, NYMEX Crude, Gold Futures Daily Chart analysis.
As of: May 28, 2026 07:16 CT
EcoNews Radar U.S. Events
| Day | Time | Impact | Event |
|---|---|---|---|
| Thu | 08:30 | High | Core PCE Price Index m/m |
| Thu | 08:30 | High | Prelim GDP q/q |
| Thu | 08:30 | Medium | Prelim GDP Price Index q/q |
| Thu | 08:30 | Medium | Unemployment Claims |
| Thu | 10:00 | Medium | New Home Sales |
| Thu | 12:00 | Low | Crude Oil Inventories |
EcoNews Summary
Thursday features the week’s key U.S. macro release cluster at 08:30, led by Core PCE Price Index m/m and Prelim GDP q/q. Core PCE tracks underlying consumer inflation and remains a primary Federal Reserve inflation gauge, while GDP measures the pace of economic growth. These releases are major market-moving inputs for index futures because they shape rate expectations, growth sentiment, and volatility around the data window.
Event Notes:
- Thursday 08:30 Core PCE Price Index m/m: measures month-over-month change in core personal consumption expenditures prices, excluding food and energy; traders watch it as a key inflation gauge tied to Fed policy sensitivity.
- Thursday 08:30 Prelim GDP q/q: measures the annualized quarter-over-quarter change in U.S. economic output; traders monitor it for growth momentum and its impact on rates, equities, and risk appetite.
Conclusion:
The single most important event of the week is Thursday 08:30 Core PCE Price Index m/m, with Prelim GDP q/q as the other major release at the same time. Momentum and volume often slow ahead of major events such as PCE and GDP, with increased volatility at release time. These 08:30 releases set the tone for broader index futures direction by refining inflation and growth expectations.
For full details visit: Forex Factory EcoNews
Market News Summary:
Risk-on equity sentiment persists, while Middle East tensions keep oil volatile and inflation concerns in focus.
Primary Drivers & Risks:
- Primary Driver: Geopolitical oil supply shocks
- Primary Risk: Inflation pressure from energy
Tone:
Mixed, with equity momentum offset by energy-driven risk.
Stock Market / ETFs / Indices:
U.S. equities held firm after the Dow Jones Industrial Average and Nasdaq Composite closed at record highs, while the S&P 500 extended its winning streak. Foreign buying of Japanese stocks continued alongside an AI-led rally, and headlines noted broad enthusiasm around semiconductor and tech strength alongside warnings against chasing parabolic moves.
Geopolitical:
U.S.-Iran tensions remained central, with fresh strikes, retaliatory rhetoric, and ongoing peace talks driving sharp risk shifts. Reports on the Strait of Hormuz, transponders turned off, and ceasefire uncertainty kept geopolitical stress elevated.
Oil / Energy:
Oil moved sharply higher on renewed strike headlines, sanctions pressure, and supply-risk concerns tied to Iran and the Gulf. WTI and Brent rebounded above key levels, while comments on persistent energy inflation reinforced the focus on oil as a market driver.
Gold / Metals:
Gold edged lower in early trade as Middle East tensions and inflation worries persisted, though sentiment indicators moved toward a first buy signal since 2022.
Fed / Financials:
Fed commentary stayed centered on inflation, with Kashkari and Goolsbee emphasizing price stability and persistent energy inflation. Separately, the consumer watchdog news added a policy and regulatory backdrop for financials.
Macro / Other:
Data and corporate headlines pointed to a resilient but selective risk environment, including record prediction-market volumes and weaker auto demand. Japan rate-hike discussion, Korean policy steadying, and strong market momentum added to the cross-asset backdrop.
Conclusion:
Oil and geopolitics are the main drivers, with strike headlines and Iran-related supply fears moving energy markets sharply higher. Equities remain supported by momentum and AI leadership, even as inflation-sensitive assets react to firmer crude.
Secondary drivers include Fed focus on inflation, gold’s mixed setup, and broader cross-asset signals from Japan, Korea, and financial regulation. The main cross-current is a strong equity tone against a volatile energy and geopolitics backdrop.
Market News Sentiment
Market News Articles: 36
- Neutral: 47.22%
- Positive: 30.56%
- Negative: 22.22%
Sentiment Summary: Market news is mostly neutral at 47%, with positive coverage at 31% and negative coverage at 22%, indicating a balanced tone overall.
Conclusion: The news flow shows no dominant direction, with neutral articles leading and positive coverage modestly above negative coverage.
GLD,Gold Articles: 10
- Negative: 50.00%
- Neutral: 30.00%
- Positive: 20.00%
Sentiment Summary: Gold-related coverage is mostly negative, with 50% negative, 30% neutral, and 20% positive articles across 10 items.
Conclusion: The article mix is skewed toward negative sentiment, with negative coverage exceeding positive and neutral coverage.
USO,Oil Articles: 18
- Positive: 44.44%
- Negative: 33.33%
- Neutral: 22.22%
Sentiment Summary: USO/oil news flow is mixed to mildly positive, with 44% positive, 33% negative, and 22% neutral articles across 18 items.
Conclusion: The sentiment profile is not one-sided, with positive coverage slightly exceeding negative coverage and a meaningful neutral share.
Market Data Snapshot
ETF Snapshot of major stock market ETFs, Mag7, and others as of: May 28, 2026 07:16
Top Movers & Losers
- META 635.25 Bullish 3.74% ▲
- AMZN 271.85 Bullish 2.47% ▲
- TSLA 440.36 Bullish 1.56% ▲
- IBIT 42.45 Bearish -1.26% ▼
- GLD 408.49 Bearish -1.33% ▼
- USO 131.03 Bearish -4.36% ▼
Major Index ETFs: SPY, QQQ, DIA, IWM, IJH
- DIA 506.88 Bullish 0.32% ▲
- SPY 750.46 Bearish -0.02% ▼
- IWM 290.37 Bearish -0.05% ▼
- QQQ 729.45 Bearish -0.11% ▼
- IJH 74.36 Bearish -0.39% ▼
Mixed tape across the index ETF group: DIA was the most bullish mover at +0.32%, while IJH was the most bearish mover at -0.39%. SPY was essentially flat at -0.02%, with IWM at -0.05% and QQQ at -0.11%, all showing mild bearish pressure.
Mag 7 Stocks: AAPL, MSFT, GOOG, AMZN, META, NVDA, TSLA
- META 635.25 Bullish 3.74% ▲
- AMZN 271.85 Bullish 2.47% ▲
- TSLA 440.36 Bullish 1.56% ▲
- AAPL 310.85 Bullish 0.82% ▲
- GOOG 384.83 Bearish -0.00% ▼
- MSFT 412.67 Bearish -0.81% ▼
- NVDA 212.60 Bearish -1.05% ▼
Mixed Mag7 tone: META led as the most bullish mover at +3.74%, followed by AMZN at +2.47%, TSLA at +1.56%, and AAPL at +0.82%; GOOG was essentially flat at -0.00%, while MSFT at -0.81% and NVDA at -1.05% were the most bearish movers, with NVDA showing the largest net loss.
Cross-Market ETFs: TLT, GLD, USO, IBIT
- TLT 85.30 Bullish 0.23% ▲
- IBIT 42.45 Bearish -1.26% ▼
- GLD 408.49 Bearish -1.33% ▼
- USO 131.03 Bearish -4.36% ▼
Mixed tone across the group: TLT was the most bullish mover at +0.23%, while USO was the most bearish mover at -4.36%; GLD also fell -1.33% and IBIT declined -1.26%.
ETF, Mag7, and Cross-Market ETF Insights
Overall Tone
Mixed, with selective bullish leadership in parts of Mag7 and the broader index ETFs holding close to flat, while cross-market ETFs lean more defensive and commodity-linked weakness is evident.
Equity ETFs and Mag7:
Among the major index ETFs, DIA was the most bullish at +0.32%, while IJH was the most bearish at -0.39%; SPY -0.02%, IWM -0.05%, and QQQ -0.11% were near-flat to slightly lower, signaling a mixed tape rather than broad alignment. In Mag7, META led decisively at +3.74%, followed by AMZN +2.47% and TSLA +1.56%, while NVDA was the most bearish at -1.05% and MSFT also slipped -0.81%. Overall, equities were selective: strength was concentrated in META and AMZN, while several index proxies and mega-cap names were subdued.
Cross-Market ETFs:
Cross-market flows were mixed to weak versus equities, with TLT the only bullish mover at +0.23%, suggesting modest support in duration. GLD declined -1.33%, IBIT fell -1.26%, and USO was the most bearish across the entire snapshot at -4.36%, showing broad softness in commodities and digital-asset exposure. The split between slightly firmer bonds and weaker gold, oil, and IBIT points to divergence outside equities rather than a broad risk-on confirmation.
Futures Indices – Higher Time Frame Analysis
Summary of the current state of US Indices Futures based on higher time-frame (HTF) technical analysis as of: 2026-05-28: 07:16 CT.
US Indices Futures
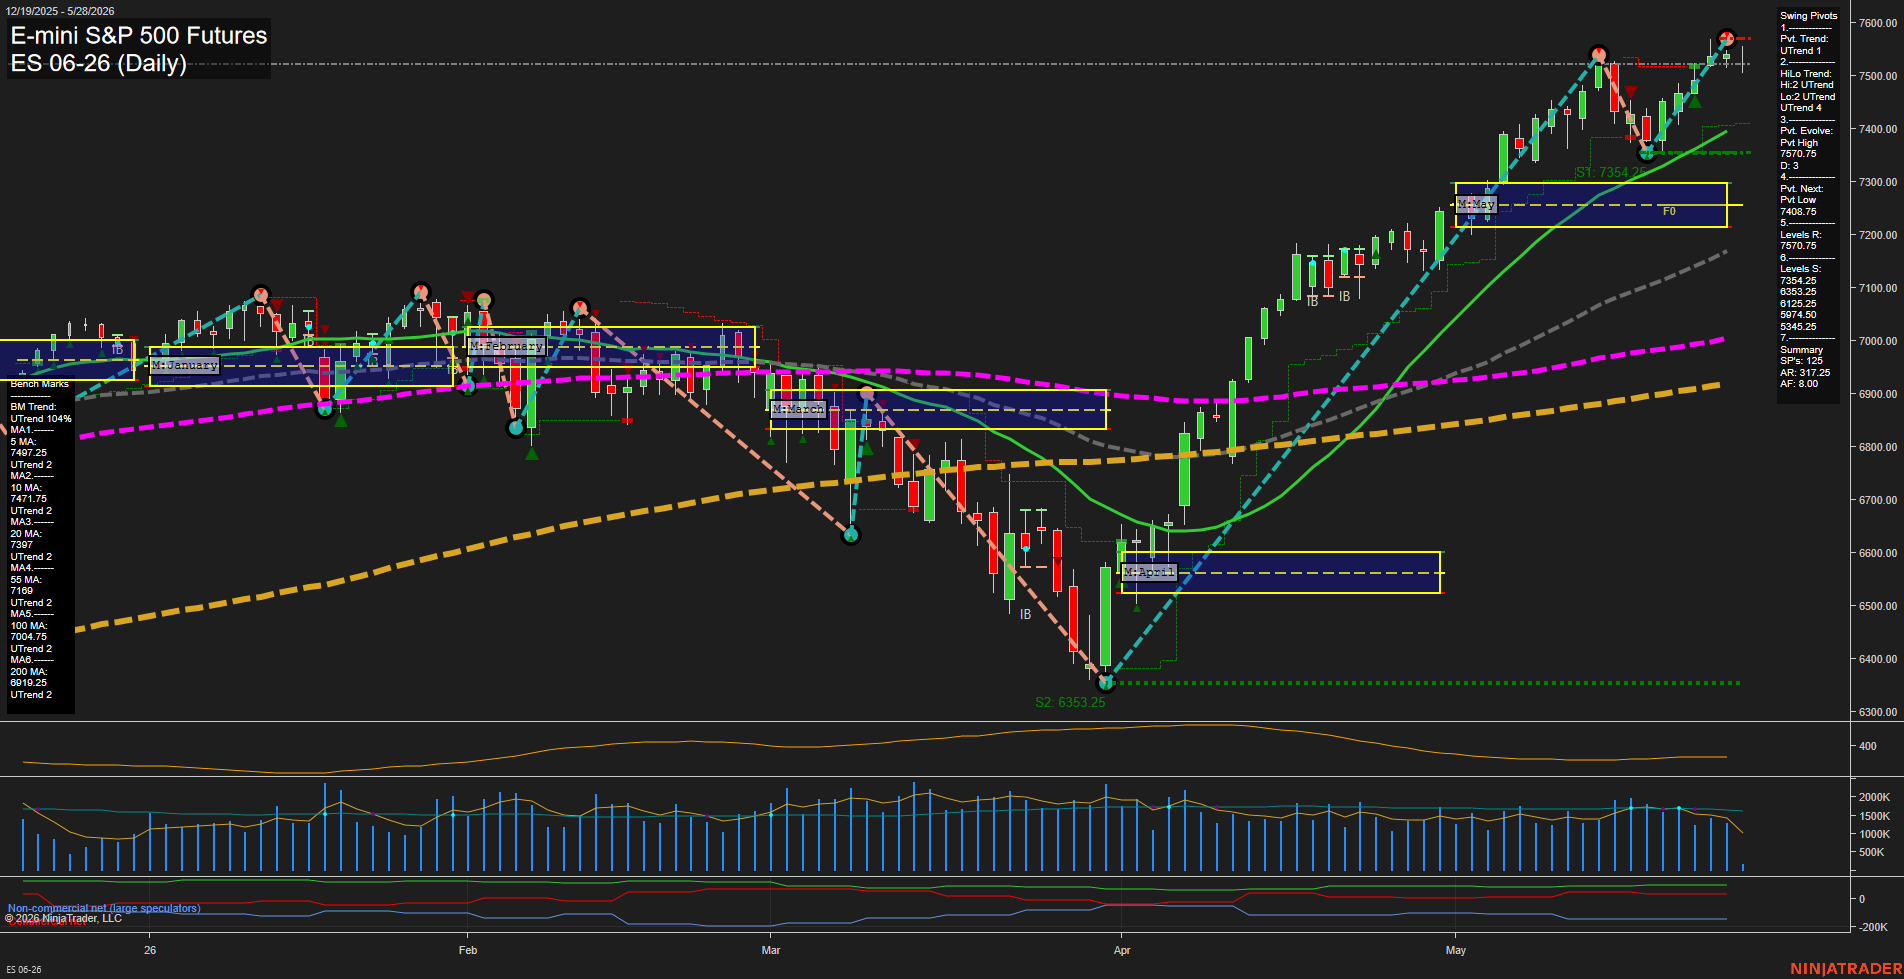
- ES YSFG/MSFG/WSFG above F0% with price near highs, benchmarks stacked bullish, swing UTrend intact, resistance at 7570.75, support at prior pivot shelves.
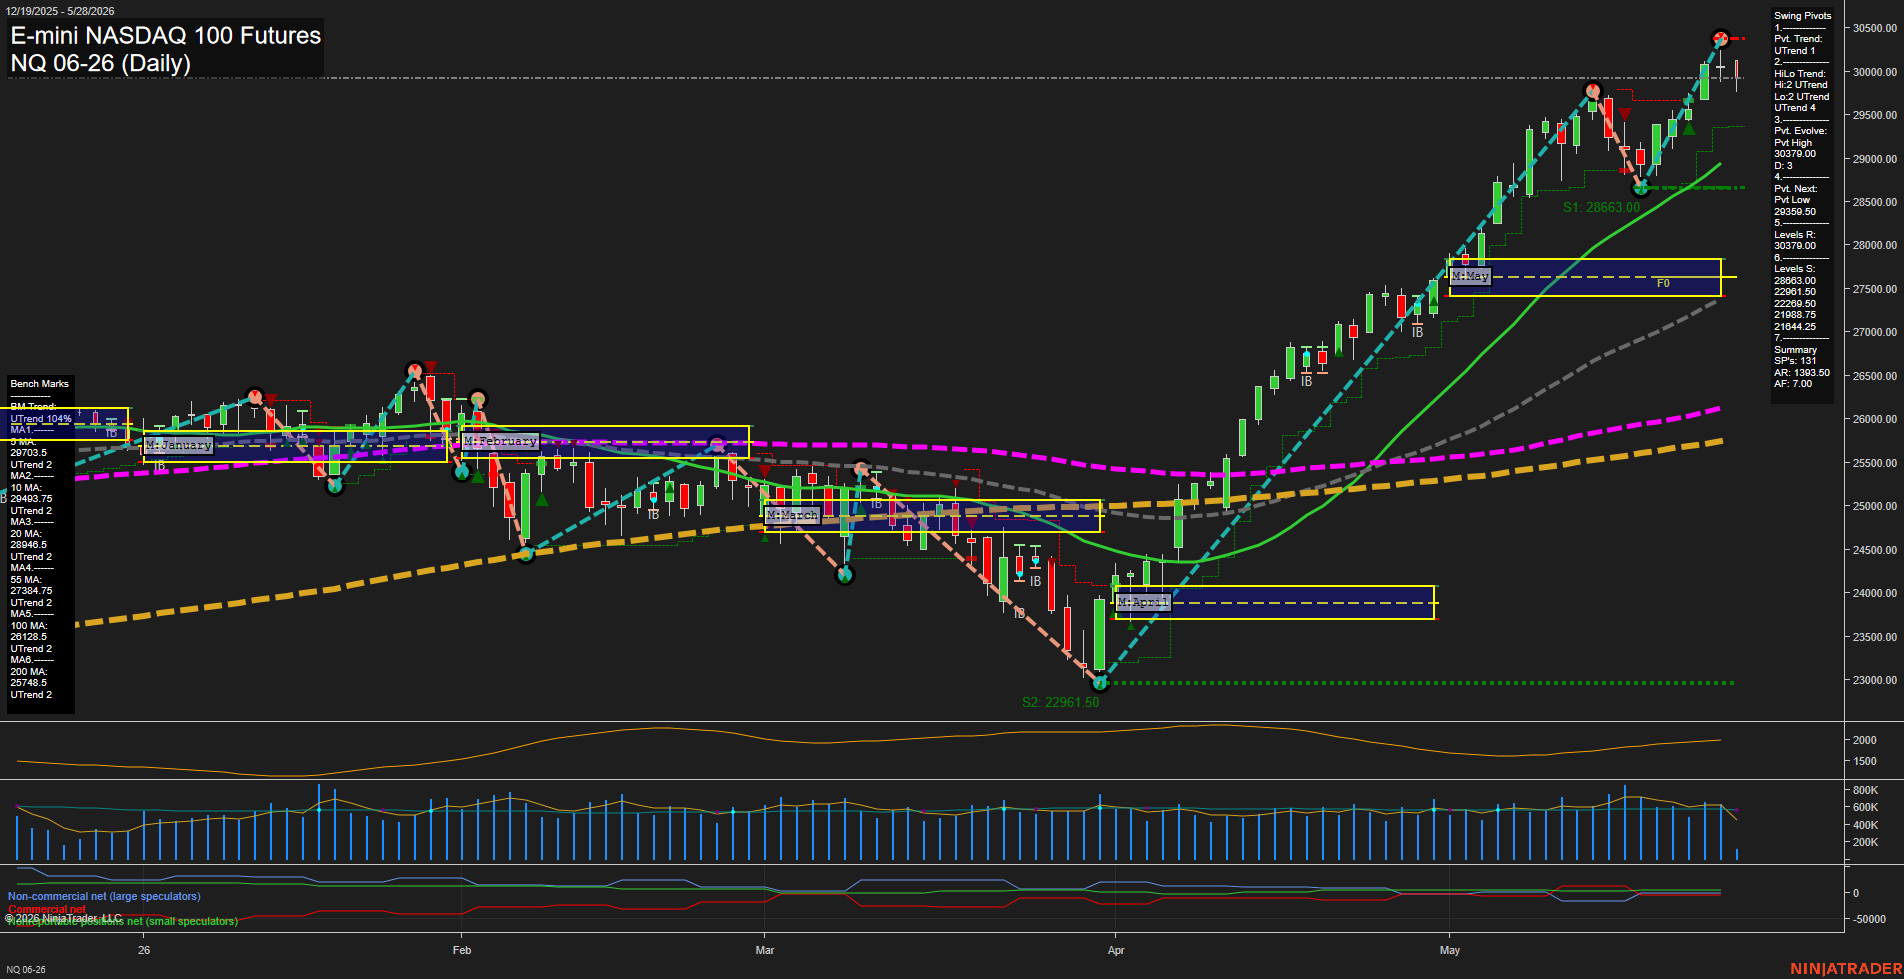
- NQ YSFG/MSFG/WSFG above NTZ midlines, benchmarks in bullish order, swing UTrend intact, price near 30379 highs, support below at prior breakout and April low structure.
- YM YSFG/MSFG bullish, WSFG below center with short-term down bias, benchmarks still rising, swing trend higher, resistance near 51209, support at prior pivot and benchmark shelf.
- EMD YSFG/MSFG/WSFG aligned bullish, benchmarks stacked higher, UTrend sequence intact, price pressing new highs, next key support near 3454.7 prior pivot low.
- RTY YSFG/MSFG/WSFG above F0%/NTZ, benchmarks stacked upward, clean UTrend, price in discovery near 2952 pivot high, support layers below from prior breakout zones.
- FDAX YSFG below F0%/NTZ on short-term, MSFG/YSFG still constructive, benchmarks bullish on higher frames, short-term short signal active, resistance 25494/25666/25854, support 24618.
Overall State
- Short-Term: Bullish
- Intermediate-Term: Bullish
- Long-Term: Bullish
Conclusion
HTF structure remains broadly aligned to the upside across ES, NQ, EMD, and RTY, with YSFG, MSFG, and WSFG generally holding above equilibrium and benchmark averages stacked higher. YM remains mixed on the short-term WSFG, and FDAX shows short-term weakness against a still-bullish higher-timeframe backdrop. Major swing pivots are being tested or exceeded in ES, NQ, EMD, and RTY, while YM and FDAX sit closer to active resistance and nearby support shelves. Overall directional correlation remains constructive across the US indices, with short-term divergence most evident in YM and FDAX.
Note: Intra-day counter-trend pullbacks or retracements may occur, HTF is context for informational usage and market structure. Glossary: Session Fib Grids periods of YSFG:’Yearly’, MSFG:’Monthly’, WSFG:’Weekly’
For full details visit: AlphaWebTrader Technicals
ES Daily View
Overall Rating
- Short-Term: Bullish
- Intermediate-Term: Bullish
- Long-Term: Bullish.
Key Insights Summary
Price is pressing near the upper end of the recent expansion move, with the daily structure still firmly trend-aligned to the upside across pivots, benchmarks, and session fib grids. The rebound from the April low built a strong higher-low sequence and then accelerated into a fast rally, leaving price well above the 20, 55, 100, and 200 day benchmarks. The short-term swing state remains UTrend with the next pivot setting still lower, reflecting an active uptrend that has not yet printed a meaningful reversal. The current posture shows trend continuation strength after a sharp recovery, with recent candles clustered near the highs and volatility elevated relative to the prior consolidation range.
View charts on: AlphaWebTrader HTF Charts
NQ Daily View
Overall Rating
- Short-Term: Bullish
- Intermediate-Term: Bullish
- Long-Term: Bullish.
Key Insights Summary
The daily structure remains firmly trend-positive, with price holding well above the full stack of benchmark moving averages and the pivot trend aligned higher across both short-term and intermediate-term measures. May completed as a fully expanded monthly session fib grid, showing price acceptance above the F0% midpoint and a clean push into the prior 30379 pivot high area before a modest pullback. The chart reflects a strong uptrend with higher highs and higher lows, a pronounced V-shaped recovery from the April low near 22961.50, and continued strength even after the recent test-and-reject sequence near the highs. Momentum remains elevated, the range expansion is large, and the recent candles show consolidation just below resistance after the sharp rally phase.
View charts on: AlphaWebTrader HTF Charts
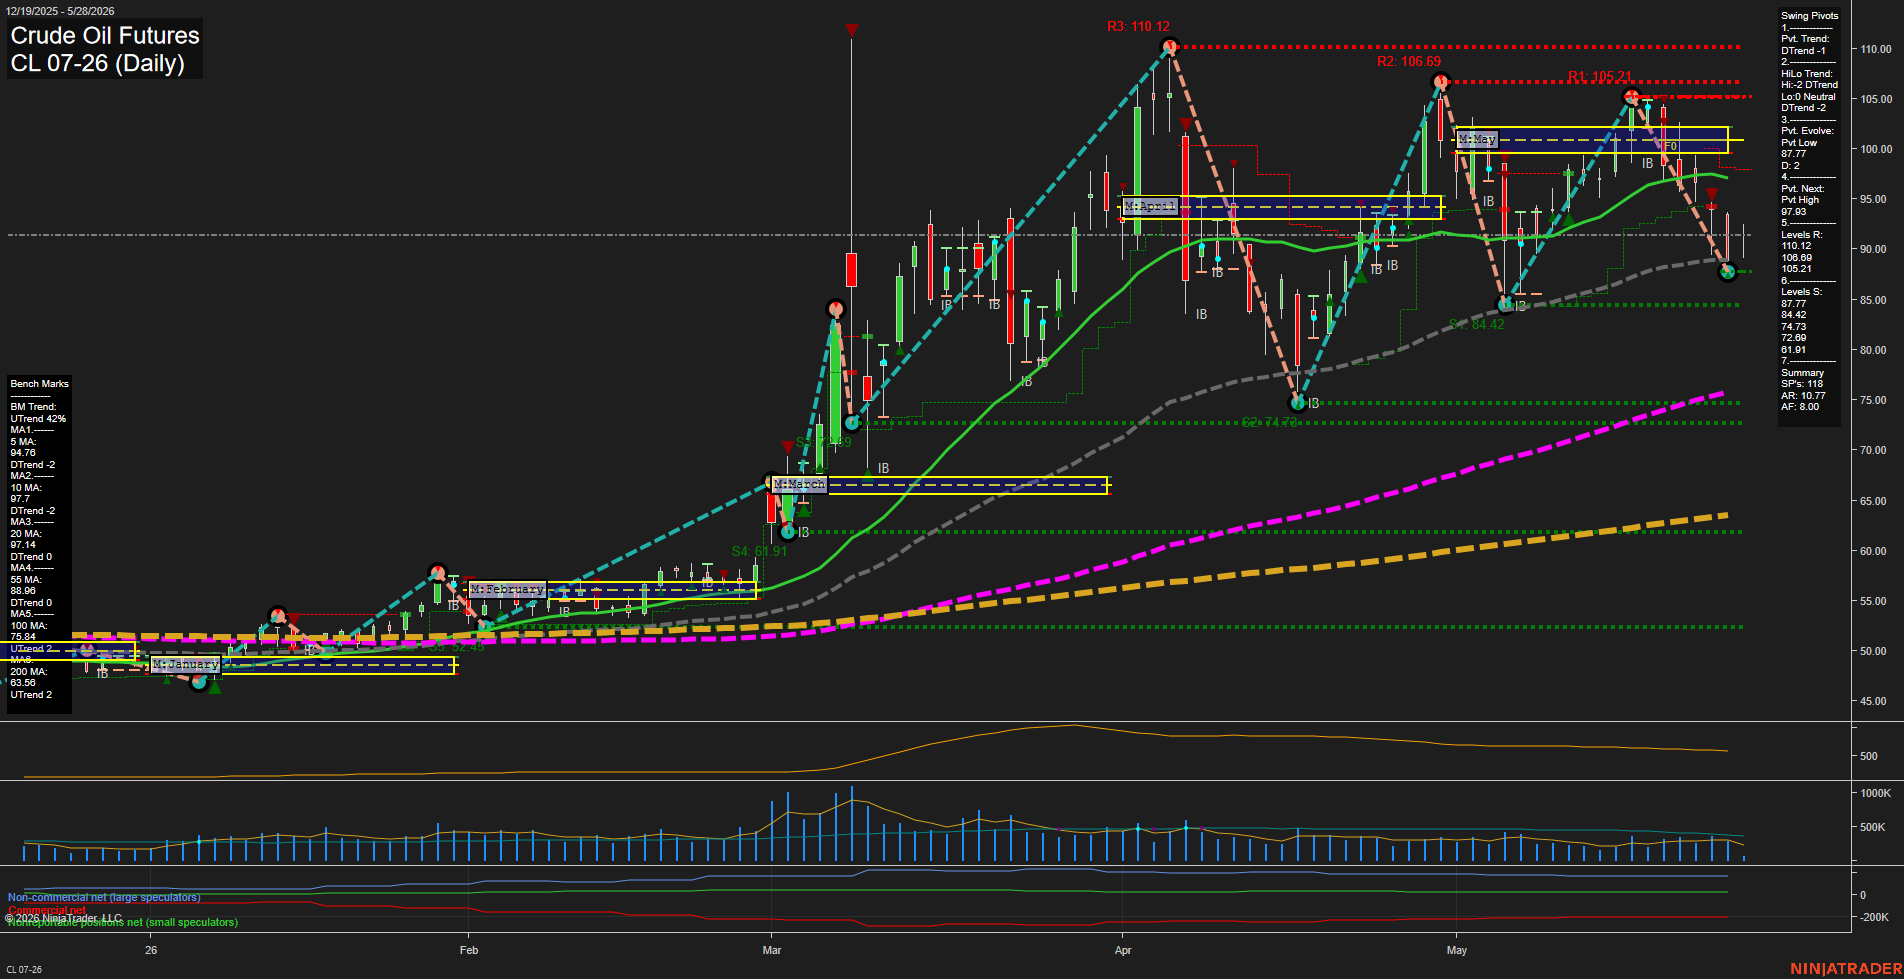
CL Daily View
Overall Rating
- Short-Term: Bearish
- Intermediate-Term: Bearish
- Long-Term: Bullish.
Key Insights Summary
Crude Oil is in a corrective swing phase after a sharp spring rally, with the daily structure now pressing back into the lower pivot band near 87.77. Short-term and monthly session fib grids both sit below F0% and remain in down bias, aligning with the sequence of lower highs and the recent downside pivot evolution. The 5, 10, 20, and 55 day benchmarks are all sloping down, confirming a weak tactical backdrop, while the 100 and 200 day benchmarks still hold uptrend status, keeping the broader yearly structure constructive. Swing pivot levels show nearby overhead resistance clustered at 105.21, 106.69, and 110.12, while layered support extends through 84.42, 74.73, 72.69, and 61.91. The recent short signals across WSFG, TR720, MSFG, and TR120 reinforce the current bearish swing tone, even as the longer-term trend remains upward.
View charts on: AlphaWebTrader HTF Charts
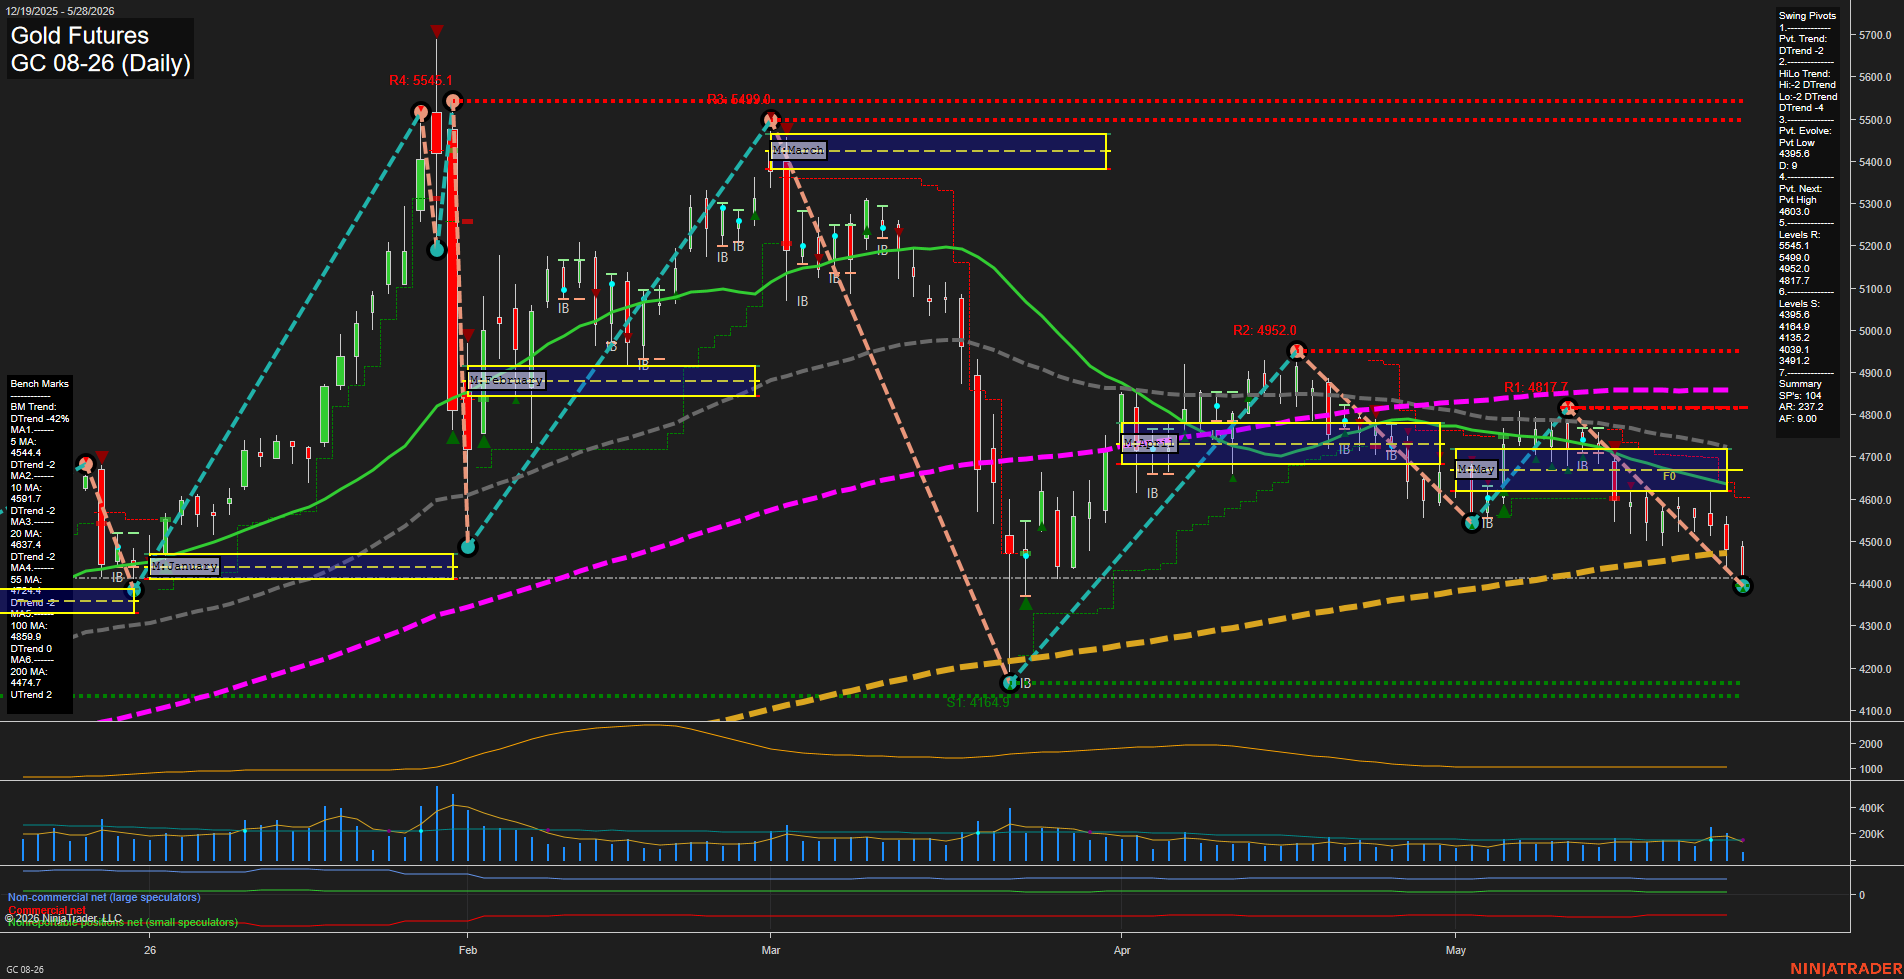
GC Daily View
Overall Rating
- Short-Term: Bearish
- Intermediate-Term: Bearish
- Long-Term: Bearish.
Key Insights Summary
Gold futures are in a firm downtrend with price pressed below the weekly, monthly, and yearly F0/NTZ levels, while the short-term pivot structure remains DTrend and the benchmark stack is broadly bearish across the 5, 10, 20, 55, and 100 day averages. The recent swing failed below the 4817.7 resistance zone and has continued to rotate lower toward the 4385.6 support area, with momentum accelerating on the latest decline. The chart shows lower highs and lower lows, rejection from prior pivot resistance, and no evidence of a durable trend reversal in the current structure.
View charts on: AlphaWebTrader HTF Charts