NYSE pre-market radar tracks ETF movers and U.S. futures as oil, yields, tariffs and technology weakness weigh on short-term market sentiment.
Fundamentals: Global risk sentiment weakened as unresolved U.S.-Iran hostilities, Red Sea shipping disruptions and elevated oil prices raised inflation and growth concerns. Technology and chip shares remained under pressure amid scrutiny of AI spending, while higher Treasury yields and new U.S. tariffs added to the risk-off backdrop. U.S. futures stabilized after Brent crude retreated below $100.
Technicals: Pre-market market radar highlights prior-session strength in USO alongside sharp losses in AMZN, GOOG and TSLA. ES, NQ, YM and RTY futures show bearish short-term and intermediate structures after recent pullbacks, while long-term trends remain broadly constructive. EMD is consolidating with mixed daily signals, and FDAX holds a bullish weekly structure despite a bearish daily setup.
Pre-Market Trading 360° view Market Radar of: holidays, earnings, eco-news, market-news summary, news sentiment, prior session major ETFs, MAG7, Higher Time Frame Analysis Indices Futures Summary, and E-mini S&P500, Nasdaq 100, NYMEX Crude, Gold Futures Daily Chart analysis.
As of: July 24, 2026 07:16 CT
Earnings Radar
Monitoring for earnings releases by the Magnificent 7, AI-tech-related firms, and major financial institutions.
- AAPL Release: 2026-07-30 T:AMC
- AMZN Release: 2026-07-30 T:AMC
- META Release: 2026-07-29 T:AMC
- MSFT Release: 2026-07-29 T:AMC
Conclusion: Index futures face concentrated late-July earnings event risk: META and MSFT report AMC July 29, followed by AAPL and AMZN AMC July 30. These four major index constituents concentrate broad technology and growth-sector market impact across consecutive sessions; market momentum and volume can slow ahead of these major tech earnings releases.
For full details visit: Yahoo Earnings Calendar
Market News Summary:
Global risk sentiment weakened as the U.S.-Iran conflict, elevated oil prices, tariff actions, and pressure on major technology shares dominated market attention.
Primary Drivers & Risks:
- Primary Driver: Iran conflict and oil shock
- Primary Risk: Stagflation and tariff escalation
Tone:
Risk-off, with futures stabilizing after oil retreated below $100.
Stock Market / ETFs / Indices:
U.S. stocks sold off alongside a sharp decline in technology and chip shares, with concerns over AI spending removing about $890 billion in value from the Magnificent Seven. Japan’s Nikkei fell 2.3% in early trade as technology weakness and energy-cost concerns weighed on Asian equities. U.S. futures stabilized after oil moved below $100, while recent S&P 500 declines coincided with a sharp drop in AAII bullish sentiment.
Geopolitical:
Hostilities between the U.S. and Iran remained unresolved, while Iran-backed Houthi attacks on commercial vessels and Saudi oil tankers opened the Red Sea as an additional shipping chokepoint. The U.S. imposed new 10% to 12.5% tariffs on 60 trading partners, including Canada, India, the EU, and Taiwan. U.S.-China trade stabilization was described as a “gentleman’s agreement,” but AI and chip-security tensions remained active.
Oil / Energy:
Brent crude exceeded $100 amid the widening Iran conflict, Red Sea shipping disruptions, and temporary Kazakhstan output cuts. Prices later fell below $100 after no fresh overnight escalation, but remained elevated as regional tensions persisted. Higher fuel costs were cited alongside rising borrowing costs as a factor behind equity-market weakness.
Gold / Metals:
Gold and silver remained under pressure from a stronger U.S. dollar and higher interest-rate expectations. Precious metals traded near key technical levels, while central-bank demand and upcoming Fed expectations remained part of the market backdrop.
Fed / Financials:
Higher interest-rate expectations supported the dollar and pressured gold. U.S. bank ETFs outperformed broader financials on strong investment-banking and equity-trading revenue, though commentary questioned the durability of those earnings drivers. Treasury yields reached their highest levels of President Trump’s second term amid the oil-driven market move.
Macro / Other:
Renewed oil strength revived stagflation concerns, reflecting the combination of higher inflation pressure and weaker growth sentiment. Tariffs across major trading partners added another potential cost and trade-policy cross-current. AI earnings growth remained concentrated in semiconductor and infrastructure companies, with depreciation risk tied to elevated capital spending.
Conclusion:
The central market driver is the U.S.-Iran conflict and its impact on oil, shipping routes, inflation concerns, and global equity sentiment. Technology-sector pressure and higher yields added to the broad risk-off backdrop.
Oil’s retreat below $100 supported stabilization in U.S. futures, but Red Sea attacks and unresolved regional hostilities remained key cross-currents. New U.S. tariffs and persistent AI-related spending concerns added further pressure across global markets.
Market News Sentiment
Market News Articles: 42
- Neutral: 45.24%
- Negative: 42.86%
- Positive: 11.90%
Sentiment Summary: Market news sentiment is mixed-to-negative, with 45% neutral, 43% negative, and 12% positive coverage across 42 articles.
Conclusion: Indices futures headlines reflect limited positive support and a near-even balance between neutral and negative news.
GLD,Gold Articles: 11
- Neutral: 45.45%
- Positive: 27.27%
- Negative: 27.27%
Sentiment Summary: Gold-related coverage is neutral overall, with 45% neutral, 27% positive, and 27% negative articles.
Conclusion: The balanced positive and negative distribution indicates no clear directional sentiment signal from gold coverage for indices futures day traders.
USO,Oil Articles: 16
- Negative: 56.25%
- Positive: 25.00%
- Neutral: 18.75%
Sentiment Summary: USO and oil coverage is predominantly negative (56%), with 25% positive and 19% neutral articles.
Conclusion: The oil news tone is negative overall, which may be relevant context for indices futures day traders monitoring energy-related market sentiment.
Market Data Snapshot
ETF Snapshot of major stock market ETFs, Mag7, and others as of: July 24, 2026 07:16
Top Movers & Losers
- USO 139.49 Bullish 5.93% ▲
- IJH 75.45 Bearish -0.32% ▼
- TLT 83.17 Bearish -0.32% ▼
- AMZN 233.66 Bearish -4.57% ▼
- GOOG 318.34 Bearish -6.89% ▼
- TSLA 319.69 Bearish -14.52% ▼
Major Index ETFs: SPY, QQQ, DIA, IWM, IJH
- IJH 75.45 Bearish -0.32% ▼
- IWM 292.09 Bearish -0.58% ▼
- DIA 516.26 Bearish -1.00% ▼
- SPY 738.18 Bearish -1.23% ▼
- QQQ 691.96 Bearish -1.90% ▼
Major index ETFs are uniformly Bearish: QQQ leads the downside at -1.90%, followed by SPY at -1.23% and DIA at -1.00%. IWM is down -0.58%, while IJH is the least negative mover at -0.32%.
Mag 7 Stocks: AAPL, MSFT, GOOG, AMZN, META, NVDA, TSLA
- AAPL 321.66 Bearish -1.30% ▼
- NVDA 208.76 Bearish -1.56% ▼
- MSFT 381.58 Bearish -2.24% ▼
- META 606.10 Bearish -3.36% ▼
- AMZN 233.66 Bearish -4.57% ▼
- GOOG 318.34 Bearish -6.89% ▼
- TSLA 319.69 Bearish -14.52% ▼
Mag7 is Bearish across the group: TSLA leads losses at -14.52%, followed by GOOG at -6.89% and AMZN at -4.57%. AAPL is the least negative mover at -1.30%, while NVDA -1.56%, MSFT -2.24%, and META -3.36% remain Bearish.
Cross-Market ETFs: TLT, GLD, USO, IBIT
- USO 139.49 Bullish 5.93% ▲
- TLT 83.17 Bearish -0.32% ▼
- IBIT 36.65 Bearish -1.85% ▼
- GLD 371.52 Bearish -2.00% ▼
Other ETFs are Mixed: USO is the most bullish mover at +5.93%, while GLD is the most bearish mover at -2.00%. IBIT is Bearish at -1.85%, and TLT is Bearish with a modest -0.32% decline.
ETF, Mag7, and Cross-Market ETF Insights
Overall Tone
Bearish risk-off tone, with broad equity declines and a sharp energy gain providing the main cross-market divergence.
Equity ETFs and Mag7:
Major Index ETFs were broadly Bearish, led lower by QQQ at -1.90% and SPY at -1.23%, while IJH was the least negative mover at -0.32%. Mag7 performance was decisively Bearish and more severe than the index ETFs: AAPL was the least negative at -1.30%, while TSLA was the most bearish mover at -14.52%, followed by GOOG at -6.89% and AMZN at -4.57%. Equity weakness was broadly aligned rather than selective.
Cross-Market ETFs:
Cross-market action was Mixed: USO was the most bullish mover at +5.93%, diverging sharply from Bearish equities. TLT was only modestly lower at -0.32%, while IBIT fell -1.85% and GLD was the most bearish cross-market mover at -2.00%. Energy strength contrasted with weakness in gold, Bitcoin exposure, and equities.
Futures Indices – Higher Time Frame Analysis
Summary of the current state of US Indices Futures based on higher time-frame (HTF) technical analysis as of: 2026-07-24: 07:16 CT.
US Indices Futures
- ES: YSFG up; MSFG/WSFG below F0%; below 5-55 benchmarks, above rising 100/200; 7411.75 support, 7570.25 and 7693.50 resistance.
- NQ: YSFG up; MSFG/WSFG below F0%; below short-term benchmarks, above rising 100/200; 28408.25 pivot support, 29864.25 and 31090.00 resistance.
- YM: YSFG up; MSFG/WSFG below F0%; below short benchmarks, above rising 55-200; 51700 support, 52844 reversal level, 53656 resistance.
- EMD: YSFG above F0%, MSFG below F0%, WSFG up; rising weekly benchmarks; 3721.1 support, 3830.8 reversal level, 3892.4 resistance.
- RTY: YSFG and WSFG above F0%, MSFG below F0%; above rising long benchmarks; 2936.1 support, 3025.1 and 3068.4 resistance.
- FDAX: YSFG and WSFG above F0%, MSFG below F0%; above rising 100/200; 24715 support, 25443 reversal level, 26064 resistance.
Overall State
- Short-Term: Bearish
- Intermediate-Term: Bearish
- Long-Term: Bullish
Conclusion
ES, NQ, YM, RTY, and FDAX retain daily bearish pullback structures below monthly F0% references and short-term benchmarks. EMD is consolidating with neutral daily conditions. Yearly grids, rising longer-term benchmarks, and higher-order pivot structures remain upward across the group. Weekly conditions are firmer in EMD and FDAX, while ES remains weaker. Overhead pivot resistance caps recent recoveries; listed swing pivots define nearby support.
Note: Intra-day counter-trend pullbacks or retracements may occur, HTF is context for informational usage and market structure. Glossary: Session Fib Grids periods of YSFG:’Yearly’, MSFG:’Monthly’, WSFG:’Weekly’
For full details visit: AlphaWebTrader Technicals
ES Daily View
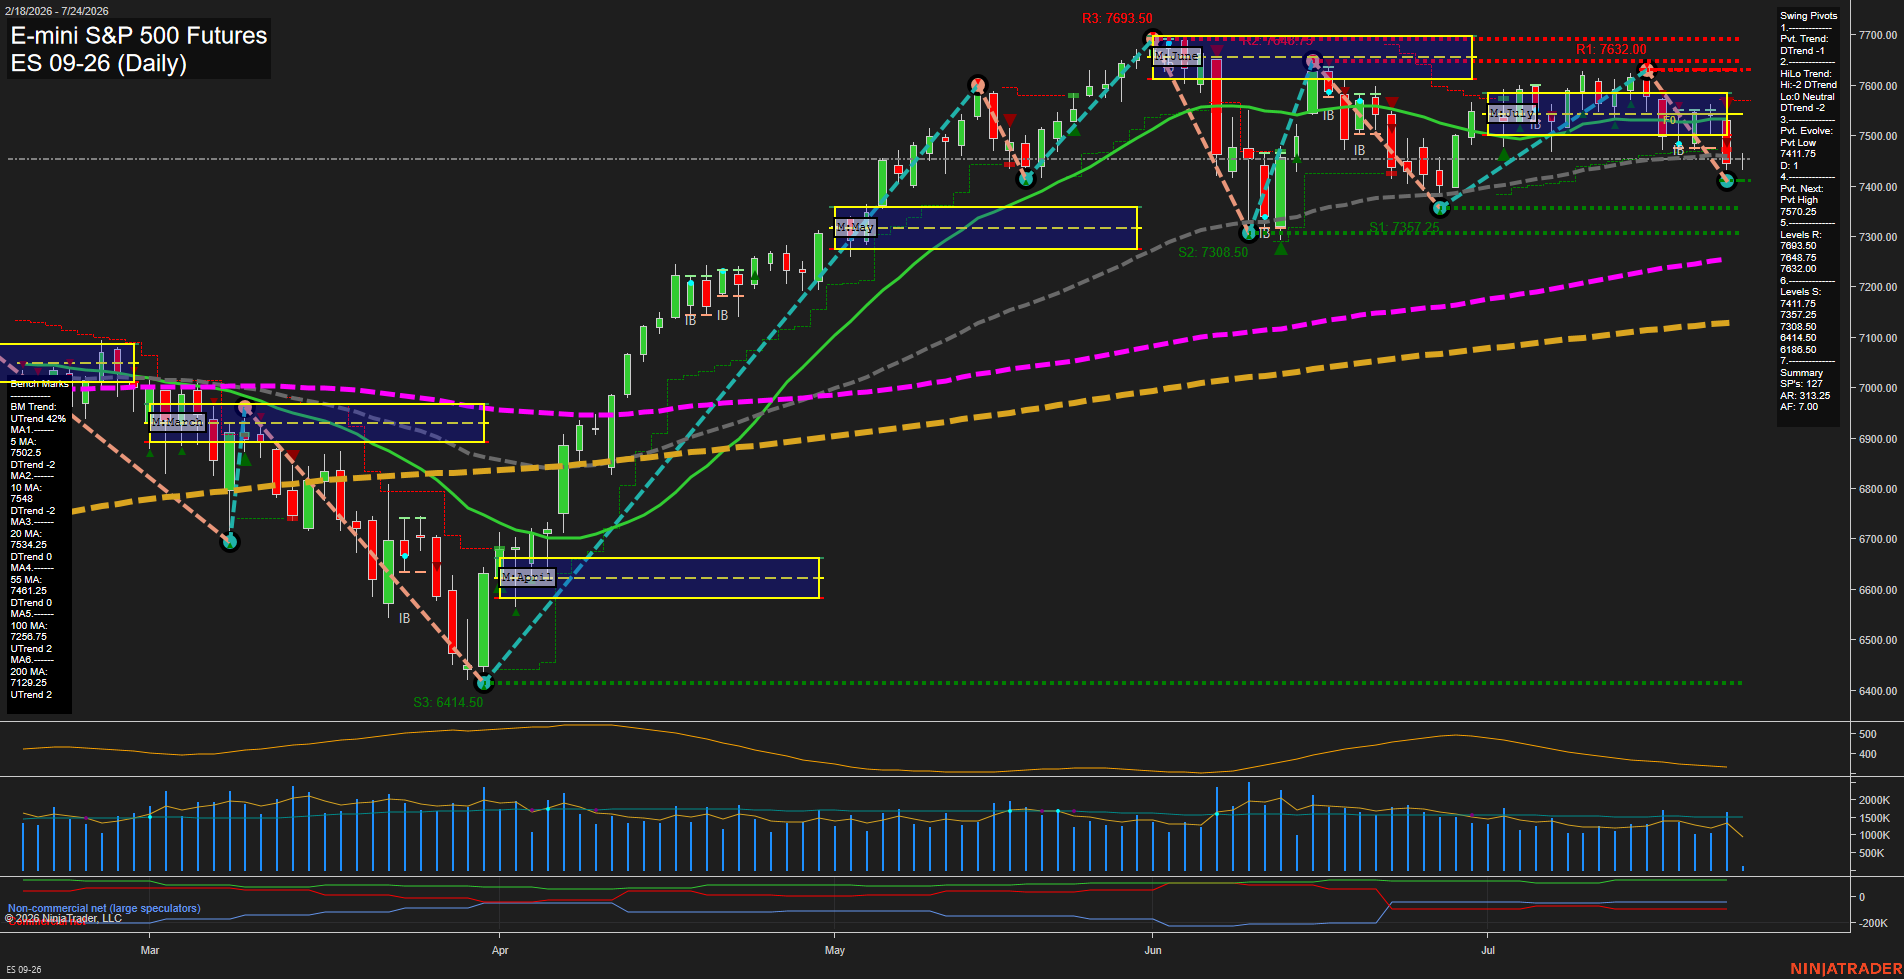
Overall Rating
- Short-Term: Bearish
- Intermediate-Term: Bearish
- Long-Term: Bullish.
Key Insights Summary
Price is in a fast short-term retracement from the July high, trading beneath the weekly and monthly F0% areas and below the declining 5, 10, 20, and 55-day benchmarks. Pivot structure remains bearish with lower highs and lower lows, while 7411.75 is the immediate swing-support reference and 7570.25 is the next pivot-reversal threshold. The larger yearly structure remains constructive above rising 100-day and 200-day averages, framing the current decline as an intermediate corrective phase within a longer-term uptrend.
View charts on: AlphaWebTrader HTF Charts
NQ Daily View
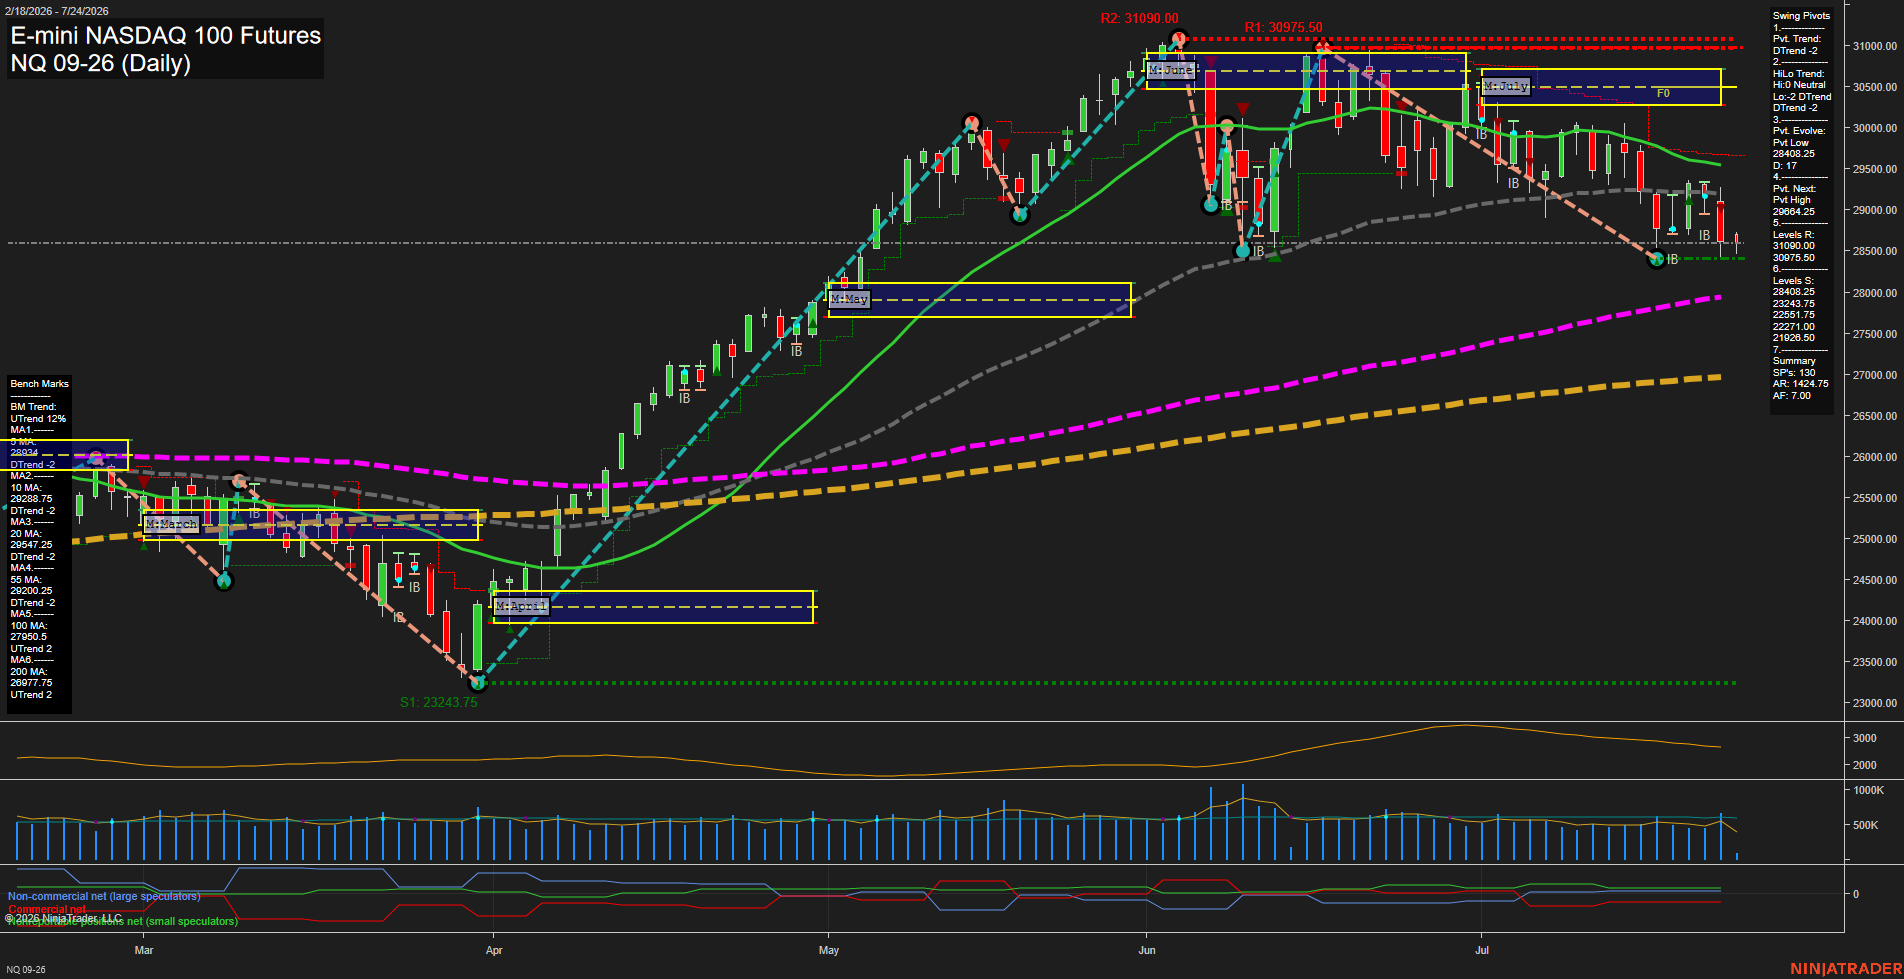
Overall Rating
- Short-Term: Bearish
- Intermediate-Term: Bearish
- Long-Term: Bullish.
Key Insights Summary
Price is trading below the weekly and July monthly F0%/NTZ structures, below all short- and intermediate-term benchmarks, and within a developing DTrend pivot sequence. The decline from the June high has produced lower highs and lower lows, with 28408.25 the active nearby pivot-low reference. The 29864.25 pivot-high reversal level defines the opposing short-term structure. Long-term trend remains constructive because price is still above rising 100-day and 200-day averages, framing the current action as an intermediate corrective decline within a broader annual uptrend.
View charts on: AlphaWebTrader HTF Charts
CL Daily View
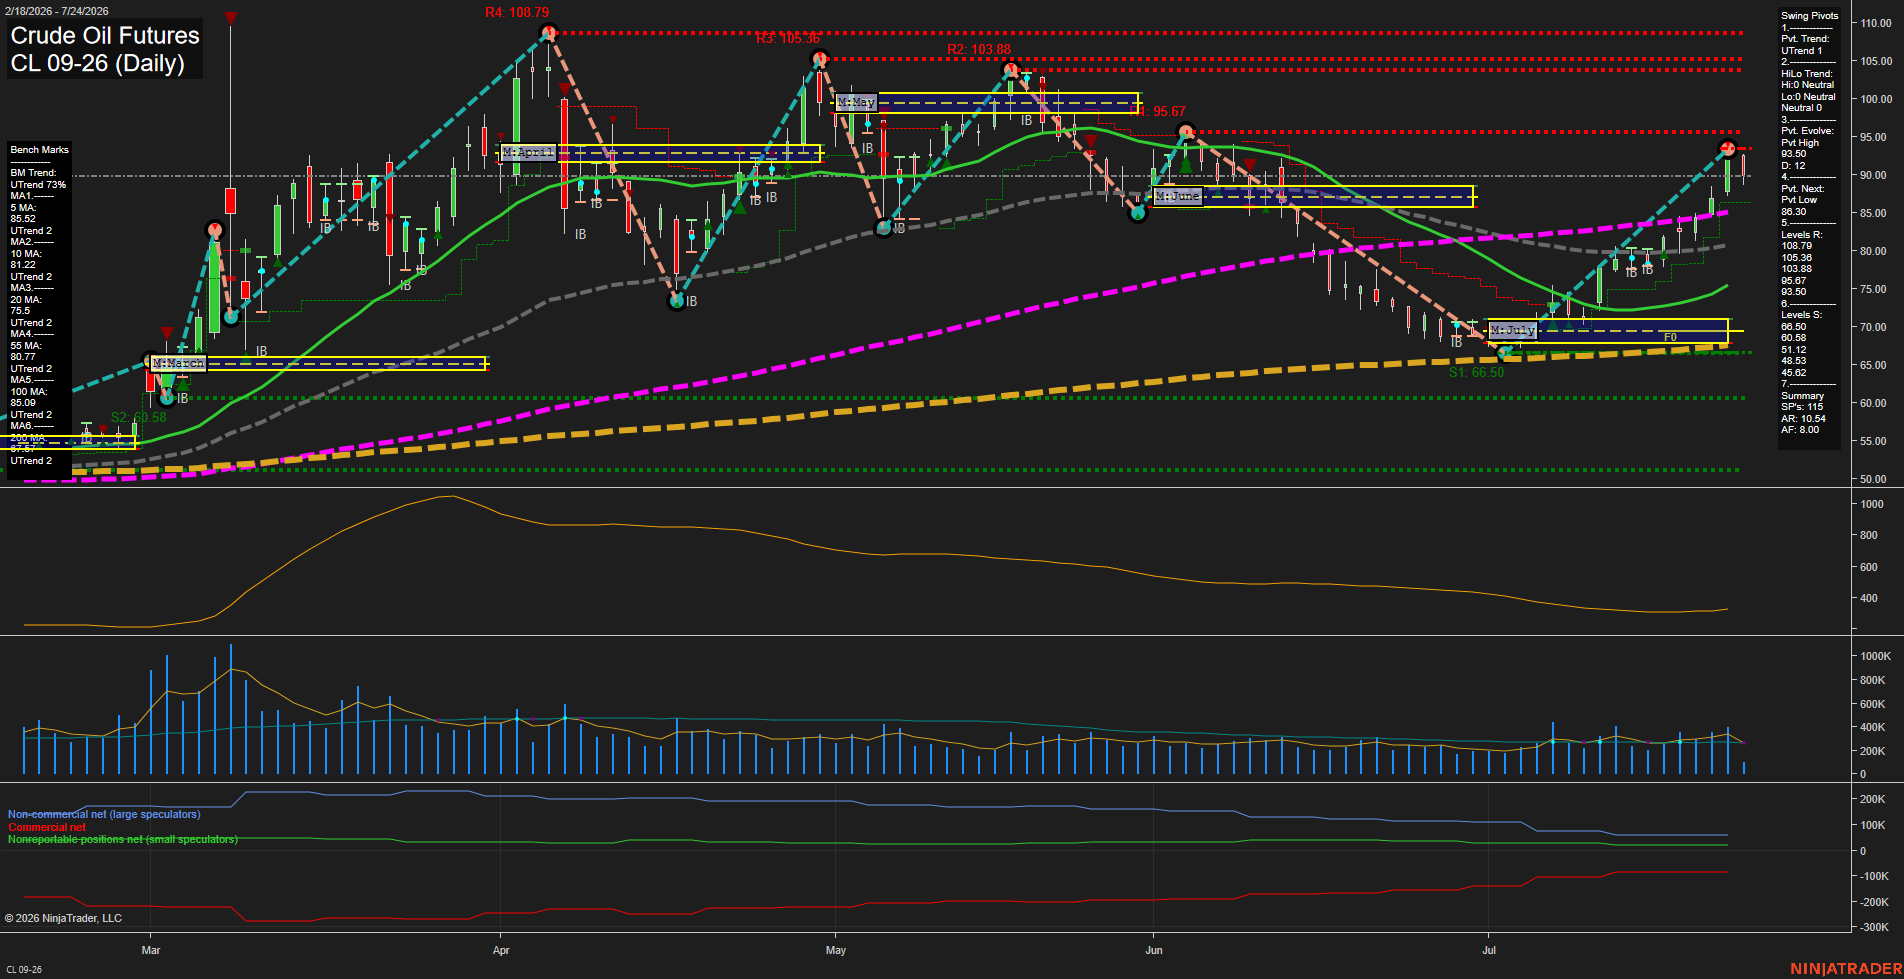
Overall Rating
- Short-Term: Bullish
- Intermediate-Term: Bullish
- Long-Term: Bullish.
Key Insights Summary
Price remains in a broad bullish recovery structure, holding above every displayed daily benchmark and above the July monthly fib-grid F0% area. The short-term pivot trend is up following the sharp advance from the July low, while the intermediate HiLo structure remains neutral because the larger swing sequence has not yet exceeded the 93.60 pivot high. The recent pullback from the 93.60 area reflects a retracement within fast upward momentum; 93.60 and 95.67 define the nearest overhead pivot-resistance zone, while 86.30 is the key reversal threshold for the current short-term pivot structure. Volume is moderate and ATR has contracted materially from earlier-year levels, indicating a less volatile but still directional rally phase.
View charts on: AlphaWebTrader HTF Charts
GC Daily View
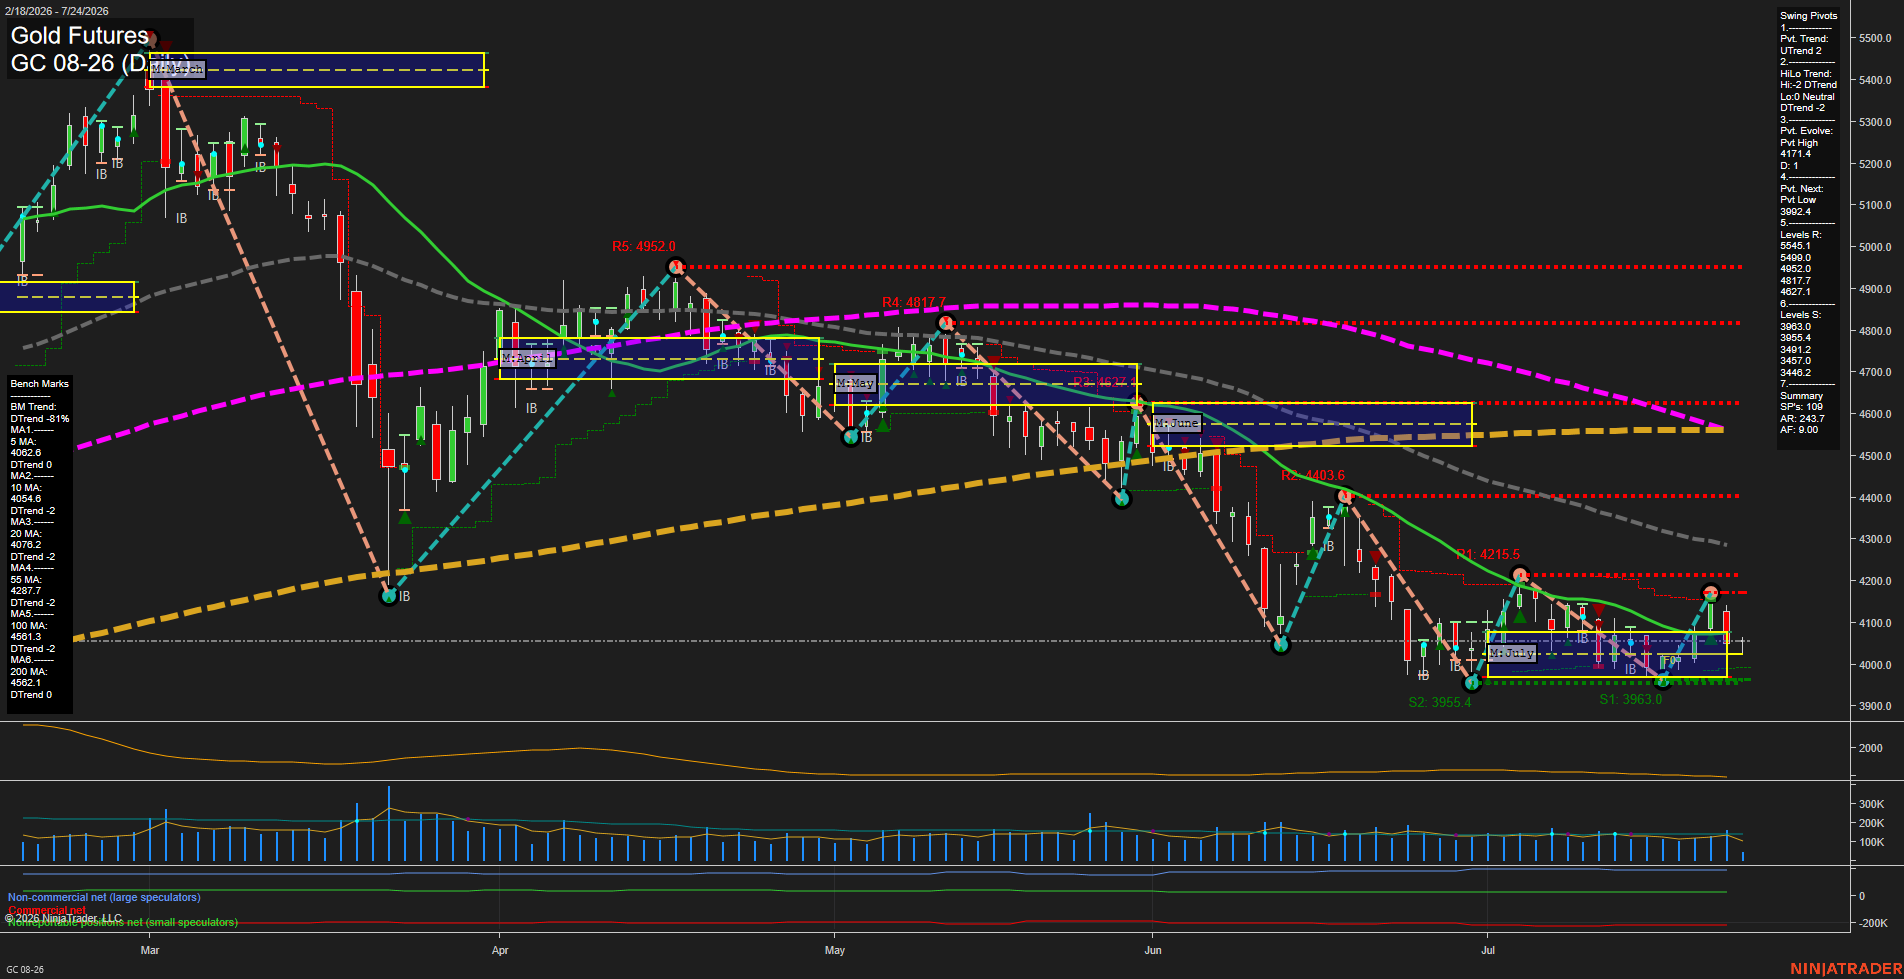
Overall Rating
- Short-Term: Neutral
- Intermediate-Term: Bearish
- Long-Term: Bearish.
Key Insights Summary
GC is consolidating near 4091 after a sharp decline from the June and early-July swing highs. The short-term pivot has turned upward and price remains above the weekly and monthly F0% areas, but the recovery has produced small, slow-momentum bars beneath declining intermediate and long-term benchmark averages. The 4171.4 pivot high defines the nearby recovery ceiling, while the 3992.4 pivot-low trigger and clustered 3963.0-3955.4 supports define the lower boundary of the current range. The broader structure remains bearish, characterized by lower highs beneath the 55-, 100-, and 200-day averages, while the current action resembles a counter-trend bounce and consolidation within that larger decline.
View charts on: AlphaWebTrader HTF Charts