NYSE pre-market radar tracks softer index futures, oil near $98, ETF movers and technical signals as AI spending and jobless claims stay in focus.
Fundamentals: Index futures declined as escalating tensions involving Iran, the Red Sea and regional energy infrastructure pushed Brent crude above $98 a barrel. Investor focus also turned to Big Tech AI spending after Alphabet raised its investment target and Tesla missed earnings expectations. Intel is scheduled to report, while U.S. unemployment claims are the key economic release.
Technicals: Pre-market activity highlights gains in NVDA, USO and GLD, while TSLA, MSFT and META declined in the prior session. Futures technical readings show broadly constructive long-term trends across major contracts, though short-term conditions are mixed. ES remains neutral daily, NQ retains an intermediate bearish bias, and YM and RTY face near-term pullbacks.
Pre-Market Trading 360° view Market Radar of: holidays, earnings, eco-news, market-news summary, news sentiment, prior session major ETFs, MAG7, Higher Time Frame Analysis Indices Futures Summary, and E-mini S&P500, Nasdaq 100, NYMEX Crude, Gold Futures Daily Chart analysis.
As of: July 23, 2026 07:16 CT
Earnings Radar
Monitoring for earnings releases by the Magnificent 7, AI-tech-related firms, and major financial institutions.
- INTC Release: 2026-07-23 T:AMC
Conclusion: Intel reports after the close on 2026-07-23, placing semiconductor-sector earnings and AI/data-center commentary in focus for index futures into the next session. Market momentum and volume can slow ahead of this major semiconductor release.
For full details visit: Yahoo Earnings Calendar
EcoNews Radar U.S. Events
| Day | Time | Impact | Event |
|---|---|---|---|
| Thu | 08:30 | Medium | Unemployment Claims |
EcoNews Summary
No qualifying high-impact EcoNews events are listed. The only listed release is a medium-impact labor-market event and is excluded because it does not relate to oil, crude inventories, energy prices, or petroleum supply.
Event Notes:
- No qualifying events for inclusion.
Conclusion:
No qualifying high-impact EcoNews events are listed for the week. Thursday is the only listed event day, featuring USD Unemployment Claims, but it does not meet the stated inclusion criteria.
For full details visit: Forex Factory EcoNews
Market News Summary:
Index futures eased as escalating Middle East conflict lifted oil prices and renewed scrutiny of Big Tech AI spending.
Primary Drivers & Risks:
- Primary Driver: Middle East oil supply disruption
- Primary Risk: AI spending and valuation pressure
Tone:
Cautious, with energy-driven inflation and equity pressure.
Stock Market / ETFs / Indices:
U.S. index futures declined after early Big Tech earnings revived concerns about heavy AI investment, with Alphabet increasing its AI spending target and Tesla missing on earnings. Japanese equities rose 0.6%, led by chip stocks and AI-demand optimism. Recent S&P 500 gains showed limited breadth, while valuation measures cited the index as substantially above historical norms.
Geopolitical:
U.S.-Iran tensions intensified following new strikes on Iran and Houthi activity targeting shipping. Houthis claimed attacks on Saudi oil tankers in the Red Sea, while Iran warned of retaliation against U.S.-linked and regional energy infrastructure.
Oil / Energy:
Oil reached a six-week high, with Brent above $98 a barrel and nearing $100 as Red Sea tanker attacks and wider conflict raised concerns over Middle East exports and shipping routes. U.S. average gasoline prices rose to $4.09 per gallon from $3.94 a week earlier. Natural gas also moved above range resistance amid stronger LNG demand.
Gold / Metals:
Gold held steady after a modest dollar pullback, but elevated global bond yields restrained the near-term outlook. Gold and silver rebounded from lower levels, with analysts attributing the move to bargain hunting rather than sustained momentum.
Fed / Financials:
Elevated bond yields remained a headwind for gold. The yen consolidated, while reports that the Bank of Japan is open to a faster pace of rate hikes provided support.
Macro / Other:
Chinese refiners increased purchases of Russian crude and examined Iranian supplies as Middle East disruptions affected regional exports. Higher energy costs added an inflation-sensitive cross-current for broader markets.
Conclusion:
Escalating conflict around Iran, the Red Sea, and Hormuz shipping lifted crude prices and weighed on index futures. Big Tech AI spending concerns added pressure after the first earnings releases.
Higher fuel prices and elevated bond yields remain important cross-currents for risk assets. Chip-sector strength in Japan and selective corporate earnings resilience provided offsetting support.
Market News Sentiment
Market News Articles: 37
- Neutral: 43.24%
- Positive: 40.54%
- Negative: 16.22%
Sentiment Summary: Market news sentiment is balanced to slightly positive, with 43% neutral, 41% positive, and 16% negative coverage across 37 articles.
Conclusion: Indices futures news flow shows limited negative sentiment and a near-even split between neutral and positive coverage.
GLD,Gold Articles: 11
- Positive: 54.55%
- Neutral: 36.36%
- Negative: 9.09%
Sentiment Summary: GLD/Gold coverage is moderately positive, with 55% positive, 36% neutral, and 9% negative articles.
Conclusion: Gold-related news tone is positive overall, with limited negative coverage relevant to indices futures market context.
USO,Oil Articles: 14
- Positive: 50.00%
- Negative: 35.71%
- Neutral: 14.29%
Sentiment Summary: USO and oil coverage is mixed-to-positive, with 50% positive, 36% negative, and 14% neutral articles across 14 reports.
Conclusion: Oil-related news tone is moderately positive overall, while substantial negative coverage indicates mixed sentiment relevant to index futures.
Market Data Snapshot
ETF Snapshot of major stock market ETFs, Mag7, and others as of: July 23, 2026 07:16
Top Movers & Losers
- NVDA 212.06 Bullish 2.30% ▲
- USO 131.68 Bullish 2.20% ▲
- GLD 379.12 Bullish 1.15% ▲
- TSLA 374.01 Bearish -1.30% ▼
- MSFT 390.34 Bearish -1.86% ▼
- META 627.17 Bearish -2.58% ▼
Major Index ETFs: SPY, QQQ, DIA, IWM, IJH
- DIA 521.47 Bearish -0.01% ▼
- IJH 75.69 Bearish -0.04% ▼
- SPY 747.41 Bearish -0.12% ▼
- QQQ 705.35 Bearish -0.51% ▼
- IWM 293.79 Bearish -0.93% ▼
Major Index ETFs are Bearish across the group. IWM is the most bearish mover at -0.93%, followed by QQQ at -0.51%. SPY is lower -0.12%, while IJH at -0.04% and DIA at -0.01% are marginal; DIA is the least negative mover.
Mag 7 Stocks: AAPL, MSFT, GOOG, AMZN, META, NVDA, TSLA
- NVDA 212.06 Bullish 2.30% ▲
- AAPL 325.89 Bearish -0.56% ▼
- AMZN 244.85 Bearish -1.09% ▼
- GOOG 341.91 Bearish -1.24% ▼
- TSLA 374.01 Bearish -1.30% ▼
- MSFT 390.34 Bearish -1.86% ▼
- META 627.17 Bearish -2.58% ▼
Mag7 is Bearish overall: NVDA is the sole Bullish mover at +2.30%, while META is the most bearish mover at -2.58%. AAPL is the least negative mover at -0.56%; AMZN, GOOG, TSLA, and MSFT are Bearish at -1.09%, -1.24%, -1.30%, and -1.86%.
Cross-Market ETFs: TLT, GLD, USO, IBIT
- USO 131.68 Bullish 2.20% ▲
- GLD 379.12 Bullish 1.15% ▲
- TLT 83.44 Bearish -0.26% ▼
- IBIT 37.34 Bearish -0.88% ▼
Mixed cross-market snapshot: USO is the most bullish mover at +2.20%, followed by GLD at +1.15%. IBIT is the most bearish mover at -0.88%, while TLT is marginally Bearish at -0.26%.
ETF, Mag7, and Cross-Market ETF Insights
Overall Tone
Mixed, with broad equity ETF and Mag7 Bearish pressure offset by Bullish strength in NVDA, energy, and gold.
Equity ETFs and Mag7:
Major Index ETFs were broadly Bearish: DIA was marginal at -0.01%, IJH fell -0.04%, SPY declined -0.12%, QQQ lost -0.51%, and IWM was the most bearish index ETF at -0.93%. Mag7 performance was selective, led by NVDA at +2.30%, while META was the most bearish mover at -2.58%; AAPL, AMZN, GOOG, TSLA, and MSFT were also Bearish. Equity leadership was narrow rather than broadly aligned.
Cross-Market ETFs:
Cross-market ETFs were Mixed, with USO the most bullish at +2.20% and GLD also Bullish at +1.15%. TLT was Bearish at -0.26%, while IBIT was the most bearish cross-market ETF at -0.88%, showing commodity strength alongside equity and bitcoin weakness.
Futures Indices – Higher Time Frame Analysis
Summary of the current state of US Indices Futures based on higher time-frame (HTF) technical analysis as of: 2026-07-23: 07:16 CT.
US Indices Futures
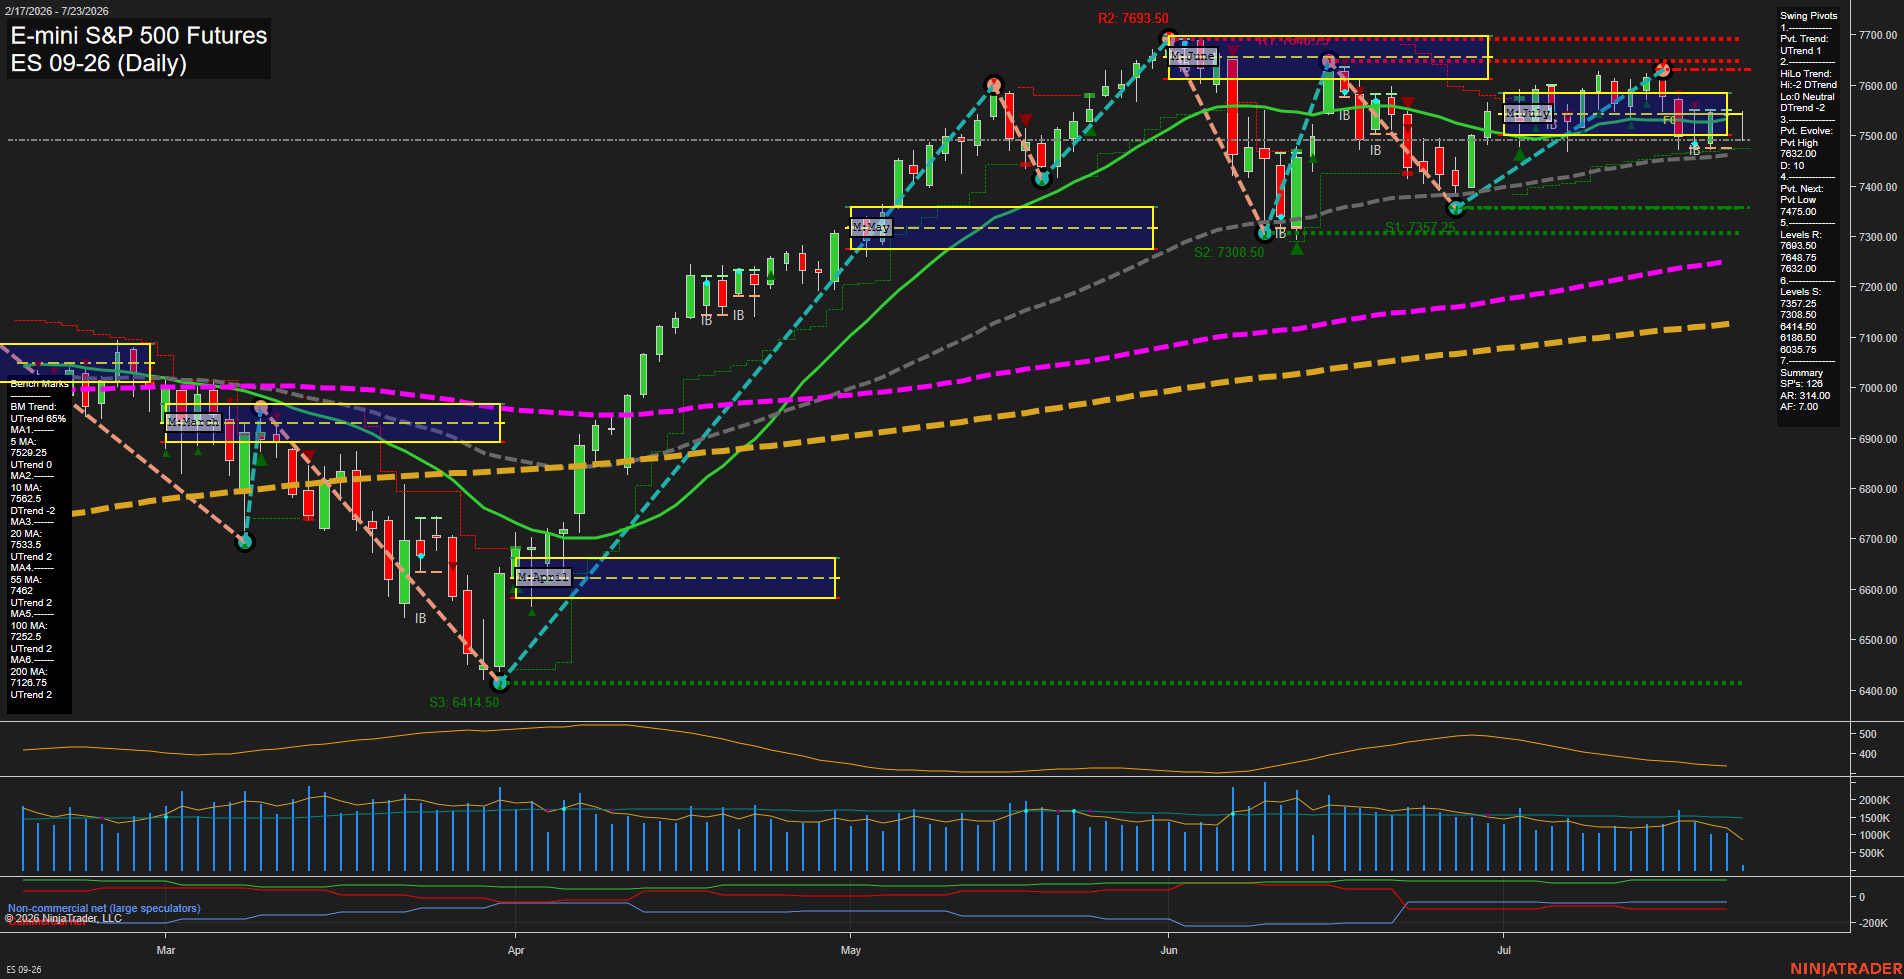
- ES: YSFG/WSFG bullish, MSFG below F0%, rising 20–200-day benchmarks, UTrend pivots, support 7291.50/7462, resistance 7632–7693.50.
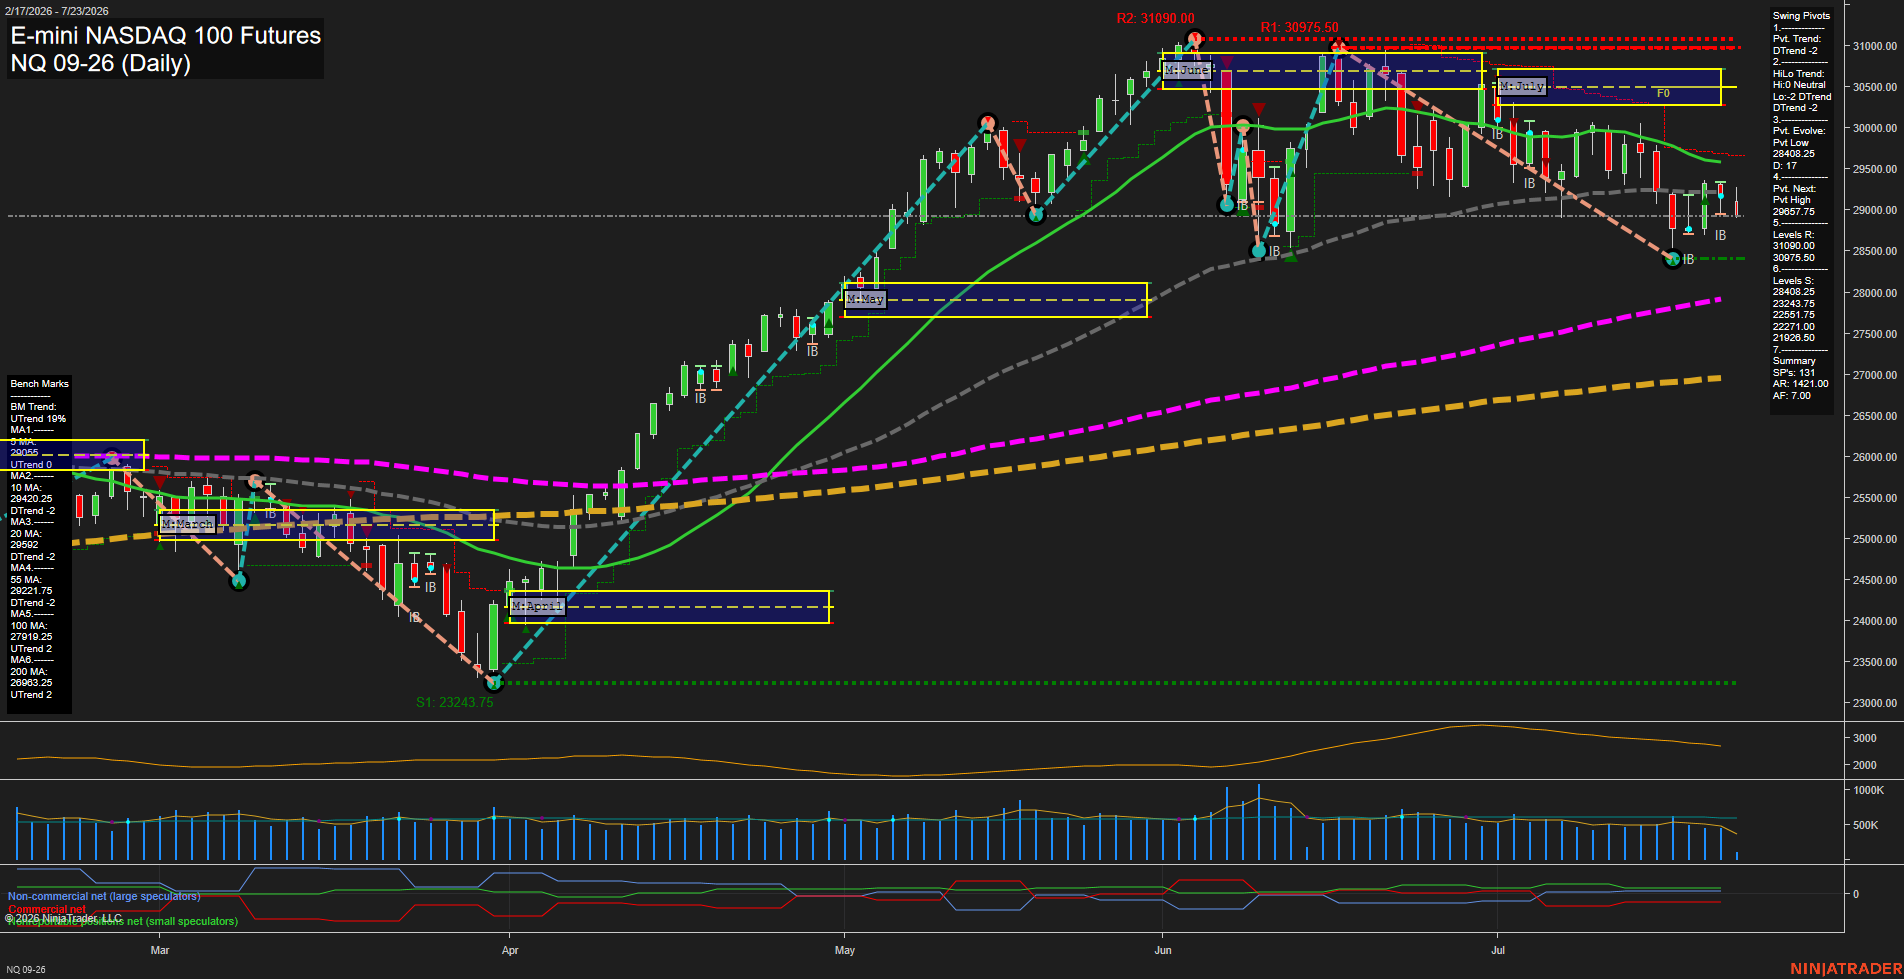
- NQ: YSFG/WSFG constructive, MSFG below center, rising 20–200 benchmarks, DTrend pivot, support 28408.25, resistance 31090.00.
- YM: YSFG bullish, WSFG/MSFG below F0%, rising 20–200 benchmarks, mixed pivots, support 51998/51092, resistance 53656.
- EMD: YSFG/WSFG bullish, MSFG below F0%, rising 20–200 benchmarks, DTrend pullback, support 3724.0/3692.9, resistance 3833.0/3892.4.
- RTY: YSFG bullish, WSFG/MSFG below F0%, rising benchmarks, short-term DTrend, support 2947.0/2835.8, resistance 3068.4/3088.4.
- FDAX: YSFG/WSFG bullish, MSFG marginally below F0%, rising 20–200 benchmarks, upward HTF pivots, support 24715/24282, resistance 25437/26064.
Overall State
- Short-Term: Neutral
- Intermediate-Term: Neutral
- Long-Term: Bullish
Conclusion
YSFG and long-term benchmark alignment remain bullish across all contracts. ES and FDAX retain the strongest broad alignment; NQ, YM, EMD, and RTY show MSFG-related retracements or mixed intermediate structure. WSFG conditions are broadly constructive except YM and RTY below F0%. ES, YM, EMD, RTY, and FDAX are consolidating beneath defined swing-high resistance, while NQ retains a DTrend structure beneath 31090.00. Rising 100- and 200-day benchmarks maintain the shared long-term directional correlation.
Note: Intra-day counter-trend pullbacks or retracements may occur, HTF is context for informational usage and market structure. Glossary: Session Fib Grids periods of YSFG:’Yearly’, MSFG:’Monthly’, WSFG:’Weekly’
For full details visit: AlphaWebTrader Technicals
ES Daily View
Overall Rating
- Short-Term: Neutral
- Intermediate-Term: Bullish
- Long-Term: Bullish.
Key Insights Summary
Price is consolidating near 7529 after a strong recovery from the June swing low, with small daily bars and slow momentum reflecting a compressed, rotational short-term condition. The pivot structure remains upward, supported by rising 20-, 55-, 100-, and 200-day benchmarks, while price is holding above the weekly F0% area. The July monthly grid remains below F0%, framing the current action as an intermediate-term pullback/consolidation beneath 7632.00 to 7693.50 resistance. The 7475.00 pivot-reversal level and the 7462.00 55-day benchmark define the nearby structural support zone; a sustained recovery through the 10-day average and 7632.00 would reassert the broader higher-high sequence.
View charts on: AlphaWebTrader HTF Charts
NQ Daily View
Overall Rating
- Short-Term: Neutral
- Intermediate-Term: Bearish
- Long-Term: Bullish.
Key Insights Summary
Price is consolidating beneath the declining 10, 20, and 55 day benchmarks after the June peak, with small daily bars and slowing momentum reflecting a choppy short-term retracement. The weekly grid remains constructive, while the July monthly grid and short-term DTrend pivot structure remain counter-trend negative. The larger 2026 structure remains positive above rising 100 and 200 day averages, framing the current action as an intermediate pullback within a broader long-term advance.
View charts on: AlphaWebTrader HTF Charts
CL Daily View
Overall Rating
- Short-Term: Bullish
- Intermediate-Term: Bullish
- Long-Term: Bullish.
Key Insights Summary
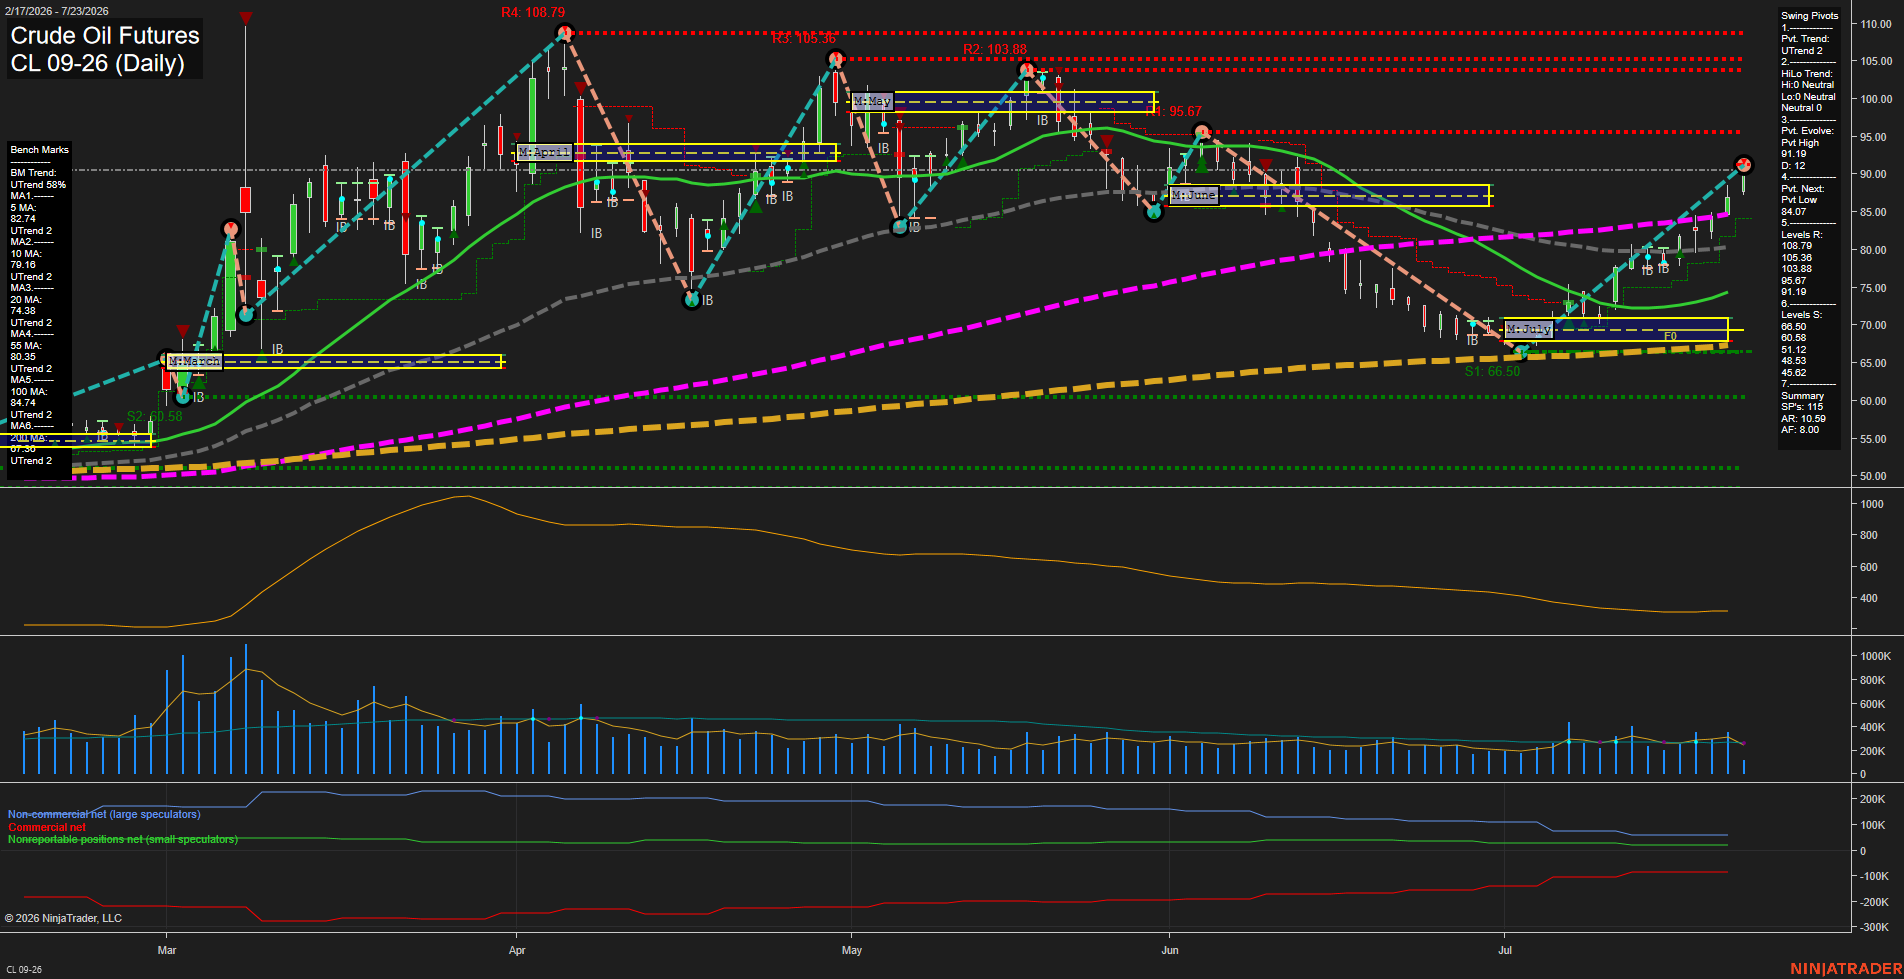
Price has produced a strong July V-recovery from the 66.50 area, with large-range upside bars and fast momentum lifting CL above all major daily benchmarks. The short-term pivot structure is upward, while the intermediate HiLo structure remains neutral following the prior May-to-July decline. The current advance is pressing toward the 91.69 pivot-high resistance, with 95.67 the next major overhead level. The 84.07 pivot-next level defines the near-term swing reference beneath price; the 20-day, 55-day, and 100-day averages cluster below and reinforce the broader recovery structure. Volume is moderate relative to the earlier spring activity, while ATR has contracted substantially from its peak, indicating a less volatile but still directional recovery phase.
View charts on: AlphaWebTrader HTF Charts
GC Daily View
Overall Rating
- Short-Term: Bullish
- Intermediate-Term: Neutral
- Long-Term: Bearish.
Key Insights Summary
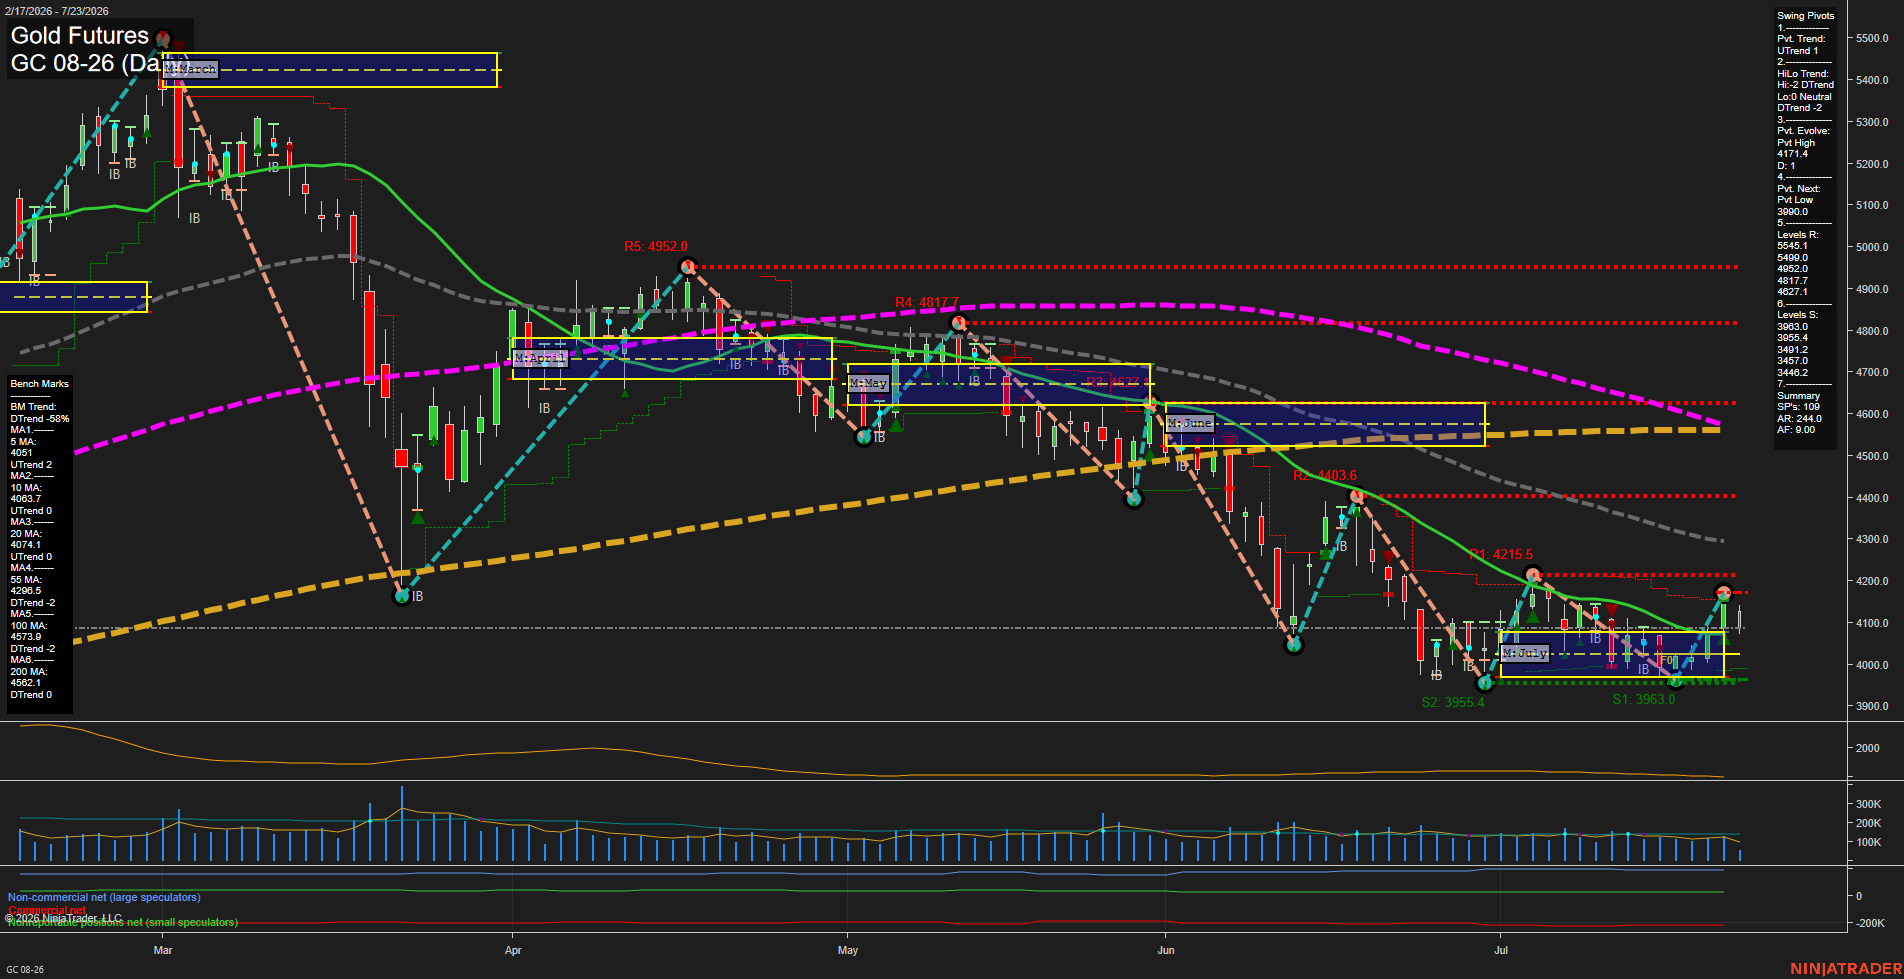
Gold is showing a short-term recovery from the July 3955-3963 support area, with price above the 5-, 10-, and 20-day benchmarks and a current UTrend pivot structure. The advance remains a countertrend bounce within the broader intermediate and long-term decline, as the HiLo trend is down and price remains below the declining 55-, 100-, and 200-day averages. The 4171 pivot high is the immediate swing reference, while 3955-3963 remains the nearby structural support zone. Small daily bars, slowing momentum, and subdued volume indicate a consolidating rebound rather than a broad upside expansion.
View charts on: AlphaWebTrader HTF Charts