
U.S. stocks closed mixed as lower oil lifted the Dow, while tech and semiconductors lagged amid Middle East risks, tariff concerns and cautious flows.
Fundamentals: U.S. equities ended mixed, with the Dow rising 0.5% as Apple gained 3%, while the S&P 500 added 0.1% and the Nasdaq fell 0.6% amid semiconductor and technology-spending pressure. Crude retreated on reports of Iran peace talks, but Strait of Hormuz disruption, EU tariff tensions, lower Treasury yields and defensive ETF flows kept the broader backdrop cautious.
Technicals: Equities closed with mixed ETF leadership as AAPL, DIA and IJH advanced while META, USO and TSLA declined. ES, NQ, YM and RTY futures remained in short-term corrective structures below key near-term benchmarks, though longer-term trends stayed constructive. EMD held a neutral consolidation, while FDAX tested resistance amid a broader bullish structure.
After Market Close daily snapshot: market news summary and sentiment, major ETFs, Magnificent 7 analysis, Indices Futures Higher Time Frame Analysis, and E-mini S&P500, Nasdaq 100, NYMEX Crude, Gold Futures Daily Chart analysis.
As of: July 24, 2026 05:00 CT
Market News Summary:
U.S. equities ended mixed as easing oil prices supported the Dow while technology and semiconductor shares remained under pressure.
Primary Drivers & Risks:
- Primary Driver: Middle East oil-price swings
- Primary Risk: Tech spending and tariff pressure
Tone:
Cautious and uneven, with defensive positioning.
Stock Market / ETFs / Indices:
The Dow gained 0.5%, aided by a 3% rise in Apple, while the S&P 500 added 0.1% and the Nasdaq fell 0.6% amid semiconductor weakness and technology spending concerns. The S&P 500 finished the week down 0.6%, its second consecutive weekly decline. ETF flows shifted away from concentrated U.S. technology toward broad-market defensive exposure, short-duration bonds, and commodities.
Geopolitical:
Peace-talk reports involving Iran reduced immediate oil pressure, while the Strait of Hormuz impasse remained a central market concern. Trump also threatened substantial tariffs on the European Union over treatment of U.S. technology companies.
Oil / Energy:
Oil retreated from Thursday’s spike as peace-talk hopes eased supply concerns, helping stabilize equities. The broader energy shock has affected roughly 20% of oil and gas supply, and analysts cited upside Brent-price risks if the Strait of Hormuz disruption persists. Kazakhstan also froze assets of the Kashagan oilfield operator over a disputed environmental fine.
Gold / Metals:
Gold recovered as crude oil and Treasury yields declined, holding near $4,050 after maintaining support around $4,000 for five weeks. Silver also moved higher in late U.S. trading.
Fed / Financials:
Lower Treasury yields supported gold and helped ease pressure from the energy-driven inflation trade. Attention remained on the upcoming FOMC meeting and interest-rate uncertainty.
Macro / Other:
Energy disruption remains a macro cross-current, with concerns that a sustained supply shock could raise inflation and strain global growth. Reports also highlighted elevated equity valuations and deteriorating free cash flow at major hyperscalers amid large AI-related capital expenditures.
Conclusion:
Middle East developments and the resulting moves in oil remained the main broad-market catalyst. Technology-sector weakness offset support from Apple and the retreat in crude.
Risks include persistent Strait of Hormuz disruption, renewed energy inflation, EU tariff tensions, and pressure on technology valuations. Defensive ETF flows and lower Treasury yields reflected a cautious market backdrop.
Market News Sentiment
Market News Articles: 47
- Neutral: 44.68%
- Negative: 40.43%
- Positive: 14.89%
Sentiment Summary: Among 47 market news articles, sentiment was 45% neutral, 40% negative, and 15% positive, indicating predominantly neutral coverage with a substantial negative share.
Conclusion: News tone for indices futures day traders was balanced but tilted toward caution, as negative articles materially outnumbered positive articles.
GLD,Gold Articles: 14
- Positive: 50.00%
- Neutral: 42.86%
- Negative: 7.14%
Sentiment Summary: GLD/Gold coverage was 50% positive, 43% neutral, and 7% negative across 14 articles.
Conclusion: Gold-related news tone was predominantly positive to neutral, with limited negative coverage.
USO,Oil Articles: 18
- Positive: 44.44%
- Negative: 44.44%
- Neutral: 11.11%
Sentiment Summary: USO/Oil coverage is evenly split, with 44% positive, 44% negative, and 11% neutral sentiment across 18 articles.
Conclusion: Oil-related news presents a balanced sentiment backdrop for indices futures day traders, with no clear directional bias in coverage.
Market Data Snapshot
ETF Snapshot of major stock market ETFs, Mag7, and others as of: July 24, 2026 05:00
Top Movers & Losers
- AAPL 333.02 Bullish 3.53% ▲
- DIA 518.76 Bullish 0.48% ▲
- IJH 75.77 Bullish 0.42% ▲
- META 595.19 Bearish -1.80% ▼
- USO 136.69 Bearish -2.01% ▼
- TSLA 313.03 Bearish -2.08% ▼
Major Index ETFs: SPY, QQQ, DIA, IWM, IJH
- DIA 518.76 Bullish 0.48% ▲
- IJH 75.77 Bullish 0.42% ▲
- SPY 738.93 Bullish 0.10% ▲
- IWM 291.17 Bearish -0.32% ▼
- QQQ 684.23 Bearish -1.12% ▼
Mixed index ETF context: DIA is the most bullish mover at +0.48%, followed by IJH at +0.42%. SPY is marginally Bullish at +0.10%. QQQ is the most bearish mover at -1.12%, while IWM is Bearish at -0.32%.
Mag 7 Stocks: AAPL, MSFT, GOOG, AMZN, META, NVDA, TSLA
- AAPL 333.02 Bullish 3.53% ▲
- GOOG 319.09 Bullish 0.24% ▲
- MSFT 381.70 Bullish 0.03% ▲
- AMZN 232.11 Bearish -0.66% ▼
- NVDA 206.84 Bearish -0.92% ▼
- META 595.19 Bearish -1.80% ▼
- TSLA 313.03 Bearish -2.08% ▼
Mixed Mag7 snapshot: AAPL is the most bullish mover at +3.53%, while TSLA is the most bearish mover at -2.08%. GOOG gained +0.24% and MSFT was marginally Bullish at +0.03%; AMZN fell -0.66%, NVDA -0.92%, and META -1.80%.
Cross-Market ETFs: TLT, GLD, USO, IBIT
- GLD 371.90 Bullish 0.10% ▲
- TLT 83.25 Bullish 0.10% ▲
- IBIT 36.35 Bearish -0.82% ▼
- USO 136.69 Bearish -2.01% ▼
Mixed cross-market snapshot: GLD and TLT are marginally Bullish at +0.10% each, tying as the most bullish movers. USO is the most bearish mover at -2.01%, while IBIT is Bearish at -0.82%.
ETF, Mag7, and Cross-Market ETF Insights
Overall Tone
Mixed, with strong AAPL leadership offset by Bearish pressure in growth-heavy equities, energy, and bitcoin exposure.
Equity ETFs and Mag7:
Major Index ETFs were Mixed: DIA +0.48%, IJH +0.42%, and SPY +0.10% were Bullish or marginally higher, while IWM -0.32% and QQQ -1.12% were Bearish. Mag7 performance was selective, led by AAPL at +3.53%, the most bullish mover, while TSLA at -2.08% was the most bearish mover; META -1.80% and NVDA -0.92% also lagged despite modest gains in GOOG +0.24% and MSFT +0.03%.
Cross-Market ETFs:
Cross-market ETFs were Mixed, with GLD and TLT both marginally Bullish at +0.10%, tying as the most bullish movers. USO at -2.01% was the most bearish mover, while IBIT declined -0.82%, showing Bearish energy and bitcoin exposure alongside near-flat defensive ETF strength.
Futures Indices – Higher Time Frame Analysis
Summary of the current state of US Indices Futures based on higher time-frame (HTF) technical analysis as of: 2026-07-24: 17:00 CT.
US Indices Futures
- ES YSFG up; MSFG/WSFG below F0%; 20–200W rising, 5–10W declining; 7289 support, 7693.50 resistance; short DTrend.
- NQ YSFG and long benchmarks rising; MSFG/WSFG below F0%; 28408.25 pivot support, 29864.25 reversal, 31090 resistance; daily DTrend.
- YM YSFG up; MSFG/WSFG below F0%; 10–200W benchmarks rising; 51082/51700 support, 52844 reversal, 53658 resistance; short DTrend.
- EMD YSFG above F0%, UTrend and rising weekly benchmarks; MSFG below F0%; 3652.8 support, 3830.8 reversal, 3892.4 resistance; daily balance.
- RTY YSFG/WSFG above F0%, MSFG below; rising 10–200W benchmarks; 2936.1 support, 3025.1/3068.4 resistance; daily DTrend.
- FDAX YSFG/WSFG above F0%, MSFG below; rising 20–200W benchmarks; 24715 support, 25443 reversal, 26064 resistance; daily DTrend.
Overall State
- Short-Term: Bearish
- Intermediate-Term: Bearish
- Long-Term: Bullish
Conclusion
ES, NQ, YM, RTY, and FDAX share daily DTrend pullback structures below monthly F0% references and short-term benchmarks. EMD is consolidating. Yearly structures and long-term benchmarks remain upward across all instruments, while weekly conditions are comparatively firmer in EMD, RTY, and FDAX. Pivot supports and prior highs define the current structural boundaries.
Note: Intra-day counter-trend pullbacks or retracements may occur, HTF is context for informational usage and market structure. Glossary: Session Fib Grids periods of YSFG:’Yearly’, MSFG:’Monthly’, WSFG:’Weekly’
For full details visit: AlphaWebTrader Technicals
ES Daily View
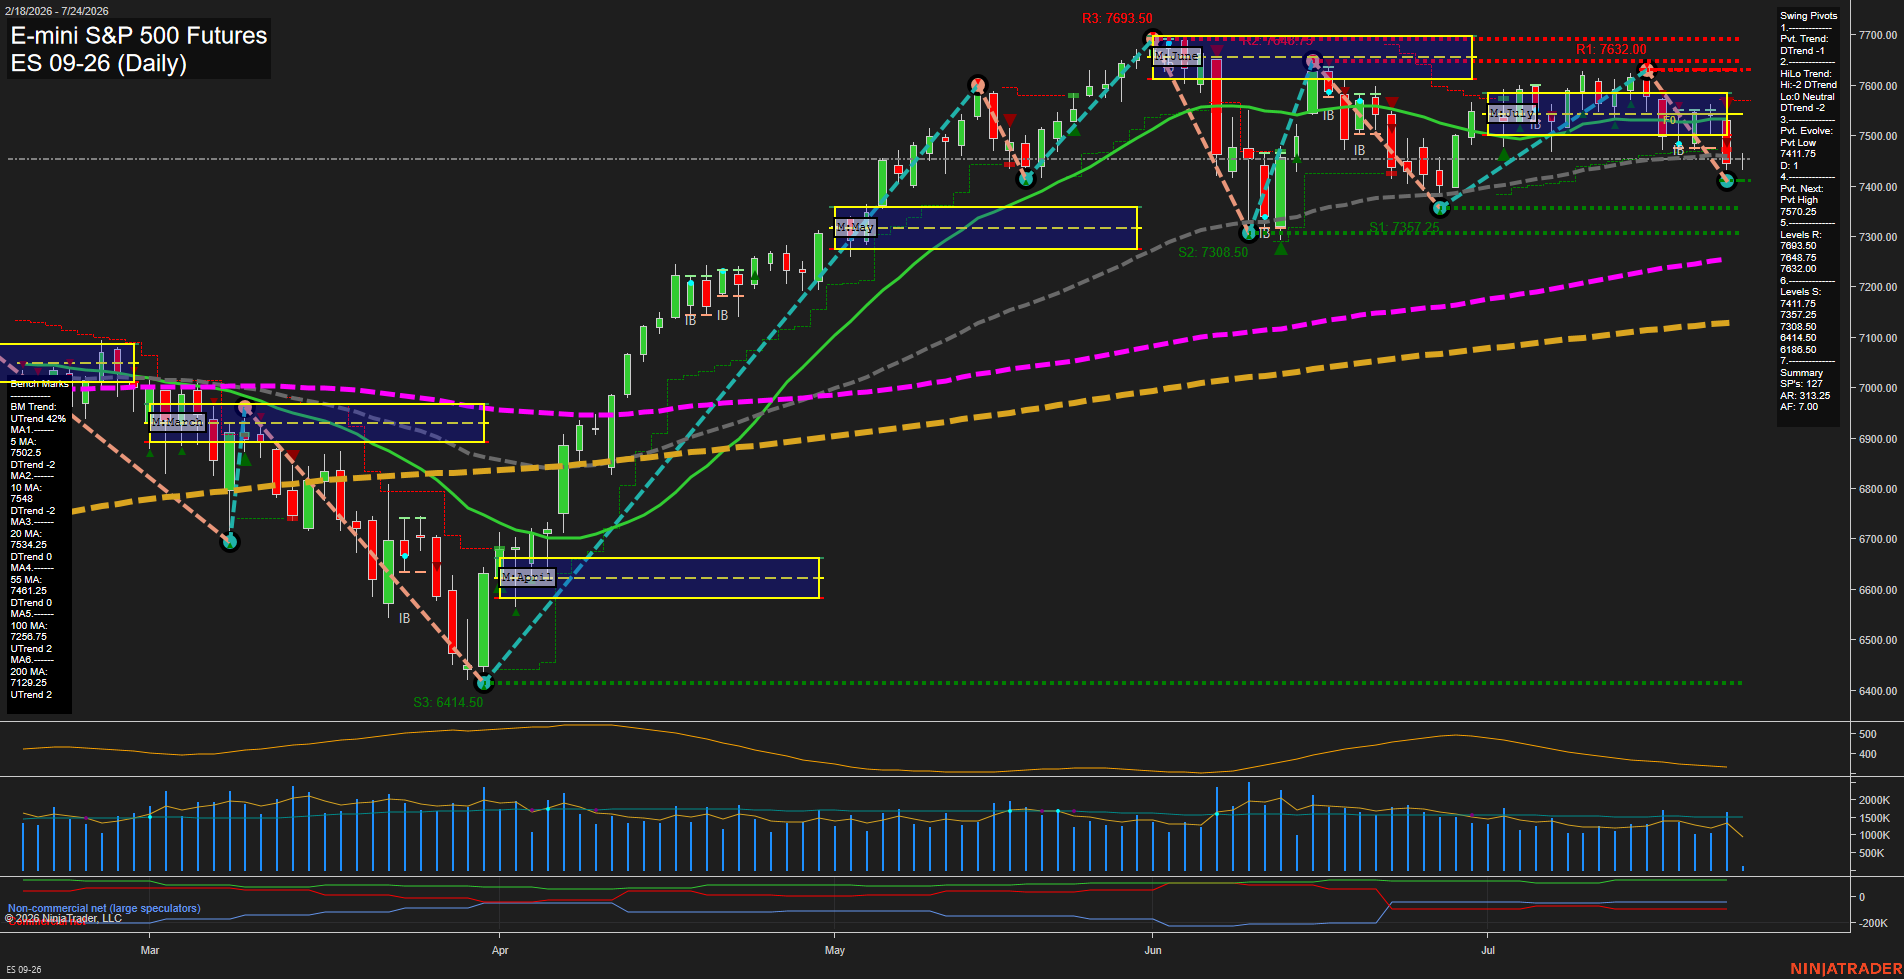
Overall Rating
- Short-Term: Bearish
- Intermediate-Term: Bearish
- Long-Term: Bullish.
Key Insights Summary
Price is in a fast short-term retracement from the July high, trading beneath the weekly and monthly F0% areas and below the declining 5, 10, 20, and 55-day benchmarks. Pivot structure remains bearish with lower highs and lower lows, while 7411.75 is the immediate swing-support reference and 7570.25 is the next pivot-reversal threshold. The larger yearly structure remains constructive above rising 100-day and 200-day averages, framing the current decline as an intermediate corrective phase within a longer-term uptrend.
View charts on: AlphaWebTrader HTF Charts
NQ Daily View
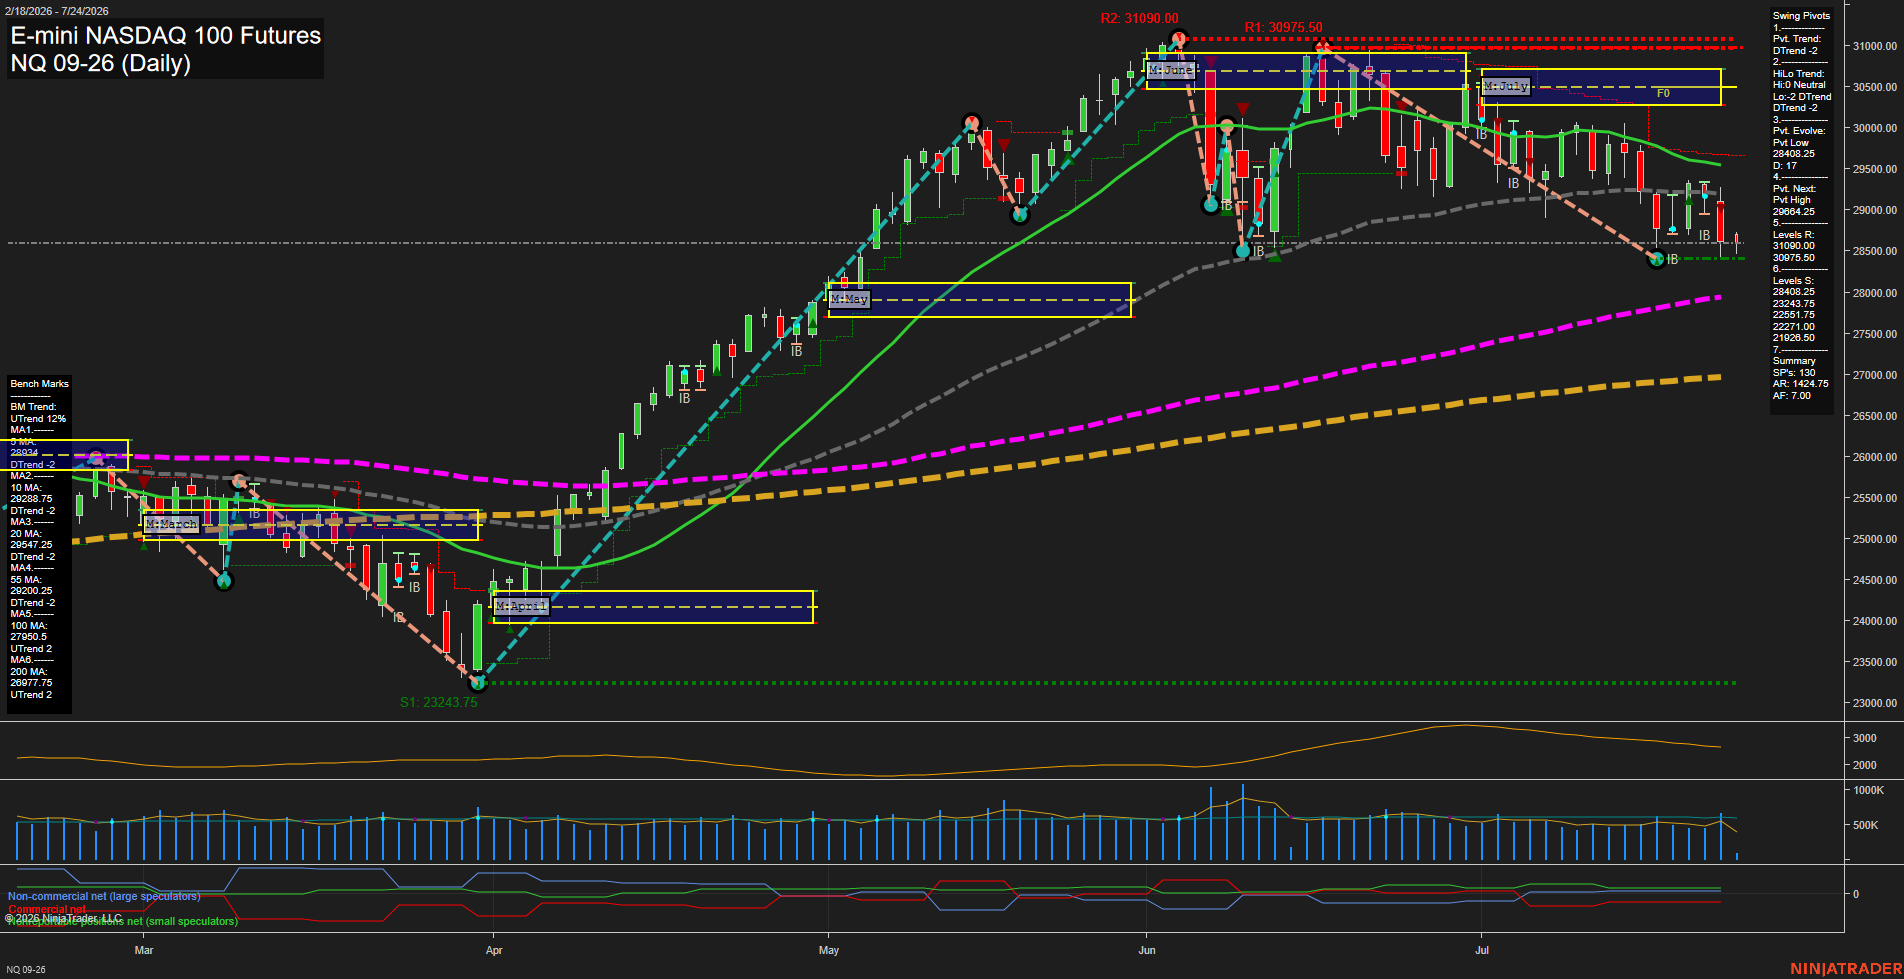
Overall Rating
- Short-Term: Bearish
- Intermediate-Term: Bearish
- Long-Term: Bullish.
Key Insights Summary
Price is trading below the weekly and July monthly F0%/NTZ structures, below all short- and intermediate-term benchmarks, and within a developing DTrend pivot sequence. The decline from the June high has produced lower highs and lower lows, with 28408.25 the active nearby pivot-low reference. The 29864.25 pivot-high reversal level defines the opposing short-term structure. Long-term trend remains constructive because price is still above rising 100-day and 200-day averages, framing the current action as an intermediate corrective decline within a broader annual uptrend.
View charts on: AlphaWebTrader HTF Charts
CL Daily View
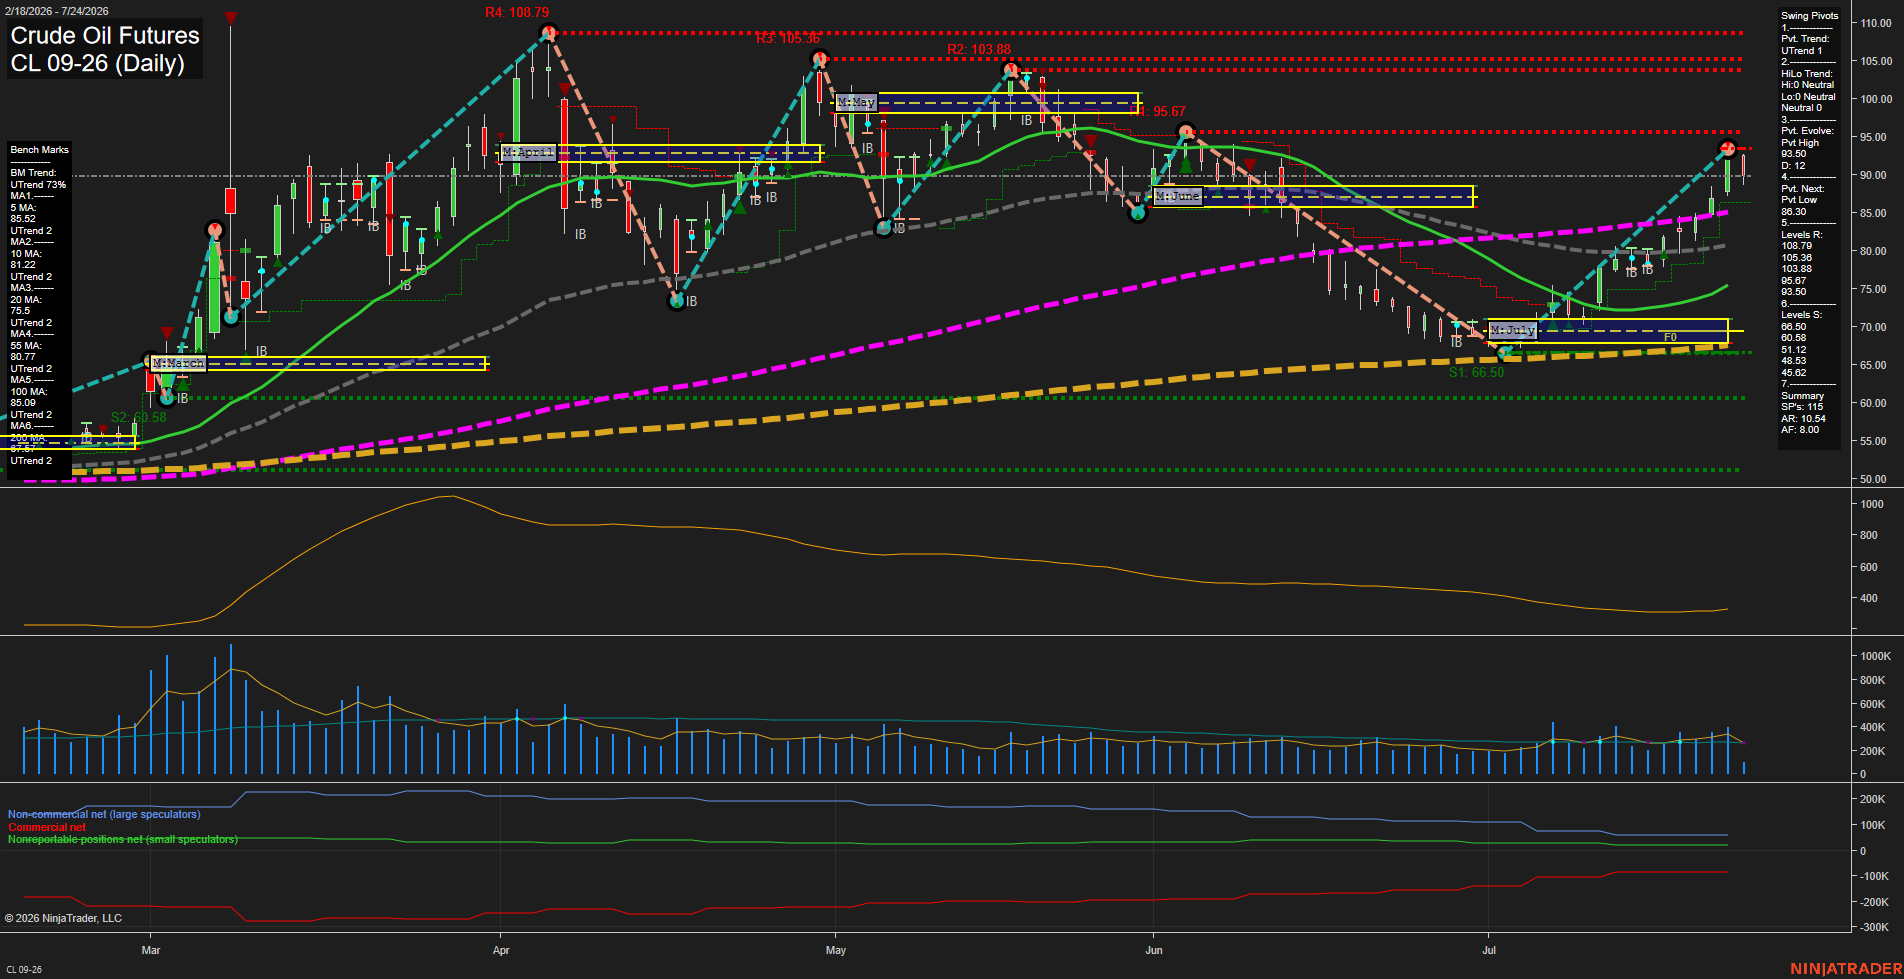
Overall Rating
- Short-Term: Bullish
- Intermediate-Term: Bullish
- Long-Term: Bullish.
Key Insights Summary
Price remains in a broad bullish recovery structure, holding above every displayed daily benchmark and above the July monthly fib-grid F0% area. The short-term pivot trend is up following the sharp advance from the July low, while the intermediate HiLo structure remains neutral because the larger swing sequence has not yet exceeded the 93.60 pivot high. The recent pullback from the 93.60 area reflects a retracement within fast upward momentum; 93.60 and 95.67 define the nearest overhead pivot-resistance zone, while 86.30 is the key reversal threshold for the current short-term pivot structure. Volume is moderate and ATR has contracted materially from earlier-year levels, indicating a less volatile but still directional rally phase.
View charts on: AlphaWebTrader HTF Charts
GC Daily View
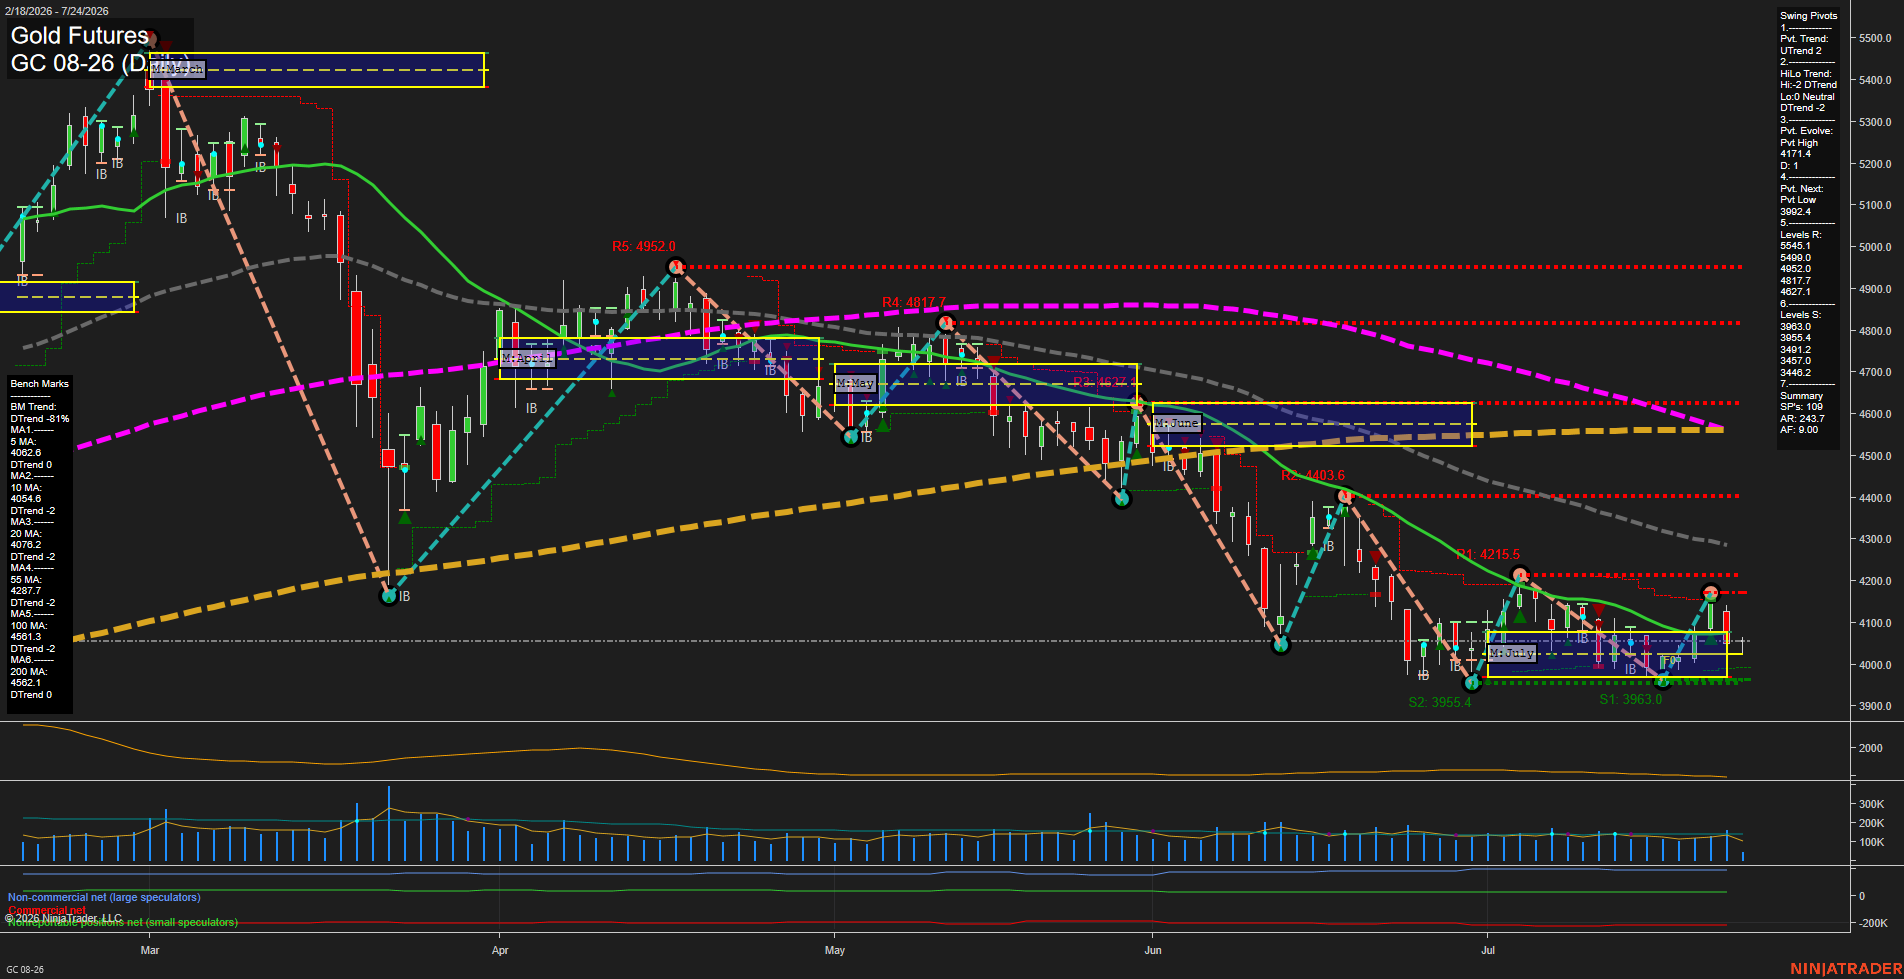
Overall Rating
- Short-Term: Neutral
- Intermediate-Term: Bearish
- Long-Term: Bearish.
Key Insights Summary
GC is consolidating near 4091 after a sharp decline from the June and early-July swing highs. The short-term pivot has turned upward and price remains above the weekly and monthly F0% areas, but the recovery has produced small, slow-momentum bars beneath declining intermediate and long-term benchmark averages. The 4171.4 pivot high defines the nearby recovery ceiling, while the 3992.4 pivot-low trigger and clustered 3963.0-3955.4 supports define the lower boundary of the current range. The broader structure remains bearish, characterized by lower highs beneath the 55-, 100-, and 200-day averages, while the current action resembles a counter-trend bounce and consolidation within that larger decline.
View charts on: AlphaWebTrader HTF Charts