
U.S. stocks closed lower as oil topped $100, Treasury yields rose and AI spending concerns hit technology shares amid tariff and conflict risks.
Fundamentals: U.S. equity markets weakened as crude oil rose above $100 per barrel, Treasury yields climbed and technology shares faced renewed pressure over AI capital spending. The S&P 500 declined alongside higher volatility, while tariffs, Middle East energy-supply risks and falling investor optimism added to inflation concerns. Gold and silver slipped as yields and the dollar strengthened.
Technicals: Crude oil ETF USO gained while Amazon, Alphabet and Tesla declined sharply, reflecting pressure in large-cap technology. Futures market analysis showed long-term bullish structures across major contracts, but mixed to bearish short-term conditions in Nasdaq, Dow and Russell futures. S&P 500, E-mini S&P, European and German equity futures remained in consolidation below key resistance levels.
After Market Close daily snapshot: market news summary and sentiment, major ETFs, Magnificent 7 analysis, Indices Futures Higher Time Frame Analysis, and E-mini S&P500, Nasdaq 100, NYMEX Crude, Gold Futures Daily Chart analysis.
As of: July 23, 2026 05:00 CT
Market News Summary:
U.S. equity risk sentiment weakened as $100 oil, higher Treasury yields, and AI-spending concerns pressured technology shares.
Primary Drivers & Risks:
- Primary Driver: Oil surge and rising yields
- Primary Risk: Inflation, tariffs, and tech capex
Tone:
Risk-off, with volatility and inflation concerns elevated.
Stock Market / ETFs / Indices:
The S&P 500 declined as volatility rose, with options markets focused on key downside levels and upcoming earnings from Apple, Meta, Microsoft, Amazon, and other large-cap companies. Technology shares faced added pressure after Alphabet increased investment plans and Tesla’s cash use for AI highlighted concern over large AI capital expenditures and weakening free cash flow.
Geopolitical:
The U.S.-Iran conflict remained a central market concern, with Houthi activity and disruptions around the Hormuz and Bab el-Mandeb chokepoints contributing to energy-supply stress. The conflict also remained relevant for official-sector gold holdings and safe-haven positioning.
Oil / Energy:
Oil moved above $100 per barrel amid conflict-related supply disruption concerns. Energy officials also highlighted power-grid reliability risks as data-center electricity demand rises while new generation supply remains limited.
Gold / Metals:
Gold and silver sold off as higher Treasury yields, a firmer dollar, and the crude-oil spike outweighed conflict-driven safe-haven demand. Gold held near $4,000 despite the session decline, while retail participation was described as orderly profit-taking rather than panic selling.
Fed / Financials:
Higher Treasury yields and mortgage rates added pressure to equities, with the 10-year yield cited near 4.70%. Markets also focused on renewed Fed-tightening concerns ahead of the next policy meeting, while long-duration bonds faced scrutiny from inflation and debt-related yield pressures.
Macro / Other:
New U.S. tariffs of 10% to 12.5% on major trading partners, alongside broader duties affecting dozens of countries and the European Union, added another inflation and trade-policy cross-current. Investor optimism fell sharply in the AAII survey, with bullish sentiment dropping to 29.6%.
Conclusion:
The main equity-market pressures were the oil move above $100, rising Treasury yields, and a technology selloff tied to AI-spending concerns. These factors coincided with a higher VIX and broad S&P 500 weakness.
Conflict-related energy disruption, fresh tariff measures, and reduced investor optimism added to the risk backdrop. Gold’s decline showed that higher yields and the dollar offset part of the safe-haven bid.
Market News Sentiment
Market News Articles: 48
- Neutral: 45.83%
- Positive: 33.33%
- Negative: 20.83%
Sentiment Summary: Market news sentiment is neutral overall, with 46% neutral, 33% positive, and 21% negative articles across 48 reports.
Conclusion: Indices futures headlines show mixed but neutral-leaning coverage, with positive articles exceeding negative articles.
GLD,Gold Articles: 12
- Neutral: 41.67%
- Positive: 33.33%
- Negative: 25.00%
Sentiment Summary: GLD/Gold coverage is neutral-leaning, with 42% neutral, 33% positive, and 25% negative sentiment across 12 articles.
Conclusion: Gold-related news flow shows mixed sentiment with a modest neutral majority, providing no clear directional bias for indices futures day traders.
USO,Oil Articles: 18
- Negative: 44.44%
- Positive: 38.89%
- Neutral: 16.67%
Sentiment Summary: USO/oil coverage is mixed-to-negative, with 44% negative, 39% positive, and 17% neutral across 18 articles.
Conclusion: For indices futures day traders, oil-related news tone is slightly negative overall, with sentiment divided between downside and positive narratives.
Market Data Snapshot
ETF Snapshot of major stock market ETFs, Mag7, and others as of: July 23, 2026 05:00
Top Movers & Losers
- USO 139.49 Bullish 5.93% ▲
- IJH 75.45 Bearish -0.32% ▼
- TLT 83.17 Bearish -0.32% ▼
- AMZN 233.66 Bearish -4.57% ▼
- GOOG 318.34 Bearish -6.89% ▼
- TSLA 319.69 Bearish -14.52% ▼
Major Index ETFs: SPY, QQQ, DIA, IWM, IJH
- IJH 75.45 Bearish -0.32% ▼
- IWM 292.09 Bearish -0.58% ▼
- DIA 516.26 Bearish -1.00% ▼
- SPY 738.18 Bearish -1.23% ▼
- QQQ 691.96 Bearish -1.90% ▼
Major Index ETFs were uniformly Bearish: QQQ led losses at -1.90%, followed by SPY at -1.23% and DIA at -1.00%. IWM declined -0.58%, while IJH was the least negative mover at -0.32%.
Mag 7 Stocks: AAPL, MSFT, GOOG, AMZN, META, NVDA, TSLA
- AAPL 321.66 Bearish -1.30% ▼
- NVDA 208.76 Bearish -1.56% ▼
- MSFT 381.58 Bearish -2.24% ▼
- META 606.10 Bearish -3.36% ▼
- AMZN 233.66 Bearish -4.57% ▼
- GOOG 318.34 Bearish -6.89% ▼
- TSLA 319.69 Bearish -14.52% ▼
Mag7 was Bearish across the group, led lower by TSLA at -14.52%. GOOG declined -6.89%, AMZN -4.57%, META -3.36%, MSFT -2.24%, NVDA -1.56%, while AAPL was the least negative mover at -1.30%.
Cross-Market ETFs: TLT, GLD, USO, IBIT
- USO 139.49 Bullish 5.93% ▲
- TLT 83.17 Bearish -0.32% ▼
- IBIT 36.65 Bearish -1.85% ▼
- GLD 371.52 Bearish -2.00% ▼
Other ETFs were Mixed: USO was the most bullish mover at +5.93%, while GLD was the most bearish mover at -2.00%. IBIT declined -1.85%, and TLT was marginally Bearish at -0.32%.
ETF, Mag7, and Cross-Market ETF Insights
Overall Tone
Bearish tone overall, with broad equity and Mag7 losses outweighing isolated Bullish strength in oil.
Equity ETFs and Mag7:
Major Index ETFs were broadly Bearish: SPY fell -1.23%, QQQ declined -1.90%, DIA lost -1.00%, IWM slipped -0.58%, and IJH was the least negative mover at -0.32%. Mag7 selling was more severe and selective, led lower by TSLA at -14.52%, the most bearish mover, followed by GOOG at -6.89% and AMZN at -4.57%. AAPL was the least negative Mag7 name at -1.30%, while NVDA, MSFT, and META also remained Bearish.
Cross-Market ETFs:
Cross-market action diverged from equities as USO surged +5.93%, making it the most bullish mover across the snapshot. TLT was marginally Bearish at -0.32%, while GLD declined -2.00% and IBIT fell -1.85%. Oil strength contrasted with Bearish moves in bonds, gold, and bitcoin exposure, with GLD the most bearish cross-market ETF.
Futures Indices – Higher Time Frame Analysis
Summary of the current state of US Indices Futures based on higher time-frame (HTF) technical analysis as of: 2026-07-23: 17:00 CT.
US Indices Futures
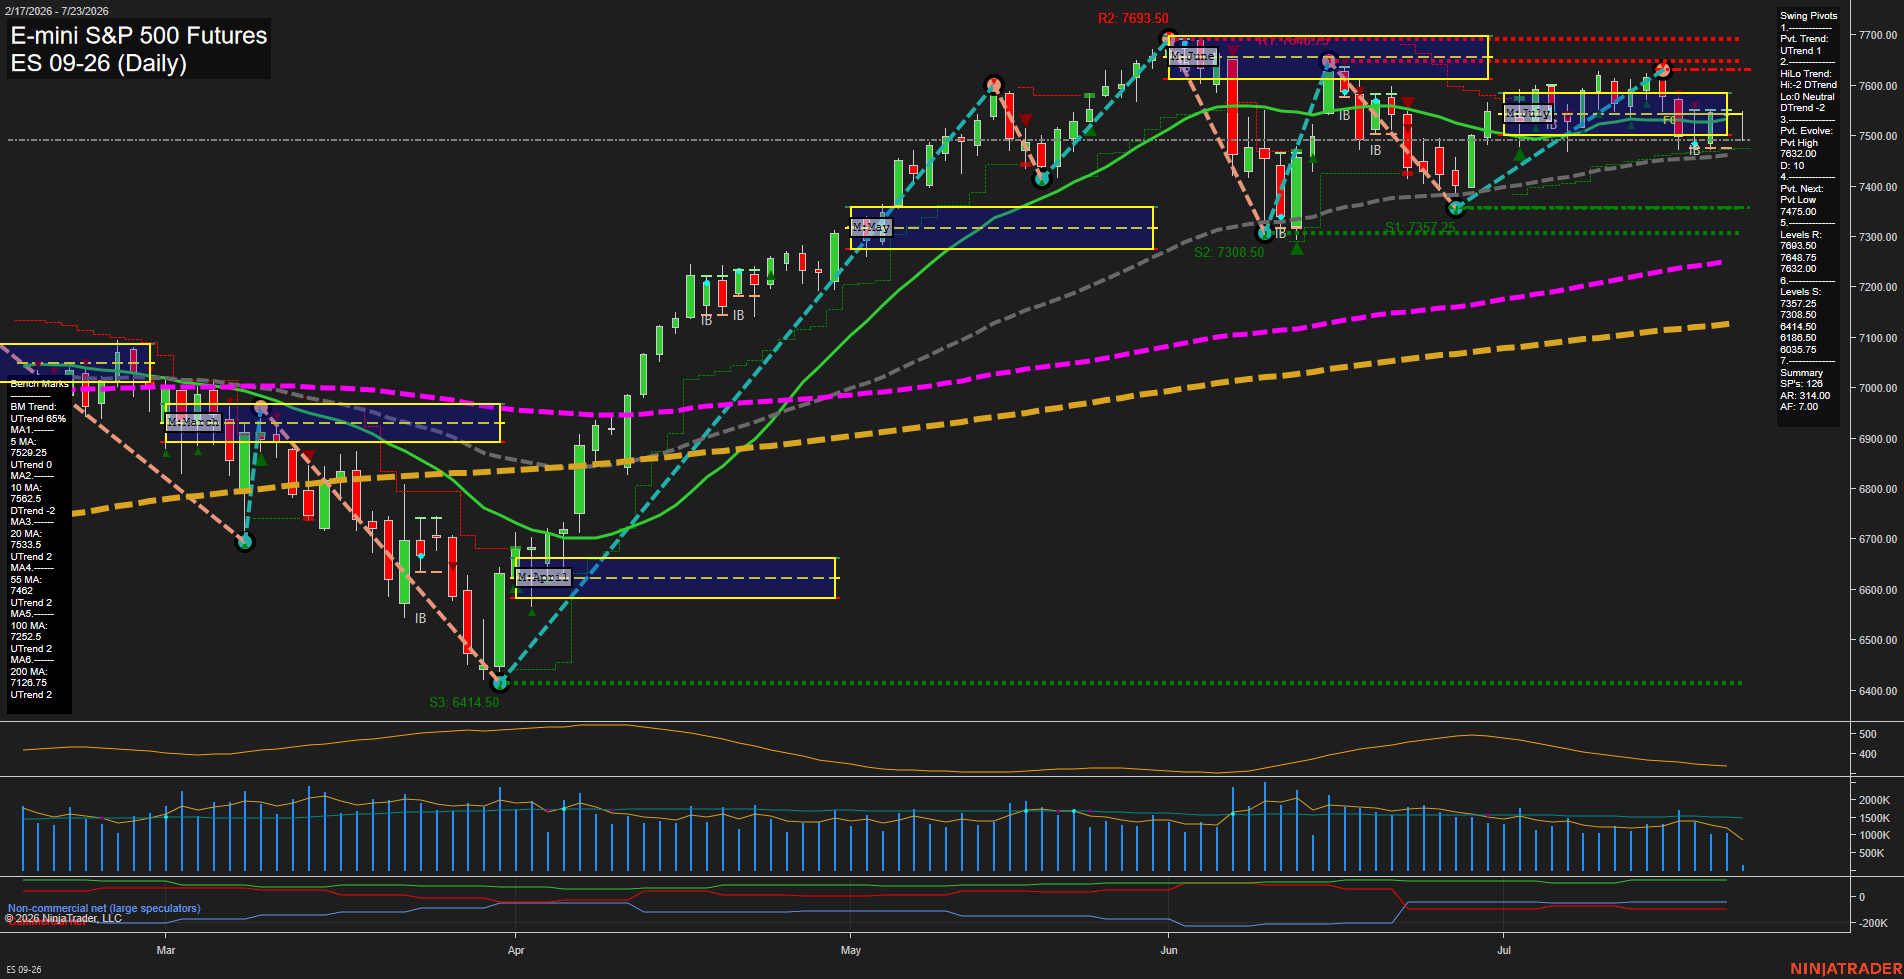
- ES: YSFG/WSFG upside, MSFG below F0%; above rising 20–200-day benchmarks; UTrend, 7291.50 support, 7693.50 resistance; consolidating near 7527.5.
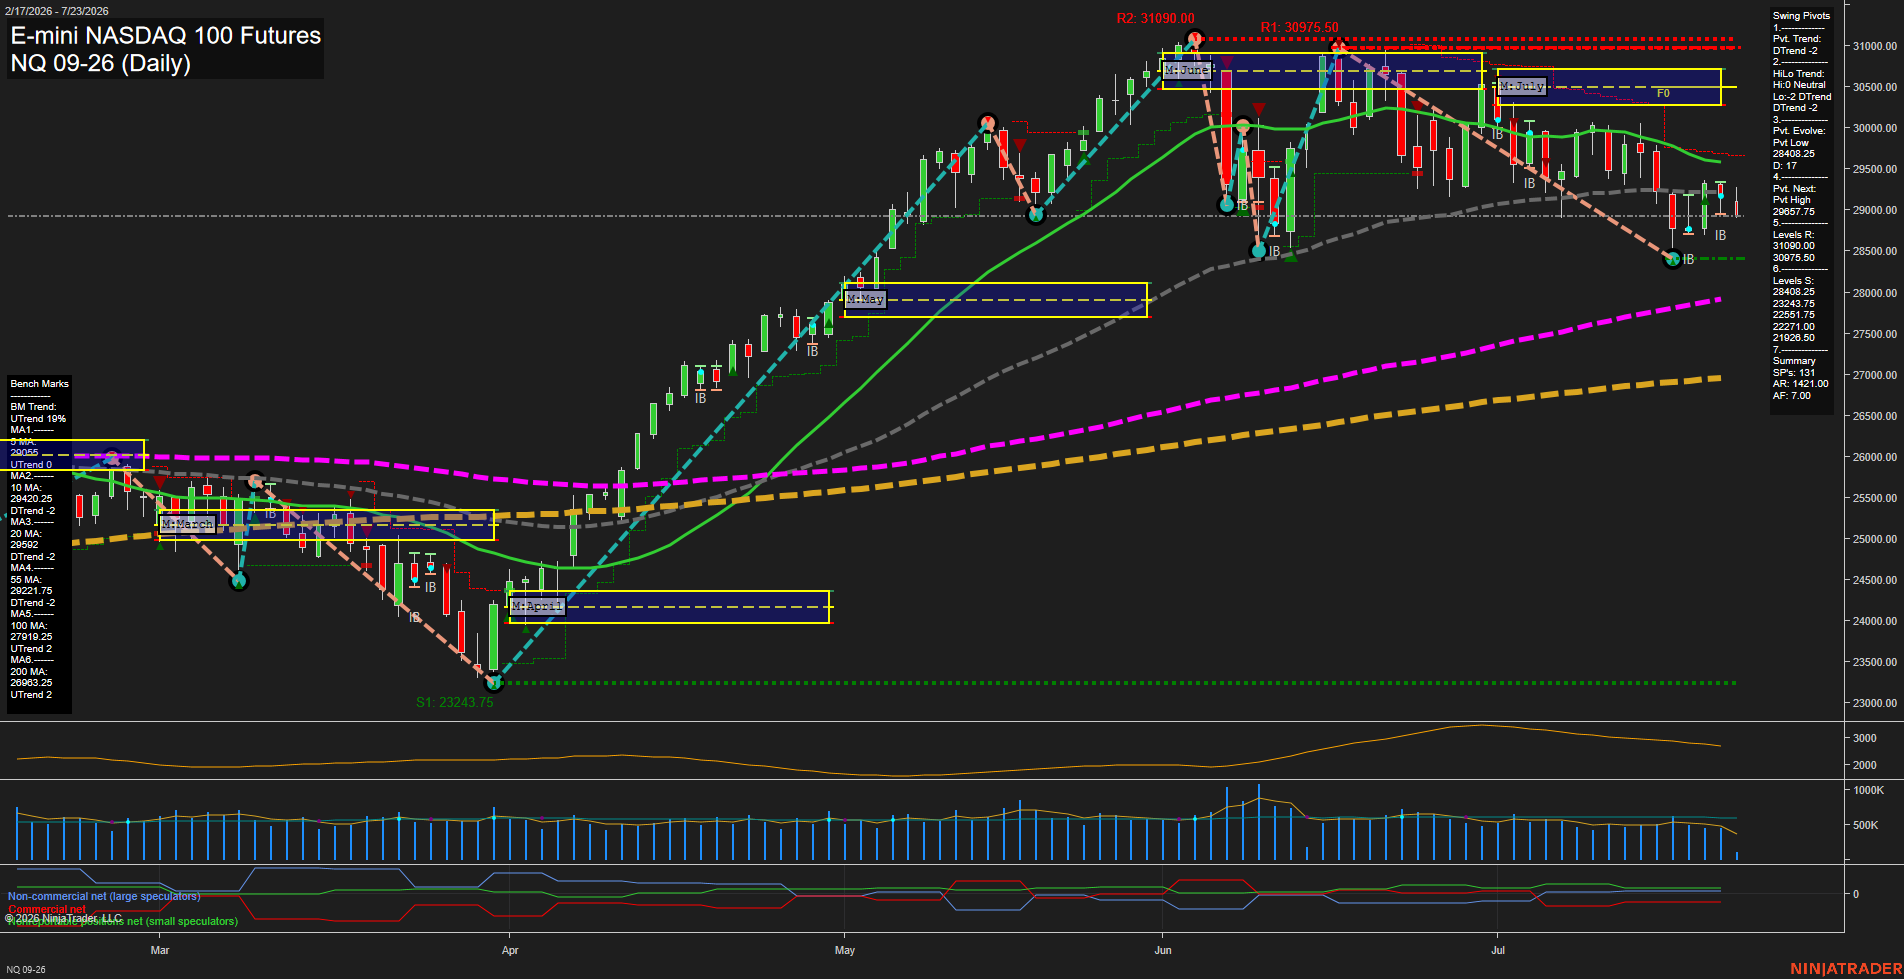
- NQ: YSFG and WSFG constructive, MSFG below center; above rising 20–200 benchmarks; DTrend, 28408.25 swing support, 31090.00 swing resistance.
- YM: YSFG uptrend, WSFG/MSFG below centers; above rising 20–200 benchmarks; 5-period falling, 10-period rising; 51998 support, 53656 resistance.
- EMD: WSFG long, MSFG below F0%; rising 5–10 and 55–200 benchmarks; DTrend pullback, 3692.9–3724.0 support, 3833.0/3892.4 resistance.
- RTY: YSFG uptrend, WSFG/MSFG below F0%/NTZ; rising 55–200 benchmarks, below 5–20-day averages; 2947.0 support, 3068.4–3088.4 resistance.
- FDAX: YSFG/WSFG constructive, MSFG marginally below F0%; above rising 20–200 benchmarks; DTrend recovery, 24715 support, 25437 reversal, 26064 resistance.
Overall State
- Short-Term: Neutral
- Intermediate-Term: Neutral
- Long-Term: Bullish
Conclusion
Long-term correlation remains bullish across all six contracts, supported by rising 100- and 200-day benchmarks and generally intact yearly structures. ES and FDAX retain bullish intermediate alignment; NQ remains intermediate bearish under its monthly grid. YM, EMD, and RTY hold mixed intermediate conditions. Monthly Fib Grids are below F0% or center areas across the group, while weekly and yearly structures maintain broader upside context. ES 7693.50, NQ 31090.00, YM 53656, EMD 3892.4, RTY 3088.4, and FDAX 26064 remain principal swing-high resistance references.
Note: Intra-day counter-trend pullbacks or retracements may occur, HTF is context for informational usage and market structure. Glossary: Session Fib Grids periods of YSFG:’Yearly’, MSFG:’Monthly’, WSFG:’Weekly’
For full details visit: AlphaWebTrader Technicals
ES Daily View
Overall Rating
- Short-Term: Neutral
- Intermediate-Term: Bullish
- Long-Term: Bullish.
Key Insights Summary
Price is consolidating near 7529 after a strong recovery from the June swing low, with small daily bars and slow momentum reflecting a compressed, rotational short-term condition. The pivot structure remains upward, supported by rising 20-, 55-, 100-, and 200-day benchmarks, while price is holding above the weekly F0% area. The July monthly grid remains below F0%, framing the current action as an intermediate-term pullback/consolidation beneath 7632.00 to 7693.50 resistance. The 7475.00 pivot-reversal level and the 7462.00 55-day benchmark define the nearby structural support zone; a sustained recovery through the 10-day average and 7632.00 would reassert the broader higher-high sequence.
View charts on: AlphaWebTrader HTF Charts
NQ Daily View
Overall Rating
- Short-Term: Neutral
- Intermediate-Term: Bearish
- Long-Term: Bullish.
Key Insights Summary
Price is consolidating beneath the declining 10, 20, and 55 day benchmarks after the June peak, with small daily bars and slowing momentum reflecting a choppy short-term retracement. The weekly grid remains constructive, while the July monthly grid and short-term DTrend pivot structure remain counter-trend negative. The larger 2026 structure remains positive above rising 100 and 200 day averages, framing the current action as an intermediate pullback within a broader long-term advance.
View charts on: AlphaWebTrader HTF Charts
CL Daily View
Overall Rating
- Short-Term: Bullish
- Intermediate-Term: Bullish
- Long-Term: Bullish.
Key Insights Summary
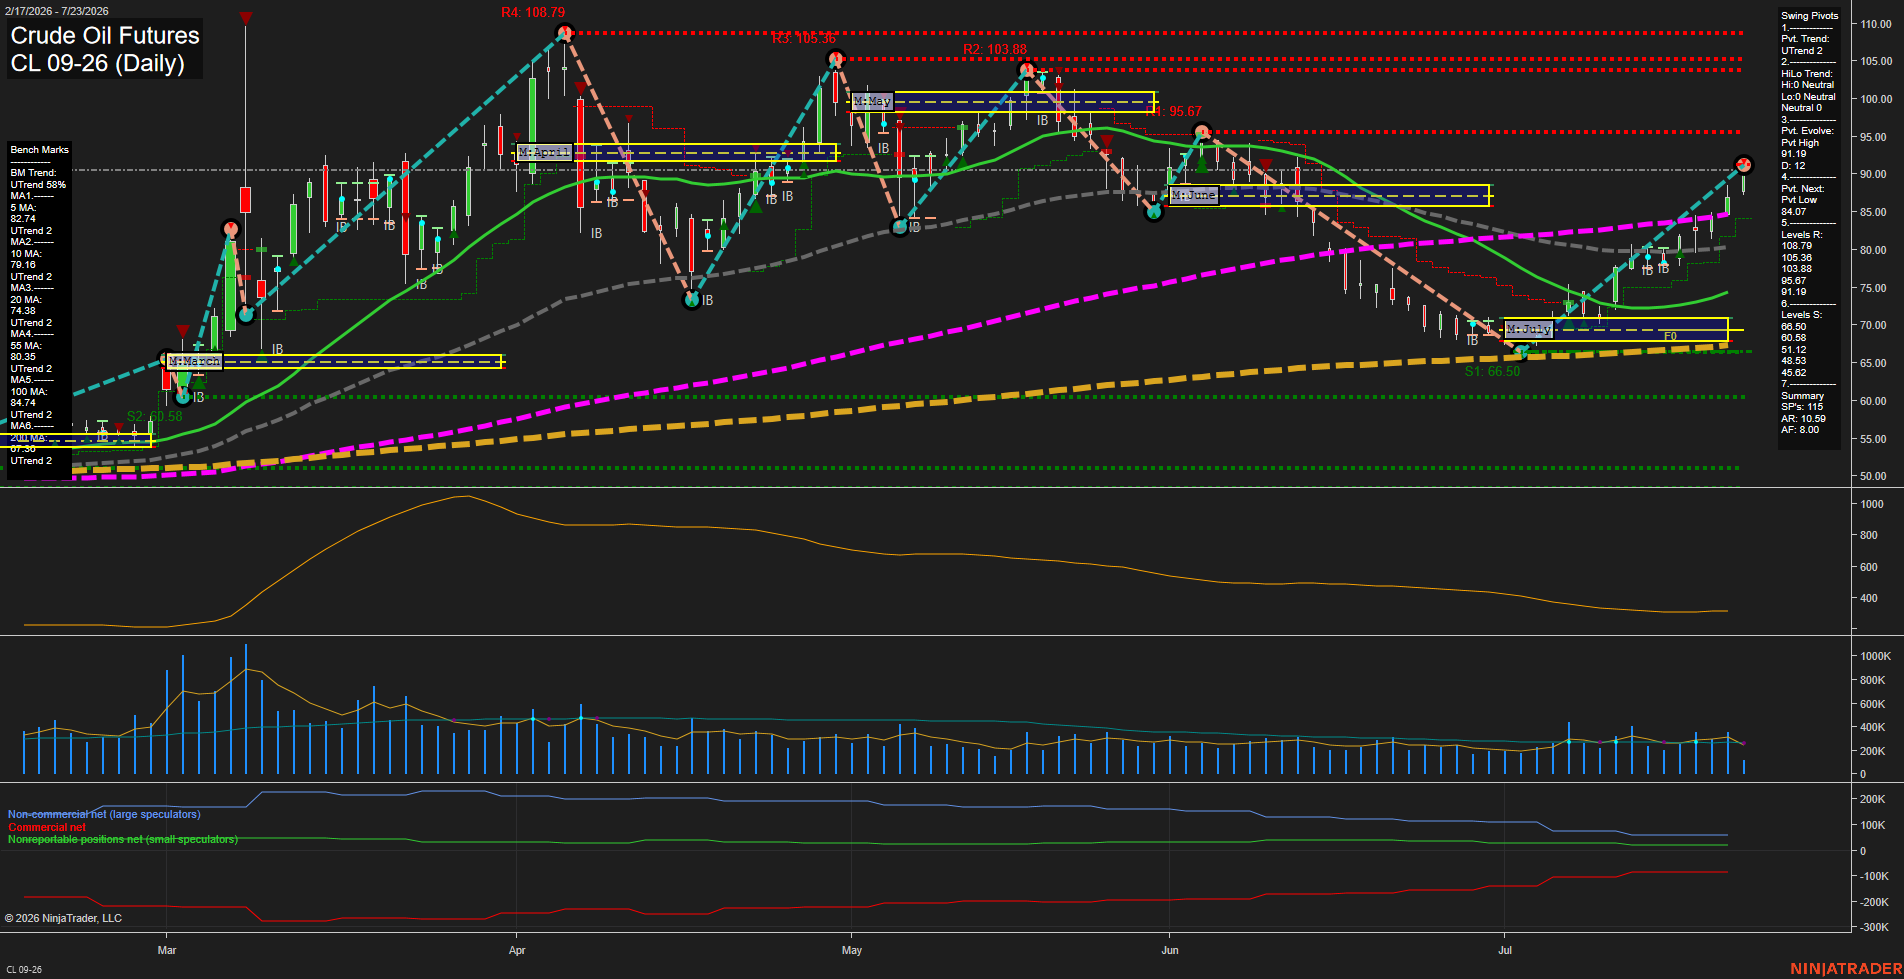
Price has produced a strong July V-recovery from the 66.50 area, with large-range upside bars and fast momentum lifting CL above all major daily benchmarks. The short-term pivot structure is upward, while the intermediate HiLo structure remains neutral following the prior May-to-July decline. The current advance is pressing toward the 91.69 pivot-high resistance, with 95.67 the next major overhead level. The 84.07 pivot-next level defines the near-term swing reference beneath price; the 20-day, 55-day, and 100-day averages cluster below and reinforce the broader recovery structure. Volume is moderate relative to the earlier spring activity, while ATR has contracted substantially from its peak, indicating a less volatile but still directional recovery phase.
View charts on: AlphaWebTrader HTF Charts
GC Daily View
Overall Rating
- Short-Term: Bullish
- Intermediate-Term: Neutral
- Long-Term: Bearish.
Key Insights Summary
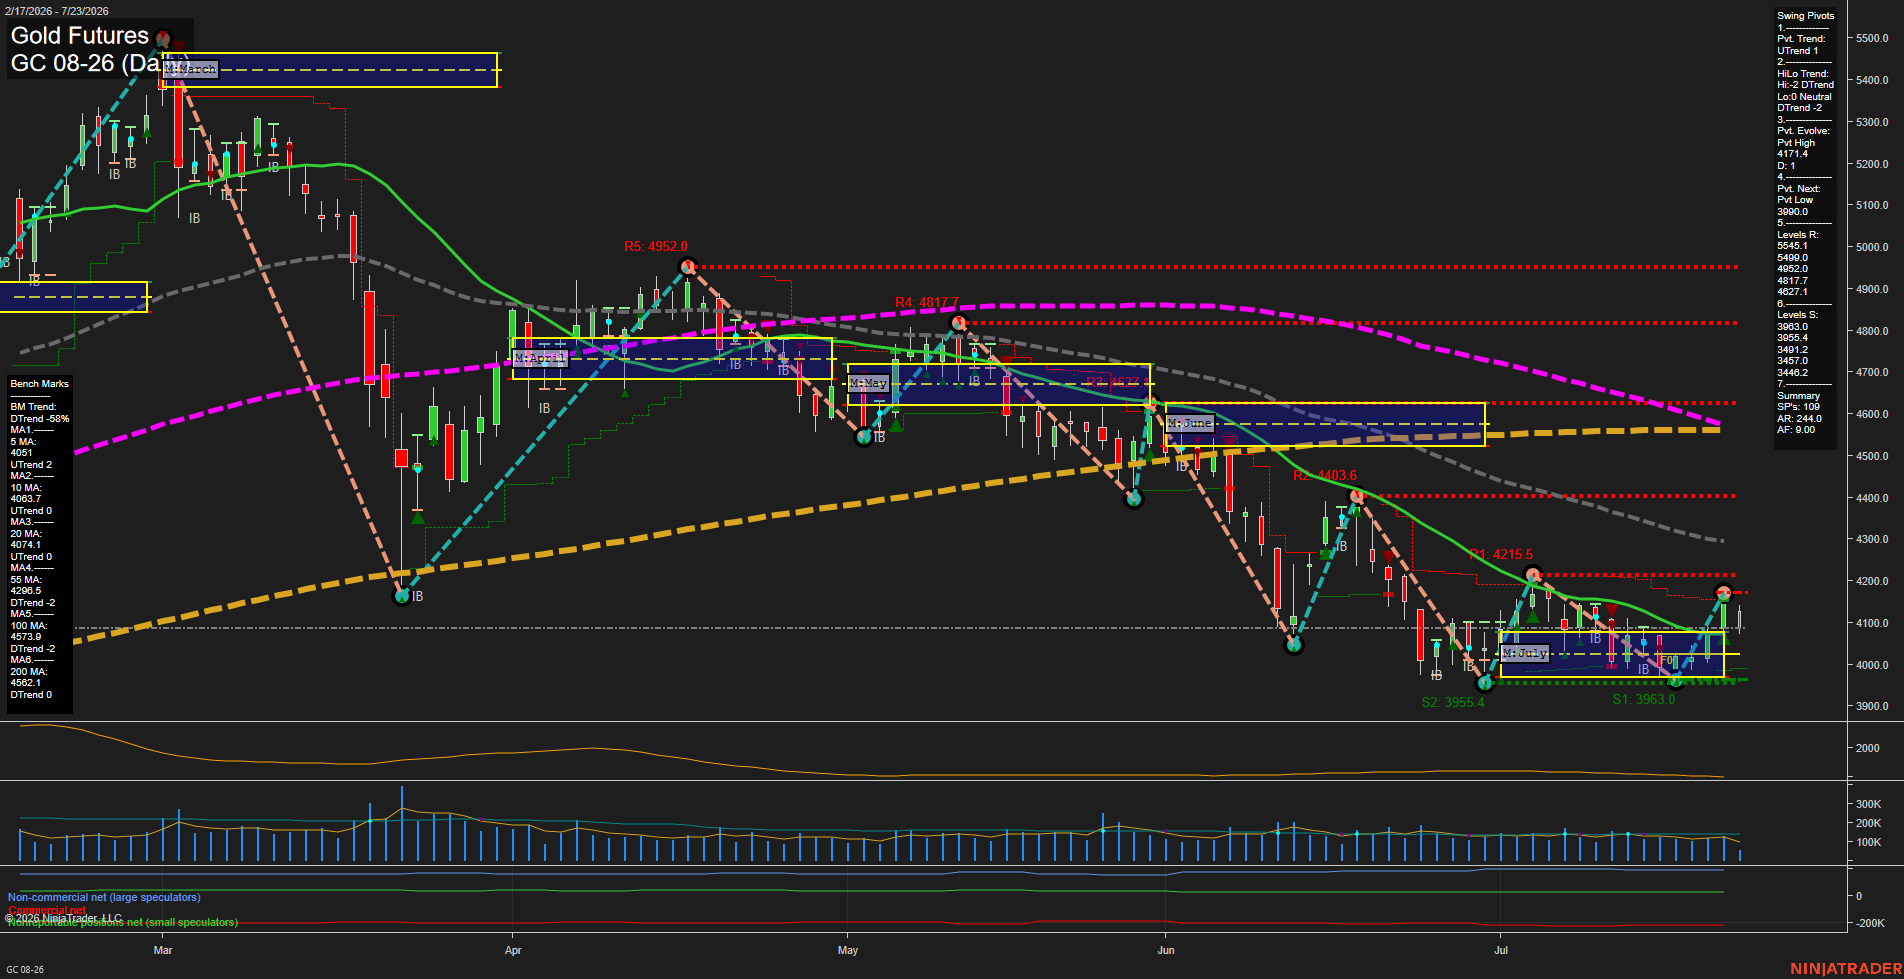
Gold is showing a short-term recovery from the July 3955-3963 support area, with price above the 5-, 10-, and 20-day benchmarks and a current UTrend pivot structure. The advance remains a countertrend bounce within the broader intermediate and long-term decline, as the HiLo trend is down and price remains below the declining 55-, 100-, and 200-day averages. The 4171 pivot high is the immediate swing reference, while 3955-3963 remains the nearby structural support zone. Small daily bars, slowing momentum, and subdued volume indicate a consolidating rebound rather than a broad upside expansion.
View charts on: AlphaWebTrader HTF Charts