NYSE pre-market review tracks ETF movers and futures in ES, NQ, YM, RTY and FDAX as U.S. stocks hold record highs and oil weakens on easing risk.
Fundamentals: U.S. equities extended gains in pre-market trade as reports of a preliminary U.S.-Iran ceasefire framework lifted risk sentiment and kept the S&P 500 and Nasdaq near record levels. Crude oil weakened on reduced conflict risk, while gold and silver held firmer. Inflation concerns, rate sensitivity in small caps, and heavy AI spending remained part of the broader market backdrop.
Technicals: The pre-market session highlights mixed ETF performance, led by MSFT and GLD gains and declines in IBIT and USO. Futures analysis across ES, NQ, YM, RTY, EMD and FDAX shows broadly bullish weekly and daily structures, with prices trading near or above recent highs, moving averages aligned upward, and swing pivots still favoring higher highs and higher lows.
Pre-Market Trading 360° view Market Radar of: holidays, earnings, eco-news, market-news summary, news sentiment, prior session major ETFs, MAG7, Higher Time Frame Analysis Indices Futures Summary, and E-mini S&P500, Nasdaq 100, NYMEX Crude, Gold Futures Daily Chart analysis.
As of: May 29, 2026 07:16 CT
Earnings Radar
Monitoring for earnings releases by the Magnificent 7, AI-tech-related firms, and major financial institutions.
- AVGO Release: 2026-06-03 T:AMC
Conclusion: Broad index sensitivity centers on AVGO’s 2026-06-03 AMC release, with semiconductors and AI-linked market participation in focus. Market momentum and volume can slow ahead of major earnings releases, especially MAG7, AI, semiconductors, and related tech names.
For full details visit: Yahoo Earnings Calendar
Market News Summary:
U.S. equities, oil, and metals reacted to Iran ceasefire reports, while tech and small-cap themes stayed active amid record highs and inflation concerns.
Primary Drivers & Risks:
- Primary Driver: U.S.-Iran ceasefire optimism
- Primary Risk: Inflation and energy uncertainty
Tone:
Risk-on for equities, softer for energy, and mixed across macro signals.
Stock Market / ETFs / Indices:
The S&P 500 and Nasdaq set fresh record highs on Iran deal hopes, with futures and major indices supported by tech strength. Small-cap value and select growth stocks also drew attention, while the S&P 500 remained on pace for a strong monthly gain driven by technology.
Geopolitical:
Reports pointed to a preliminary U.S.-Iran ceasefire memorandum and progress toward negotiations over Iran’s nuclear program. Market attention centered on the Strait of Hormuz and the durability of the peace framework.
Oil / Energy:
Oil prices fell as traders priced in reduced conflict risk and possible reopening of shipping routes. Brent and WTI tracked weekly and monthly losses, with analysts also raising 2026 oil forecasts amid slower normalization in energy flows.
Gold / Metals:
Gold and silver rebounded from support as ceasefire hopes eased immediate pressure. Inflation risks and rate expectations kept both metals in consolidation despite the bounce.
Fed / Financials:
Rate-cut sensitivity remained a focus for small-cap value shares. Commentary from market participants also highlighted inflation edging higher and the burden of AI investment on returns.
Macro / Other:
Consumer savings data pointed to a lower household savings rate alongside the broader equity rally. Additional market notes flagged strong AI-linked spending, elevated memory-chip valuations, and continued strength in select media and insurance businesses.
Conclusion:
The main driver was the shift in sentiment around a U.S.-Iran ceasefire, which lifted equities and pressured crude oil. Tech leadership kept the major indices at record levels, while the move lower in energy prices reinforced the cross-asset response.
Secondary influences included inflation concerns, rate sensitivity in smaller stocks, and a mixed macro backdrop from weaker savings data and heavy AI spending. Gold and silver held firmer after the initial geopolitical shock eased, while oil remained tied to headlines around Hormuz and conflict de-escalation.
Market News Sentiment
Market News Articles: 13
- Positive: 61.54%
- Negative: 23.08%
- Neutral: 15.38%
Sentiment Summary: Market news was mostly positive at 62%, with 23% negative and 15% neutral coverage across 13 articles.
Conclusion: The news flow shows a positive overall tone, with positive articles outnumbering negative and neutral articles.
GLD,Gold Articles: 3
- Positive: 66.67%
- Neutral: 33.33%
Sentiment Summary: GLD and gold articles show 67% positive sentiment and 33% neutral sentiment.
Conclusion: The snapshot is predominantly positive for gold-related coverage, with no negative sentiment reported.
USO,Oil Articles: 7
- Negative: 57.14%
- Positive: 42.86%
Sentiment Summary: USO and oil articles were moderately negative overall, with 57% negative coverage and 43% positive coverage across 7 articles.
Conclusion: The sentiment snapshot reflects a negative tone in oil-related news, based on the majority of articles being negative.
Market Data Snapshot
ETF Snapshot of major stock market ETFs, Mag7, and others as of: May 29, 2026 07:16
Top Movers & Losers
- MSFT 426.99 Bullish 3.47% ▲
- GLD 412.77 Bullish 1.05% ▲
- QQQ 735.60 Bullish 0.84% ▲
- META 635.29 Bullish 0.01% ▲
- USO 130.78 Bearish -0.19% ▼
- IBIT 41.56 Bearish -2.10% ▼
Major Index ETFs: SPY, QQQ, DIA, IWM, IJH
- QQQ 735.60 Bullish 0.84% ▲
- IWM 292.03 Bullish 0.57% ▲
- SPY 754.60 Bullish 0.55% ▲
- IJH 74.45 Bullish 0.12% ▲
- DIA 507.05 Bullish 0.03% ▲
Mixed-to-Bullish tone across the major index ETFs, led by QQQ at +0.84% as the most bullish mover, followed by IWM at +0.57% and SPY at +0.55%. IJH at +0.12% was near-flat, while DIA at +0.03% was the least positive mover.
Mag 7 Stocks: AAPL, MSFT, GOOG, AMZN, META, NVDA, TSLA
- MSFT 426.99 Bullish 3.47% ▲
- AMZN 274.00 Bullish 0.79% ▲
- NVDA 214.25 Bullish 0.78% ▲
- AAPL 312.51 Bullish 0.53% ▲
- TSLA 442.10 Bullish 0.40% ▲
- GOOG 386.12 Bullish 0.34% ▲
- META 635.29 Bullish 0.01% ▲
Mixed-to-Bullish tone across the group, led by MSFT at +3.47% as the most bullish mover; AMZN +0.79%, NVDA +0.78%, AAPL +0.53%, and TSLA +0.40% were modestly higher, while GOOG +0.34% and near-flat META at +0.01% were the least positive movers.
Cross-Market ETFs: TLT, GLD, USO, IBIT
- GLD 412.77 Bullish 1.05% ▲
- TLT 85.74 Bullish 0.52% ▲
- USO 130.78 Bearish -0.19% ▼
- IBIT 41.56 Bearish -2.10% ▼
Mixed: GLD was the most bullish mover at +1.05%, with TLT also bullish at +0.52%; USO was marginally bearish at -0.19%, while IBIT was the most bearish mover at -2.10%.
ETF, Mag7, and Cross-Market ETF Insights
Overall Tone
Mixed-to-Bullish tone overall, with equities broadly green and leadership concentrated in large-cap tech rather than a uniform risk-on surge.
Equity ETFs and Mag7:
SPY +0.55%, QQQ +0.84%, DIA +0.03%, IWM +0.57%, and IJH +0.12% were all positive, but the advance was selective and strongest in growth-heavy exposure. Among Mag7, MSFT led decisively at +3.47%, while AMZN +0.79% and NVDA +0.78% also supported the group; META was essentially flat at +0.01%, making it the most muted mover. The most bullish mover in this set was MSFT +3.47%, while DIA was the least positive at +0.03%.
Cross-Market ETFs:
Cross-market action was more mixed, with GLD firm at +1.05% and TLT modestly higher at +0.52%, while USO slipped -0.19% and IBIT fell sharply -2.10%. That combination shows hedging assets outperforming energy and bitcoin, creating some divergence versus the generally constructive equity tape. The most bullish mover was GLD +1.05%, and the most bearish mover was IBIT -2.10%.
Futures Indices – Higher Time Frame Analysis
Summary of the current state of US Indices Futures based on higher time-frame (HTF) technical analysis as of: 2026-05-29: 07:16 CT.
US Indices Futures
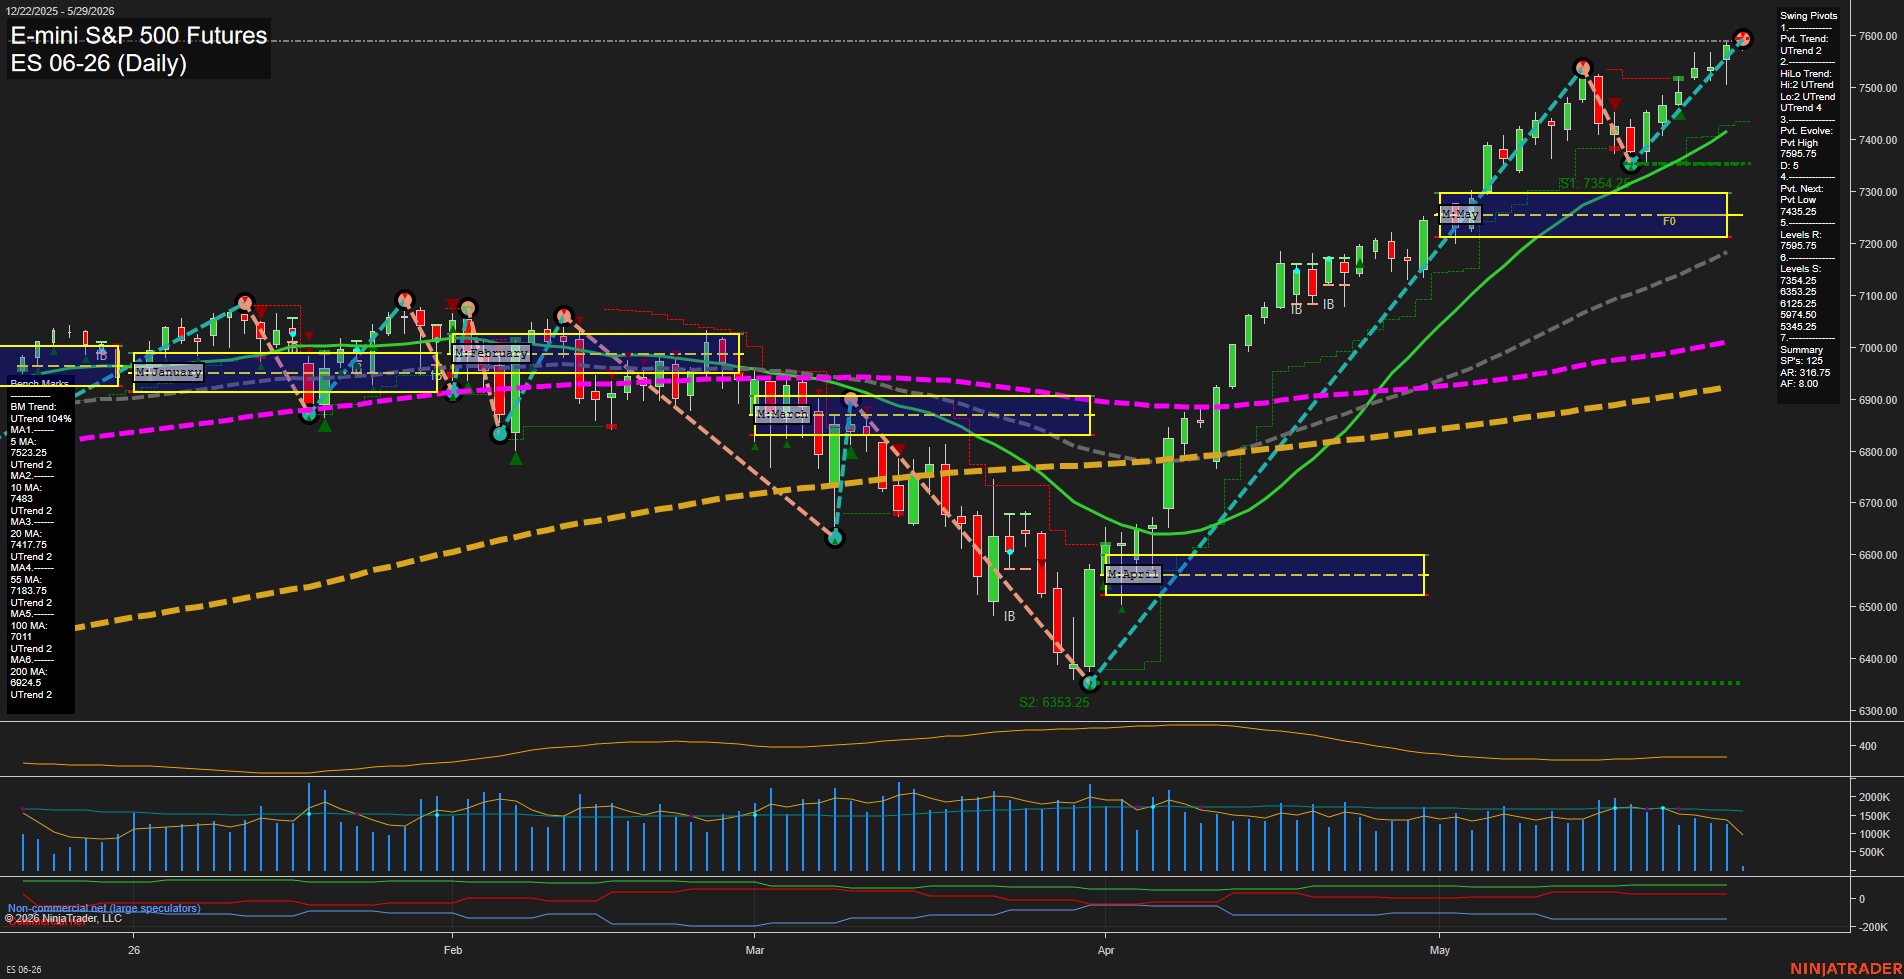
- ES bullish on WSFG/MSFG/YSFG, benchmarks stacked higher, swing pivots in UTrend, resistance near 7595.75, support from prior April base and weekly fib midlines.
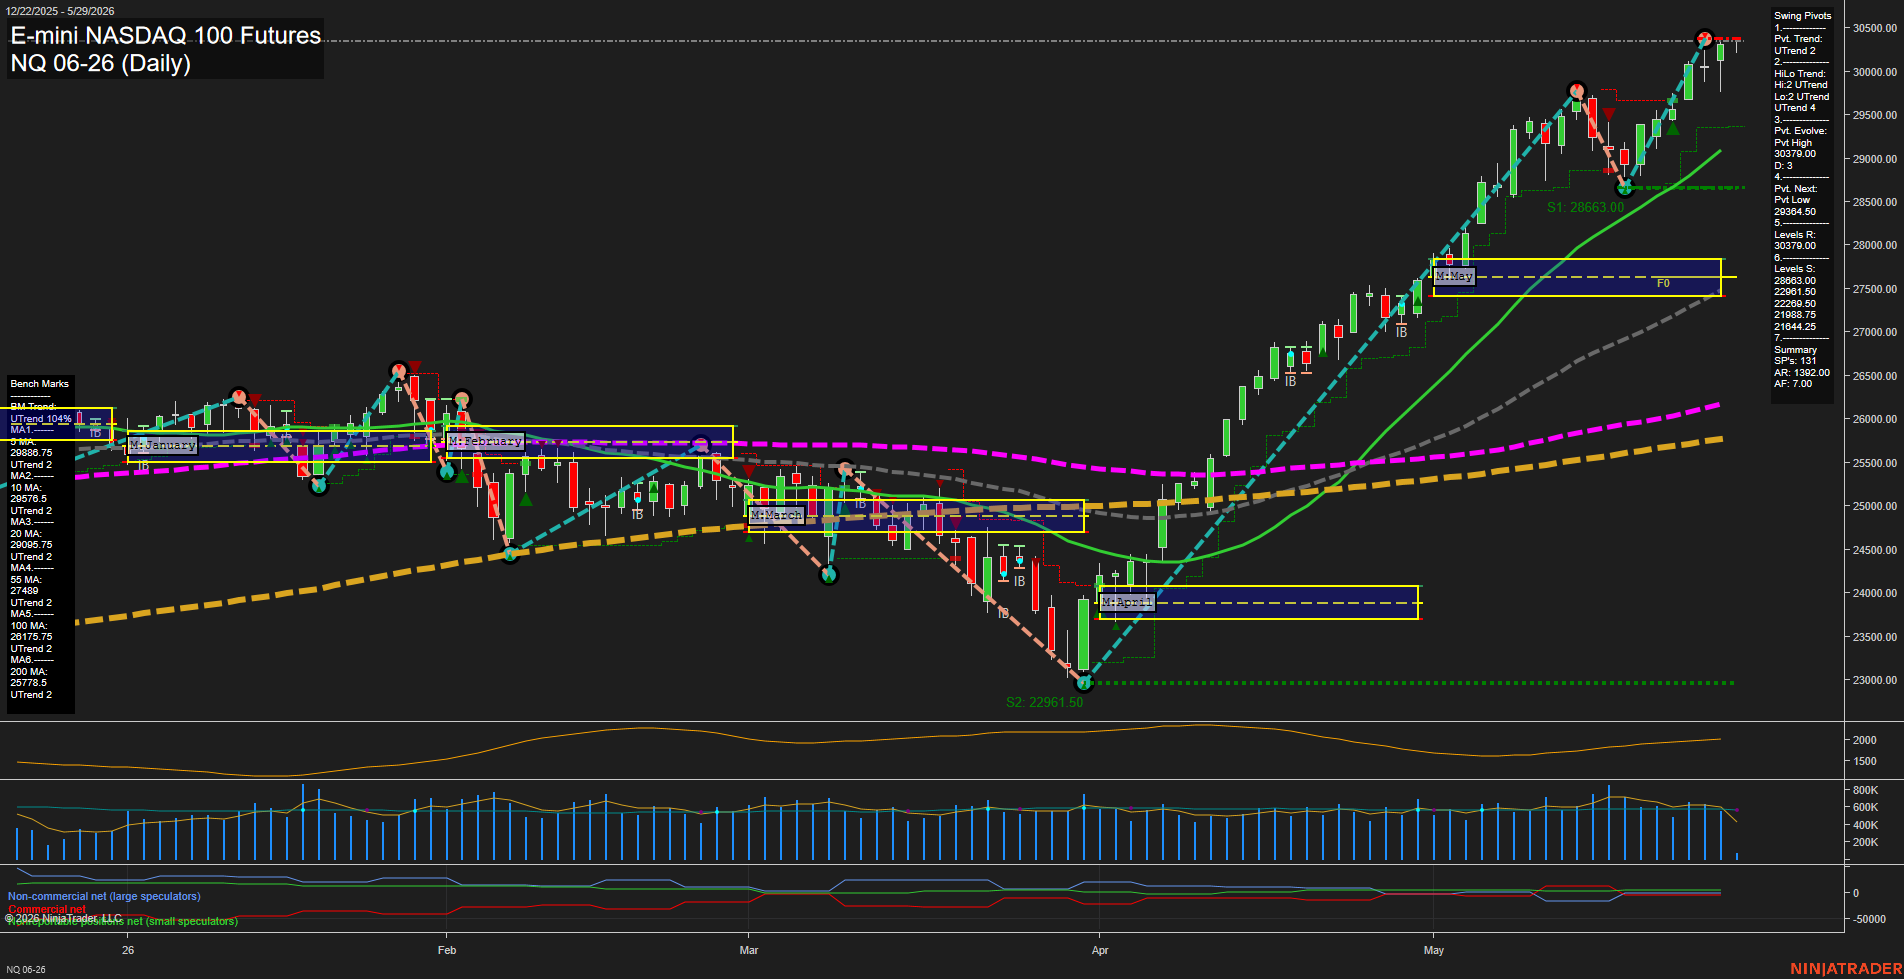
- NQ bullish on WSFG/MSFG/YSFG, benchmarks aligned upward, swing pivots in UTrend, resistance near 30379, next pivot support lower at 29364.50 and 27828 weekly.
- YM bullish across YSFG/MSFG/WSFG, benchmarks rising and stacked, swing pivots in UTrend, resistance near 51209, support from prior swing and fib grid midpoints.
- EMD bullish across WSFG/MSFG/YSFG, benchmarks fully aligned upward, higher-high continuation intact, resistance near 3760-3767, support layered through mid-3500s to low-3100s.
- RTY bullish across WSFG/MSFG/YSFG, benchmarks stacked higher, swing and HiLo trends in UTrend, resistance near 2952, support anchored near 2728.4 and 2726.1.
- FDAX bullish on weekly HTF, daily short-term neutral, benchmarks upward, pivots in uptrend, resistance 25494, 25656, 25854, support 24818, 23674, 22124.
Overall State
- Short-Term: Bullish
- Intermediate-Term: Bullish
- Long-Term: Bullish
Conclusion
US indices futures remain aligned in a broad HTF uptrend, with ES, NQ, YM, EMD, and RTY holding above weekly, monthly, and yearly fib-grid midlines and all major benchmarks stacked in bullish order. Swing pivots are largely in UTrend, with fresh highs or nearby pivot resistance defining the current reference zones. FDAX also holds a higher-timeframe upward structure, though its daily posture is mixed beneath the 5-day average. Across the group, price action reflects trend continuation, higher highs, higher lows, and support located beneath prior breakout and consolidation areas.
Note: Intra-day counter-trend pullbacks or retracements may occur, HTF is context for informational usage and market structure. Glossary: Session Fib Grids periods of YSFG:’Yearly’, MSFG:’Monthly’, WSFG:’Weekly’
For full details visit: AlphaWebTrader Technicals
ES Daily View
Overall Rating
- Short-Term: Bullish
- Intermediate-Term: Bullish
- Long-Term: Bullish.
Key Insights Summary
The daily structure remains strongly bullish with price pressing into fresh highs near the 7595.75 pivot resistance after a sharp May reversal from the 6353.25 swing low. Short-term swing pivots are in UTrend and the HiLo trend is also UTrend, confirming a higher-high, higher-low sequence with momentum expanding fast. Price is holding above the May MSFG midpoint/bias zone and remains above the weekly and yearly fib frameworks, which keeps the broader trend aligned to the upside. All benchmark moving averages are stacked in bullish order and trending higher, supporting a persistent trend regime rather than a mean-reverting or choppy backdrop. Recent price action shows strong continuation out of the April base, with prior consolidation zones now acting as support beneath the market.
View charts on: AlphaWebTrader HTF Charts
NQ Daily View
Overall Rating
- Short-Term: Bullish
- Intermediate-Term: Bullish
- Long-Term: Bullish.
Key Insights Summary
The daily chart remains in a strong upside expansion phase, with price pressing into fresh highs above all benchmark moving averages and holding well above the monthly and yearly session fib grids. Short-term structure is firmly in UTrend, and the swing pivot sequence continues to favor higher highs and higher lows, with the latest pivot high at 30379 and the next downside reference at 29364.50. The benchmark stack is fully bullish, showing a clear trend hierarchy from the 5-day through the 200-day average, which supports persistent trend continuation behavior. Recent price action shows a powerful rally leg with large daily bars and fast momentum, following a sharp V-shaped recovery from the April low area near 22961.50 and extending through the May consolidation zone into breakout territory. The current tape reflects strong trend continuation with overhead resistance now concentrated near the prior swing high zone, while the broader structure remains constructive across weekly, monthly, and yearly session fib measures.
View charts on: AlphaWebTrader HTF Charts
CL Daily View
Overall Rating
- Short-Term: Bearish
- Intermediate-Term: Bearish
- Long-Term: Bullish.
Key Insights Summary
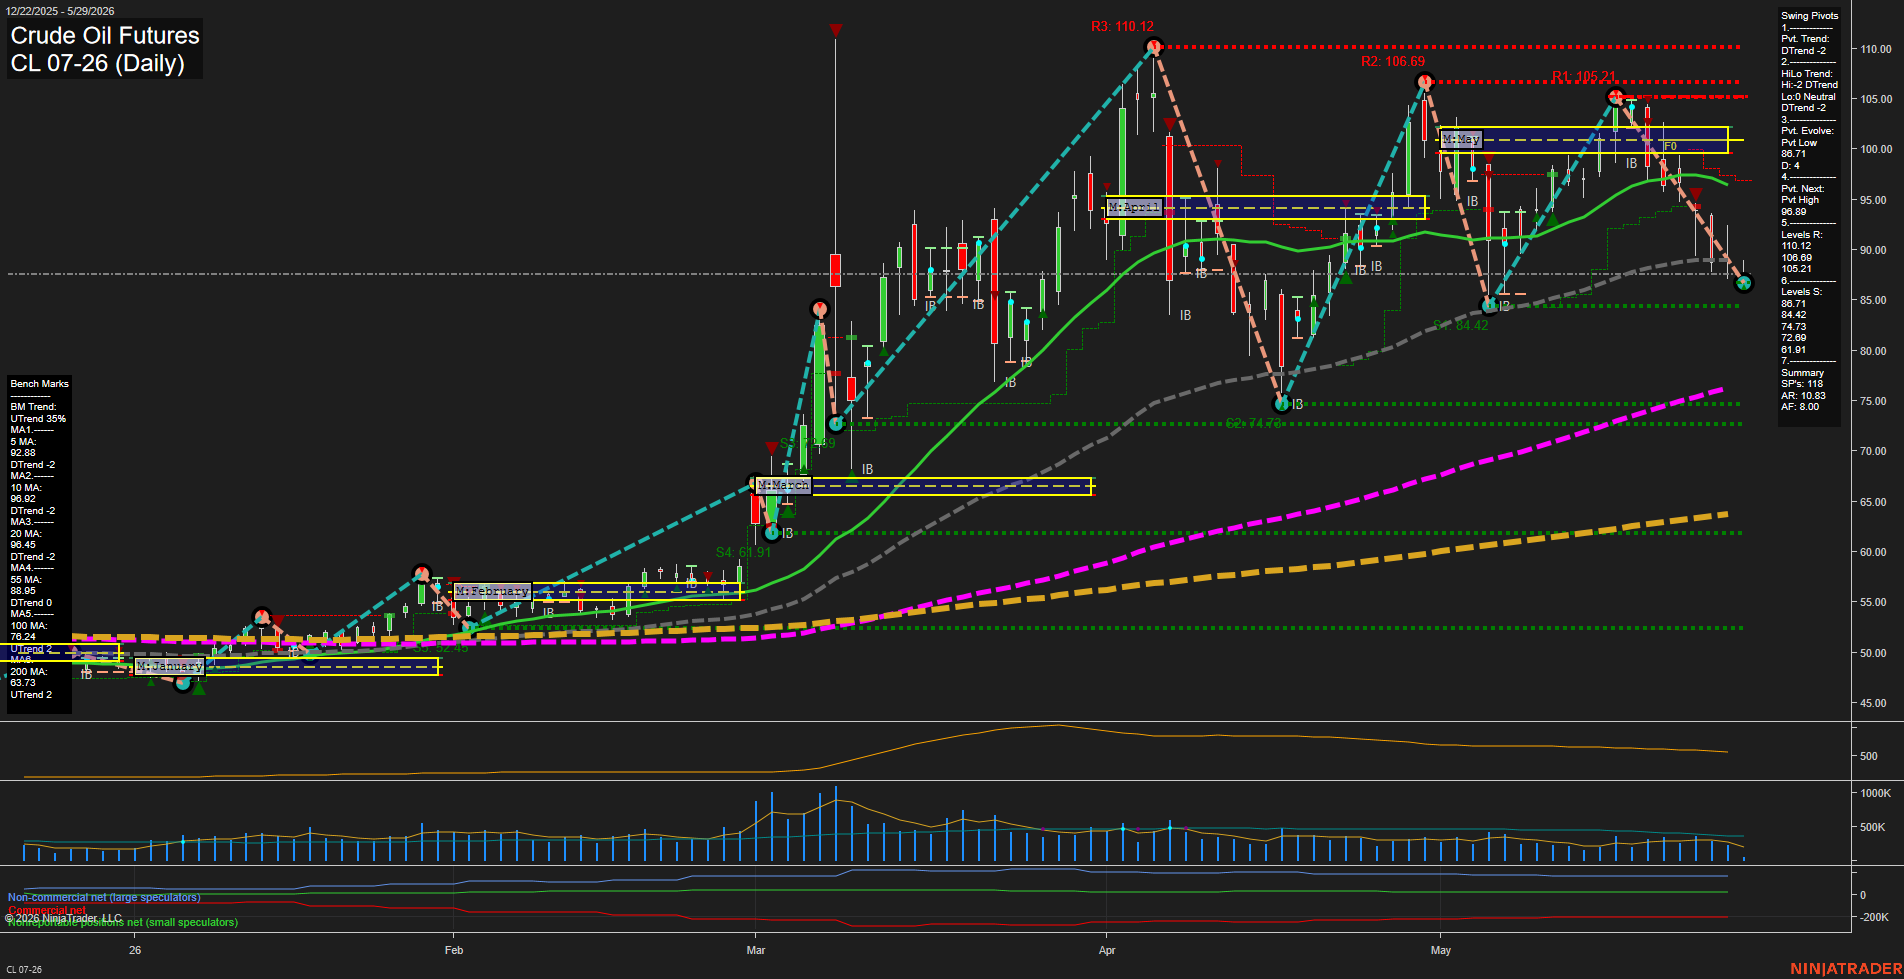
Crude oil is in a sharp daily selloff from the early-May swing high, with price back down into the mid-80s after failing near the 105-110 resistance band and then losing the monthly/weekly fib structure. The short-term pivot trend and Hi/Lo trend are both bearish, and the market is trading below the 5, 10, 20, and 55-day benchmarks, confirming downside control on the active swing. The longer-term structure remains constructive because the 100-day and 200-day averages are still rising and price remains well above those major trend references, so the larger backdrop is still upward even as the current swing has rolled over. The recent signal sequence also reflects that deterioration, with short signals printing at the weekly, monthly, and long-cycle levels. Overall, the chart shows a strong corrective leg within a broader uptrend, with volatility elevated and momentum expanding to the downside.
View charts on: AlphaWebTrader HTF Charts
GC Daily View
Overall Rating
- Short-Term: Bearish
- Intermediate-Term: Bearish
- Long-Term: Neutral.
Key Insights Summary
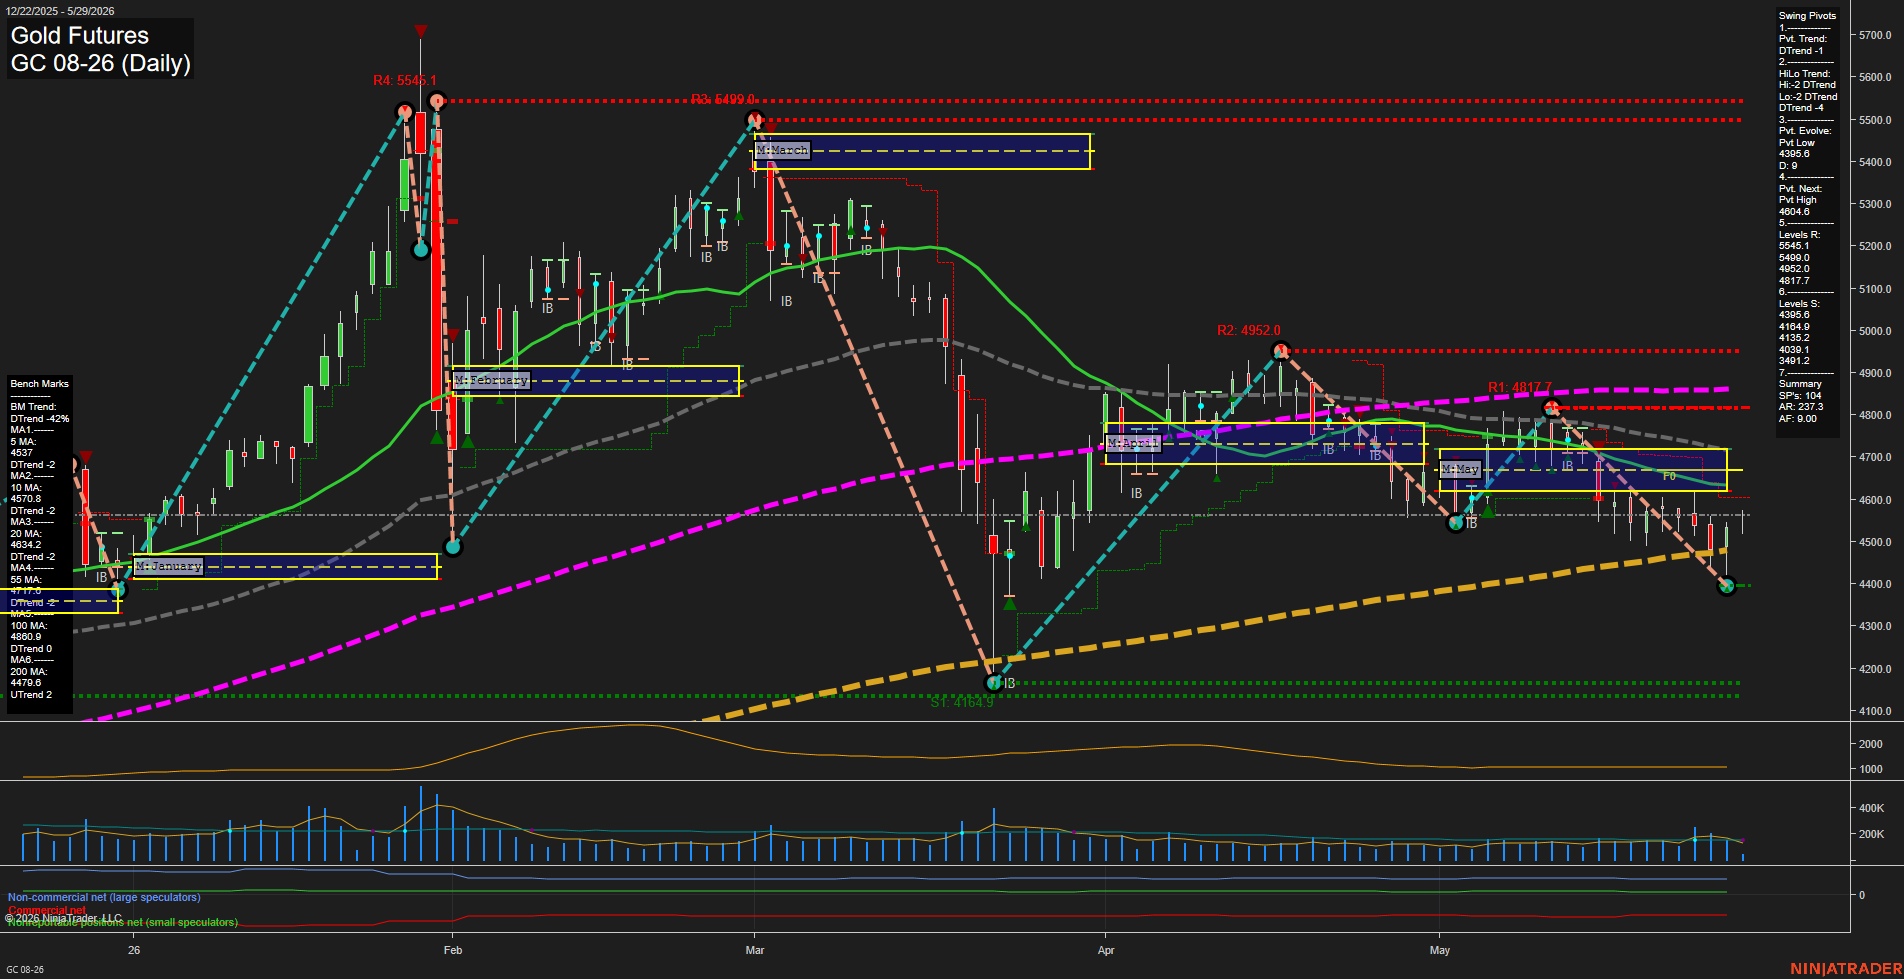
Gold futures are trading in a fast downside swing with price pressed below the short- and intermediate-term benchmark averages, while the daily pivot structure remains in DTrend and the next pivot focus is a higher swing high near 4604.6. The weekly fib grid still holds an upward bias, but the monthly and yearly session grids remain below their f0% zones with down trends, keeping the larger backdrop corrective to bearish. Recent price action shows a sharp retracement from the 4800-4950 resistance zone toward the 4400 area, with the current bar sitting near support derived from the latest pivot low region and the 200-day benchmark. The setup reflects a volatile pullback inside a broader two-sided sequence, with overhead resistance clustered at 4817.7, 4952.0, and 5499.0, while downside reference levels remain layered at 4395.6, 4164.9, and 4039.1.
View charts on: AlphaWebTrader HTF Charts