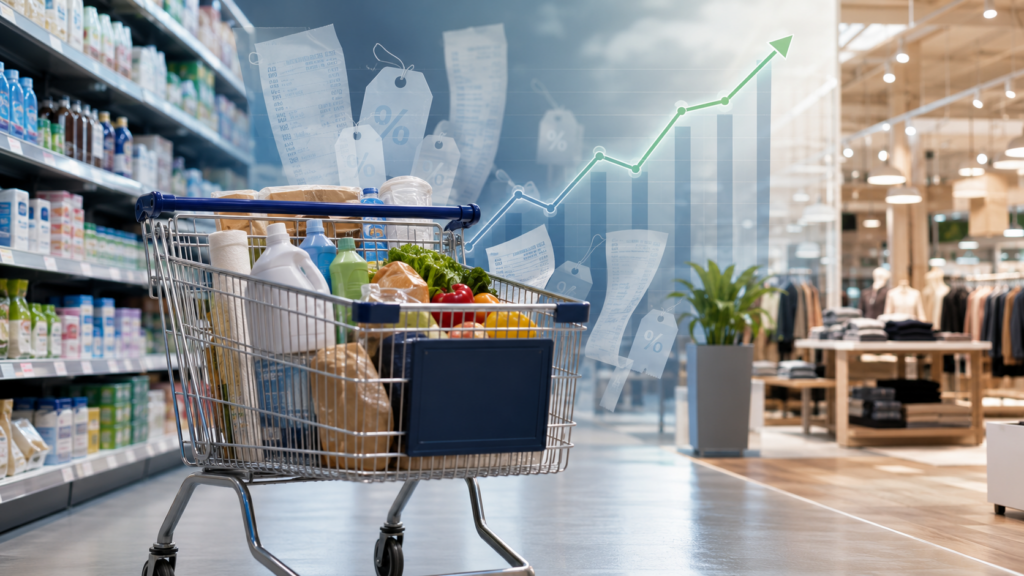
Unadjusted US retail-sales data for June 2026, adjusted using CPI All Items, provides an encouraging indication of recovery in real consumer spending. However, the wider six-month trend remains more moderate than the June result alone suggests.
Official June 2026 Retail Sales
The US Census Bureau estimated seasonally adjusted retail and food-services sales of $768.6 billion in June 2026. This represented an increase of 0.2% from May and 6.7% from June 2025 before accounting for inflation.
The monthly increase carried a margin of error of plus or minus 0.4 percentage points. The Census Bureau therefore found insufficient statistical evidence to conclude that the underlying monthly change was different from zero.
For the second quarter, covering April through June, nominal retail and food-services sales increased by 6.4% compared with the same period in 2025.
Calculating Inflation-Adjusted Retail Sales
This analysis uses retail-sales estimates that are not adjusted for seasonal variation, holidays or trading-day differences. The figures are adjusted using the unadjusted Consumer Price Index for All Urban Consumers.
The real-growth proxy is calculated as follows:
Real retail-sales growth = ((current retail sales ÷ previous retail sales) ÷ (current CPI ÷ previous CPI) – 1) × 100
This ratio calculation is more accurate than simply subtracting the published inflation rate from nominal retail-sales growth.
It should nevertheless be considered an analytical proxy rather than an official measure of real retail sales. CPI All Items covers a broader range of goods and services and does not precisely match the composition of the retail-sales basket.
Verified June 2026 Results
| Measure | June 2025 | June 2026 | Nominal Growth | Real Growth Proxy |
|---|---|---|---|---|
| Total retail and food-services sales | $716.698 billion | $776.915 billion | +8.402% | +4.704% |
| Total excluding gasoline stations | $663.111 billion | $712.087 billion | +7.386% | +3.723% |
The unadjusted CPI All Items index increased from 322.561 in June 2025 to 333.952 in June 2026. This was an exact increase of 3.531%, compared with the BLS published rounded rate of 3.5%.
The calculations confirm real year-over-year growth of 4.704% for total retail and food-services sales and 3.723% when gasoline stations are excluded.
The Six-Month Trend
| Month | Total Retail Sales | Excluding Gasoline Stations |
|---|---|---|
| January 2026 | +0.633% | +1.037% |
| February 2026 | +1.565% | +1.897% |
| March 2026 | +1.409% | +0.521% |
| April 2026 | +0.786% | -0.594% |
| May 2026 | +1.365% | -0.171% |
| June 2026 | +4.704% | +3.723% |
| Six-month average | +1.744% | +1.069% |
The six-month averages are positive, but the improvement was not uniform. Sales excluding gasoline stations contracted in real terms during April and May before rebounding strongly in June.
The data therefore supports a recovery in retail consumption, although June accounts for a significant part of the six-month improvement.
First-Half Cumulative Retail Sales
| Measure | First Half 2025 | First Half 2026 | Nominal Growth | Real Growth Proxy |
|---|---|---|---|---|
| Total retail and food services | $4.204 trillion | $4.420 trillion | +5.133% | +1.797% |
| Total excluding gasoline stations | $3.901 trillion | $4.072 trillion | +4.382% | +1.069% |
The cumulative first-half comparison provides a more stable assessment than June alone. It confirms moderate but positive growth in real consumer spending during the first six months of 2026.
Gasoline Continues to Absorb Purchasing Power
The difference between total sales and sales excluding gasoline stations indicates that energy-related expenditure continues to increase the headline retail-sales figure.
Unadjusted gasoline-station sales increased from $53.587 billion in June 2025 to $64.828 billion in June 2026, a nominal increase of approximately 20.98%. Over the same period, the BLS gasoline price index increased by 26.7%.
This suggests that the increase in gasoline-station revenue was driven primarily by prices rather than stronger fuel-consumption volumes. Gasoline-station sales also include nonfuel merchandise, so this should not be treated as an exact measure of fuel demand.
There was some encouragement in the latest monthly data. The gasoline price index declined by 9.7% in June. If lower gasoline and energy prices are sustained, they could release household income for spending elsewhere while reducing pressure throughout the production and distribution chain.
Implications for the Economy and Corporate Earnings
The retail-sales recovery provides a more supportive revenue environment for consumer-facing businesses and strengthens the outlook for second-quarter corporate revenues.
However, stronger retail sales do not automatically guarantee stronger profits. Earnings will also depend on wages, financing costs, energy, imported inputs, inventory valuations and operating expenses.
Heightened crude-oil futures activity may have supported trading revenue at some financial institutions, but this cannot be established from retail-sales data and will vary considerably between companies.
Conclusion
June 2026 produced an encouraging improvement in inflation-adjusted retail sales. Total real retail and food-services sales increased by approximately 4.704% year over year, while sales excluding gasoline stations increased by 3.723%.
The broader first-half results were more moderate, at approximately +1.797% for total sales and +1.069% excluding gasoline stations. The recovery is therefore positive but still developing, with June considerably stronger than the preceding months.
Lower gasoline and energy prices remain essential. They would release household purchasing power, support broader consumption and reduce cost pressure throughout the economic system.