NYSE close: earnings lifted the Dow to a record, but late technology losses, hawkish Fed remarks, lower oil and rising gold left markets mixed.
Fundamentals: Equities reached fresh intraday highs as strong corporate earnings supported risk appetite and the Dow set another record. The S&P 500 and Nasdaq later turned lower as large technology shares weakened. Oil extended declines amid Strait of Hormuz developments, while gold rose on lower Treasury yields and a softer dollar. Hawkish Fed comments and cyber risks added caution.
Technicals: Markets showed mixed ETF performance at the NYSE close, with gains in GLD, NVDA and IBIT offset by declines in Amazon, Tesla and Alphabet. Futures analysis remained broadly bullish across ES, NQ, YM, EMD, RTY and FDAX on daily and weekly timeframes, though several contracts were testing pivot resistance after rapid advances.
After Market Close daily snapshot: market news summary and sentiment, major ETFs, Magnificent 7 analysis, Indices Futures Higher Time Frame Analysis, and E-mini S&P500, Nasdaq 100, NYMEX Crude, Gold Futures Daily Chart analysis.
As of: August 5, 2026 05:00 CT
Market News Summary:
Strong earnings and Strait of Hormuz progress supported equities, while late technology weakness, hawkish Fed remarks, and elevated gold signaled important cross-currents.
Primary Drivers & Risks:
- Primary Driver: Earnings-led equity strength
- Primary Risk: Tech volatility and rate-hike concerns
Tone:
Constructive but mixed, with late-session caution.
Stock Market / ETFs / Indices:
Strong corporate profits lifted stocks to fresh intraday highs and carried the Dow to another record. The Nasdaq 100 had gained 9.3% in four sessions amid AI-driven technology strength, but the S&P 500 and Nasdaq finished lower after retreating from intraday peaks as several large technology shares weakened. Commentary also cited aggressive options positioning as a contributor to the S&P 500’s recent rally.
Geopolitical:
Iran said it reached an agreement with Oman on a proposed Strait of Hormuz shipping route. Reports of potential progress toward reopening the key energy passage supported risk sentiment, though Middle East developments remained a focus into the close.
Oil / Energy:
Oil fell for a second session as easing inflation concerns and Hormuz-related developments reduced the market’s inflation premium. Separately, volatile crude prices contributed to a fourfold decline in U.S. upstream oil-and-gas dealmaking during the second quarter.
Gold / Metals:
Gold rose sharply, with reports citing a 4% advance and prices above $4,250 an ounce. Falling Treasury yields and a weaker dollar supported precious metals alongside easing inflation and rate-hike concerns tied to Hormuz progress.
Fed / Financials:
Fed Governor Lisa Cook said inflation remained too high and that she was prepared to support a rate increase absent clear easing in price pressures. Other coverage noted increased trader attention to a potential Fed hike, while the Dallas and New York Fed banks plan a pilot survey of the private-credit market after the third quarter.
Macro / Other:
Higher lumber prices reflected reduced supply from Canadian duties, wildfires, and sawmill closures despite weak home-building activity. Cyberattack attempts targeting major Wall Street money managers added an operational risk for financial markets.
Conclusion:
Earnings strength, record Dow performance, and signs of progress on Hormuz shipping underpinned the session’s broader risk backdrop. Lower oil and a softer dollar supported the inflation narrative and gold.
Technology weakness left major benchmarks mixed after early highs. Hawkish Fed comments, options-driven market mechanics, Middle East uncertainty, and cyber risks remained notable cross-currents.
Market News Sentiment
Market News Articles: 64
- Neutral: 57.81%
- Negative: 23.44%
- Positive: 18.75%
Sentiment Summary: Market news sentiment is predominantly neutral (58%), with negative coverage (23%) exceeding positive coverage (19%).
Conclusion: The news flow presents a neutral overall tone with a modest negative skew for indices futures day traders.
GLD,Gold Articles: 14
- Positive: 92.86%
- Neutral: 7.14%
Sentiment Summary: GLD and gold coverage is 93% positive and 7% neutral across 14 articles, with no negative articles reported.
Conclusion: Gold-related news sentiment is predominantly positive, indicating a strongly favorable tone in the sampled coverage.
USO,Oil Articles: 9
- Neutral: 44.44%
- Negative: 44.44%
- Positive: 11.11%
Sentiment Summary: USO/Oil coverage was evenly split between neutral and negative sentiment at 44% each, with 11% positive.
Conclusion: Oil-related news tone was predominantly neutral-to-negative, with limited positive coverage.
Market Data Snapshot
ETF Snapshot of major stock market ETFs, Mag7, and others as of: August 5, 2026 05:00
Top Movers & Losers
- GLD 389.64 Bullish 4.14% ▲
- NVDA 219.22 Bullish 3.43% ▲
- IBIT 36.74 Bullish 0.96% ▲
- AMZN 272.65 Bearish -1.72% ▼
- TSLA 321.55 Bearish -1.77% ▼
- GOOG 360.13 Bearish -4.05% ▼
Major Index ETFs: SPY, QQQ, DIA, IWM, IJH
- DIA 542.81 Bullish 0.44% ▲
- SPY 769.79 Bearish -0.20% ▼
- IJH 77.00 Bearish -0.62% ▼
- IWM 299.77 Bearish -0.64% ▼
- QQQ 717.30 Bearish -0.90% ▼
Mixed index ETF snapshot: DIA is the most bullish mover at +0.44%, while QQQ is the most bearish mover at -0.90%. SPY is Bearish at -0.20%, with IJH at -0.62% and IWM at -0.64%, reflecting broader Bearish participation outside DIA.
Mag 7 Stocks: AAPL, MSFT, GOOG, AMZN, META, NVDA, TSLA
- NVDA 219.22 Bullish 3.43% ▲
- AAPL 311.00 Bullish 0.52% ▲
- META 588.77 Bullish 0.14% ▲
- MSFT 487.46 Bearish -1.09% ▼
- AMZN 272.65 Bearish -1.72% ▼
- TSLA 321.55 Bearish -1.77% ▼
- GOOG 360.13 Bearish -4.05% ▼
Mixed Mag7 snapshot: NVDA is the most bullish mover at +3.43%, while GOOG is the most bearish mover at -4.05%. AAPL added +0.52% and META was marginally Bullish at +0.14%; MSFT declined -1.09%, AMZN -1.72%, and TSLA -1.77%.
Cross-Market ETFs: TLT, GLD, USO, IBIT
- GLD 389.64 Bullish 4.14% ▲
- IBIT 36.74 Bullish 0.96% ▲
- TLT 83.00 Bullish 0.22% ▲
- USO 114.88 Bearish -0.78% ▼
Other ETFs were Mixed: GLD was the most bullish mover at +4.14%, while IBIT gained +0.96% and TLT added a marginal +0.22%. USO was the most bearish mover at -0.78%.
ETF, Mag7, and Cross-Market ETF Insights
Overall Tone
Mixed conditions: equity leadership was selective while cross-market ETFs showed Bullish precious-metal and bitcoin participation alongside Bearish oil.
Equity ETFs and Mag7:
Major Index ETFs were Mixed, with DIA Bullish at +0.44% while SPY was Bearish at -0.20%, IJH -0.62%, IWM -0.64%, and QQQ -0.90%. Mag7 action was selective: NVDA was the most bullish equity mover at +3.43%, followed by AAPL at +0.52% and marginally Bullish META at +0.14%; GOOG was the most bearish mover at -4.05%, with TSLA -1.77%, AMZN -1.72%, and MSFT -1.09% also Bearish. Equities were not broadly aligned, as DIA strength and NVDA leadership contrasted with Bearish small caps, mid caps, QQQ, and most Mag7 names.
Cross-Market ETFs:
Cross-market ETFs were Mixed, led by GLD as the most bullish mover at +4.14%, while IBIT was Bullish at +0.96% and TLT was modestly Bullish at +0.22%. USO was the most bearish cross-market mover at -0.78%, diverging from Bullish gold, bitcoin, and Treasuries.
Futures Indices – Higher Time Frame Analysis
Summary of the current state of US Indices Futures based on higher time-frame (HTF) technical analysis as of: 2026-08-05: 17:00 CT.
US Indices Futures
- ES: YSFG/MSFG/WSFG above F0%/NTZ, above benchmarks, 7830/7808 resistance, 7401.50 pivot support, 7353.50 lower support; higher highs/lows.
- NQ: YSFG/MSFG/WSFG upward, above benchmarks, 29990 pivot resistance, 30975.50-31090 overhead band, 28537.50 pivot support; higher-high/higher-low sequence intact.
- YM: YSFG/MSFG/WSFG above centers, all benchmarks rising, above 54504 pivot resistance, 54578 high, 53096 support, 51630 major support; long signals aligned.
- EMD: YSFG/MSFG/WSFG above F0%/NTZ, benchmarks rising, 3899.2-3899.9 resistance, 3793.3 pivot support, 3671.1 reversal threshold, 3304.7 support.
- RTY: YSFG/MSFG/WSFG aligned upward, above benchmarks, 3057.7-3068.4 pivot resistance, 2902.3 swing support; daily UTrend restored, intermediate HiLo neutral.
- FDAX: MSFG/WSFG above F0%/NTZ, above rising benchmarks, 26524 pivot resistance, 25800 next-pivot support, 24880 reversal threshold; higher highs/lows.
Overall State
- Short-Term: Bullish
- Intermediate-Term: Bullish
- Long-Term: Bullish
Conclusion
All six indices retain bullish HTF alignment. YSFG, MSFG, and WSFG conditions are upward or above F0%/NTZ references, with price generally above rising benchmark averages and higher-high/higher-low pivot structures. ES, NQ, YM, EMD, RTY, and FDAX are testing or extending through active pivot-high resistance. Recent momentum expansions place several markets above short-term benchmarks, while listed pivot-next and reversal levels define lower swing references. YM, EMD, RTY, and FDAX correlate with the broad advance; NQ remains beneath its 30975.50-31090 resistance band.
Note: Intra-day counter-trend pullbacks or retracements may occur, HTF is context for informational usage and market structure. Glossary: Session Fib Grids periods of YSFG:’Yearly’, MSFG:’Monthly’, WSFG:’Weekly’
For full details visit: AlphaWebTrader Technicals
ES Daily View
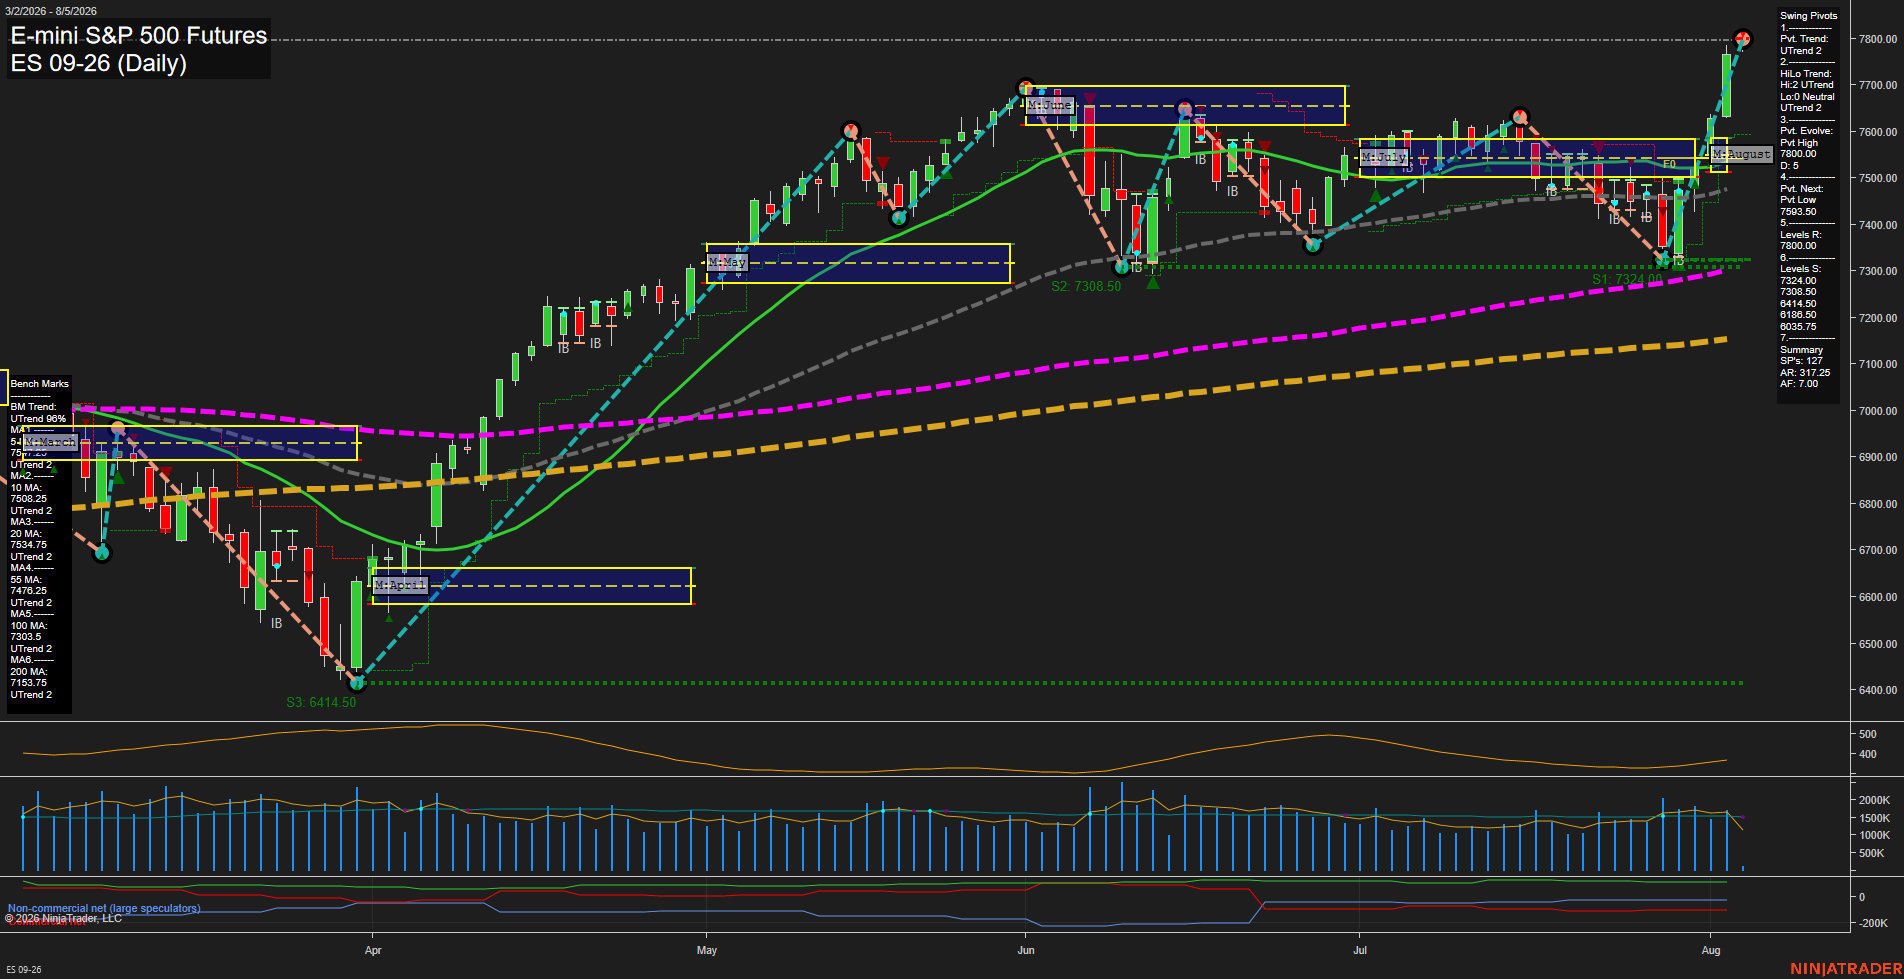
Overall Rating
- Short-Term: Bullish
- Intermediate-Term: Bullish
- Long-Term: Bullish.
Key Insights Summary
ES is in a broad multi-timeframe uptrend, with price decisively above every daily benchmark and above the weekly, monthly, and yearly F0%/NTZ structures. The latest large-range advance is a fast momentum expansion through the late-July consolidation and into the 7800 area, leaving the active 7830.00 pivot-high resistance as the immediate structural reference. Higher swing lows and the UTrend reading in both pivot measures confirm trend continuation, while the distance above the short-term averages reflects a strong, extended upside impulse. Volume is firm near its moving-average measure and ATR reflects an elevated daily range environment; the 7353.50 pivot-next level and clustered 7324.00-7308.50 supports remain the principal lower swing structure.
View charts on: AlphaWebTrader HTF Charts
NQ Daily View
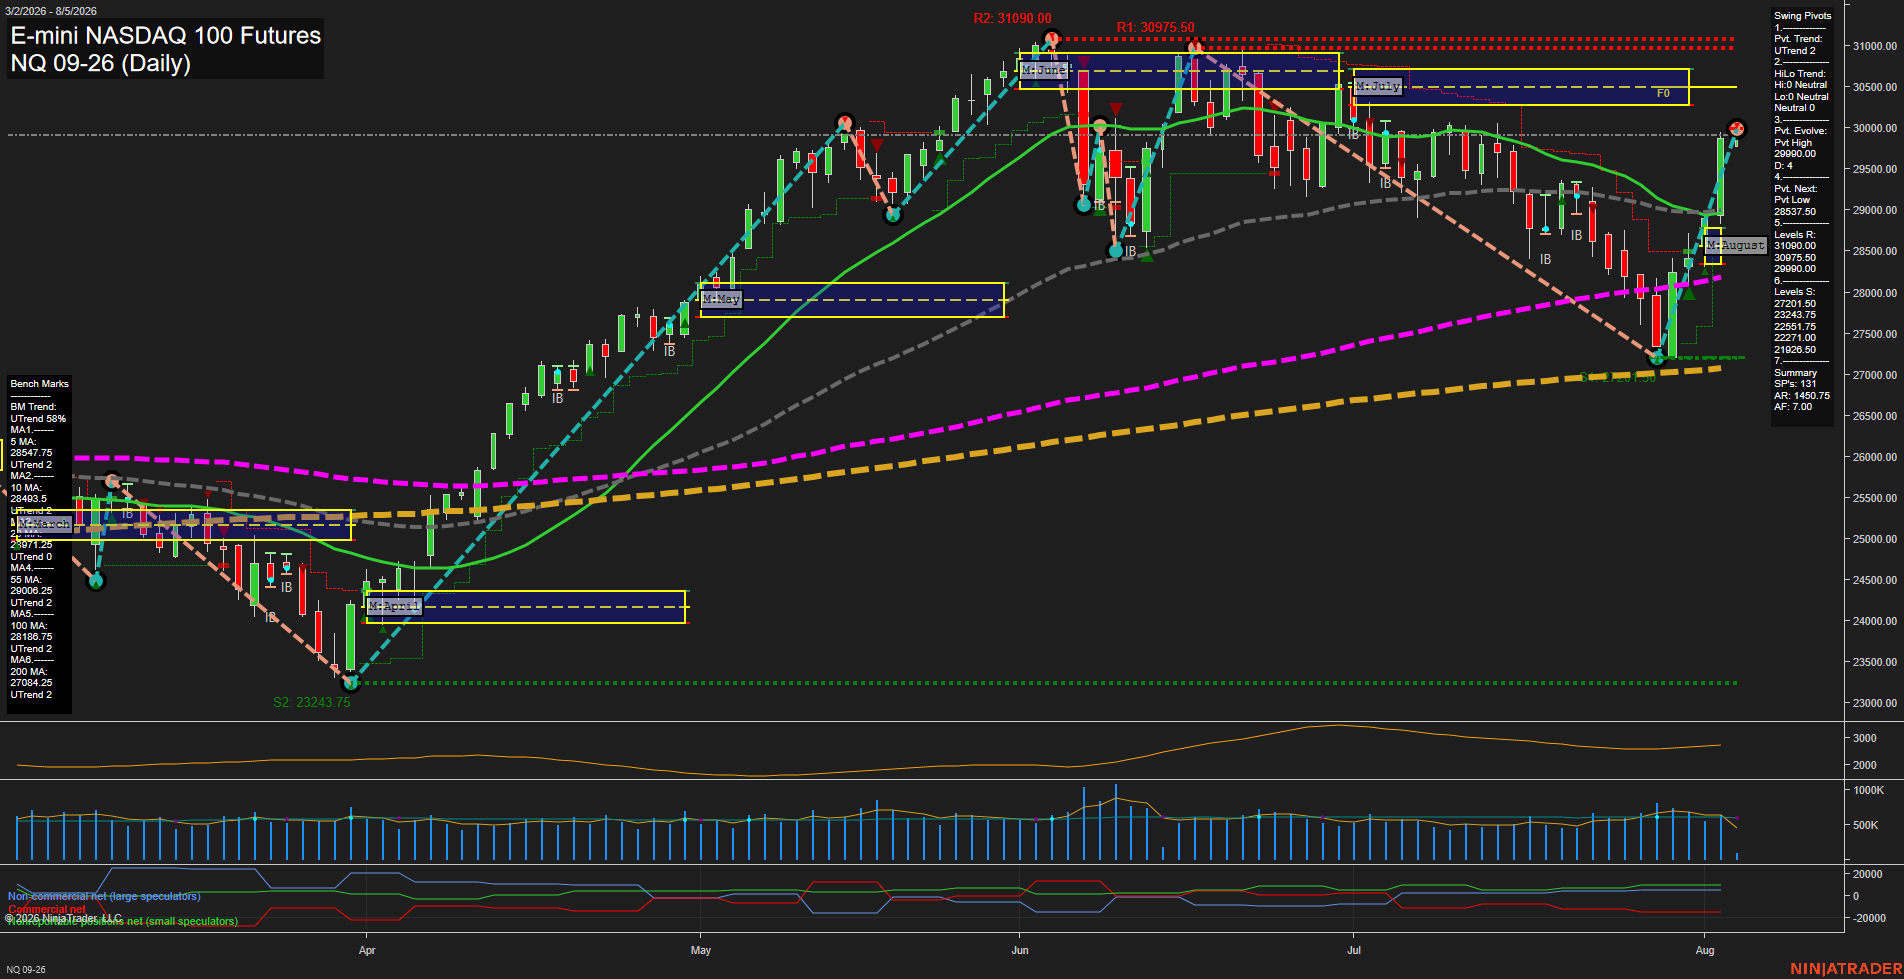
Overall Rating
- Short-Term: Bullish
- Intermediate-Term: Bullish
- Long-Term: Bullish.
Key Insights Summary
The daily structure reflects a sharp V-recovery from the late-July swing low, with large-range upside price action restoring the short-term pivot trend to UTrend. Price has reclaimed the 20-day and 55-day benchmarks and remains above all longer-term moving averages, maintaining alignment with the broader uptrend. The 29990 pivot-high area is the immediate structural reference, while 30975.50 to 31090.00 marks the principal overhead resistance band. The 28537.50 pivot-low reversal level defines the nearby swing support reference beneath the recovery.
View charts on: AlphaWebTrader HTF Charts
CL Daily View
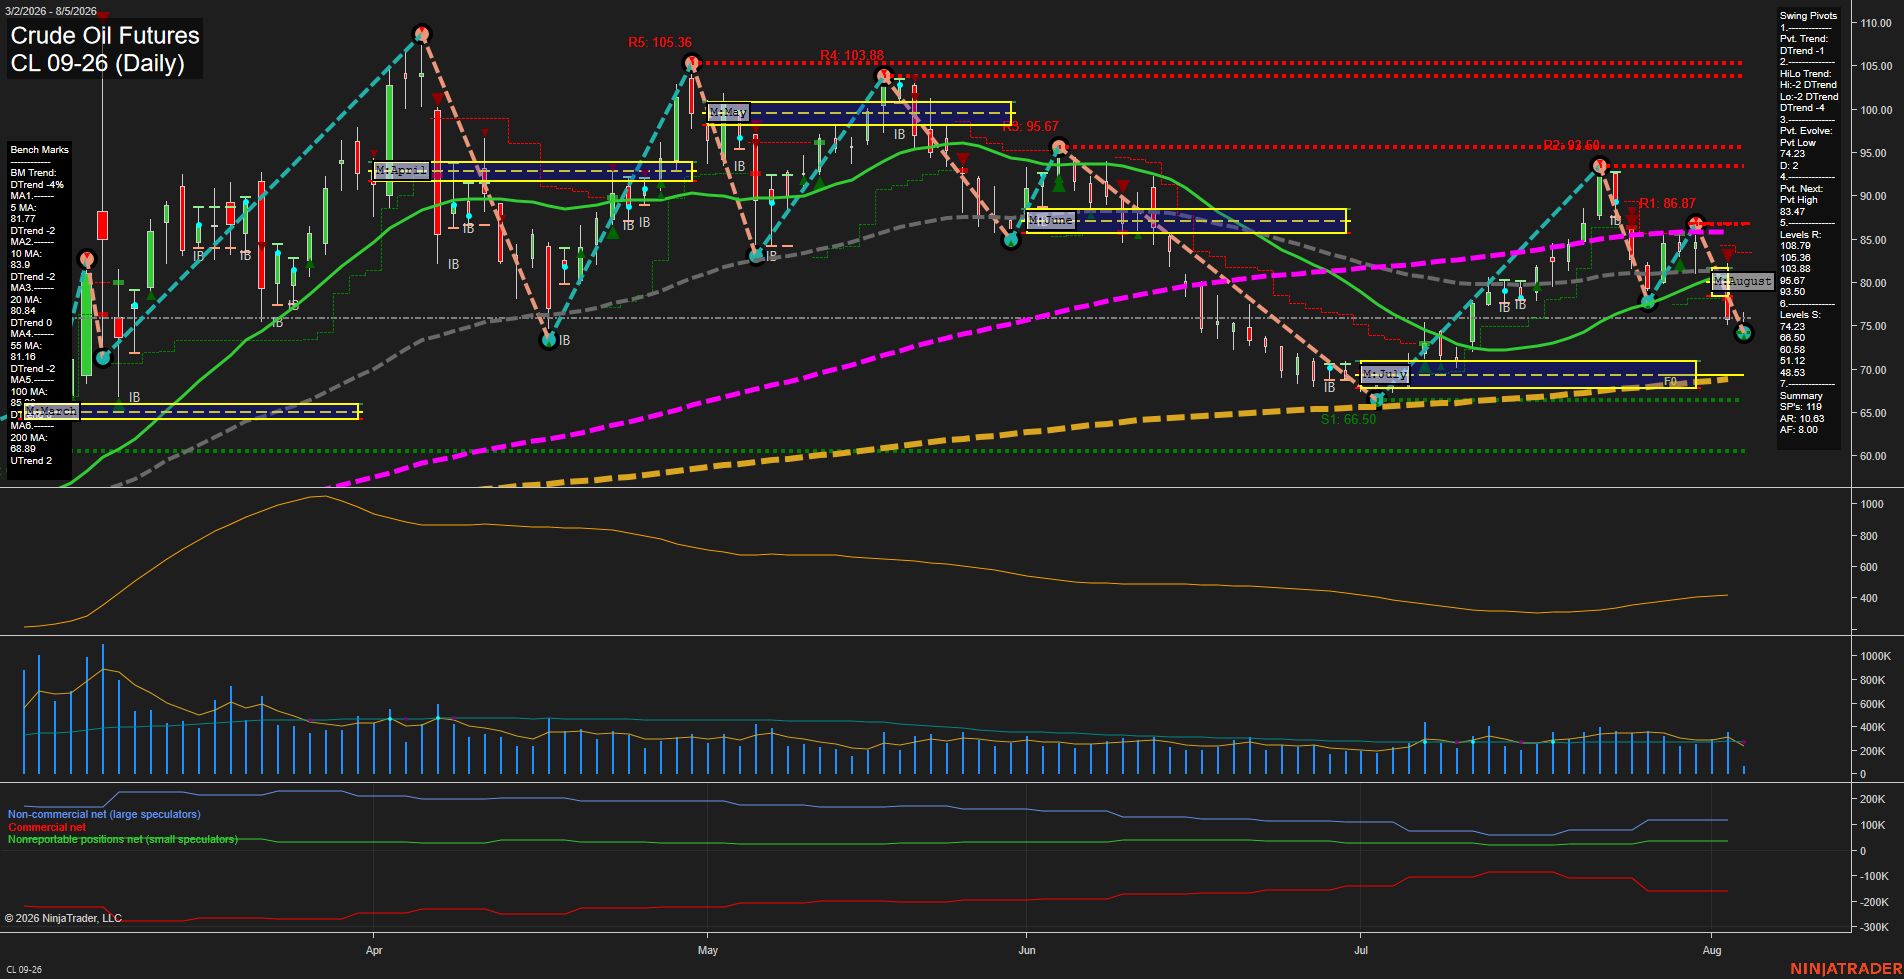
Overall Rating
- Short-Term: Bearish
- Intermediate-Term: Bearish
- Long-Term: Bullish.
Key Insights Summary
CL has shifted into a sharp short-term selloff, with large downside bars and price below the weekly and August monthly F0%/NTZ areas. Both pivot trend measures are down, while price is beneath the 5-, 10-, 20-, and 55-day benchmarks, confirming broad near- and intermediate-term downside alignment. The 74.23 pivot low is the immediate structural support, with 66.50 representing the larger support zone; 83.47 is the reversal threshold for a new short-term pivot high. The yearly grid and rising 100- and 200-day long-term benchmarks preserve a broader bullish backdrop, making the current decline a pronounced countertrend retracement within that longer-term structure.
View charts on: AlphaWebTrader HTF Charts
GC Daily View
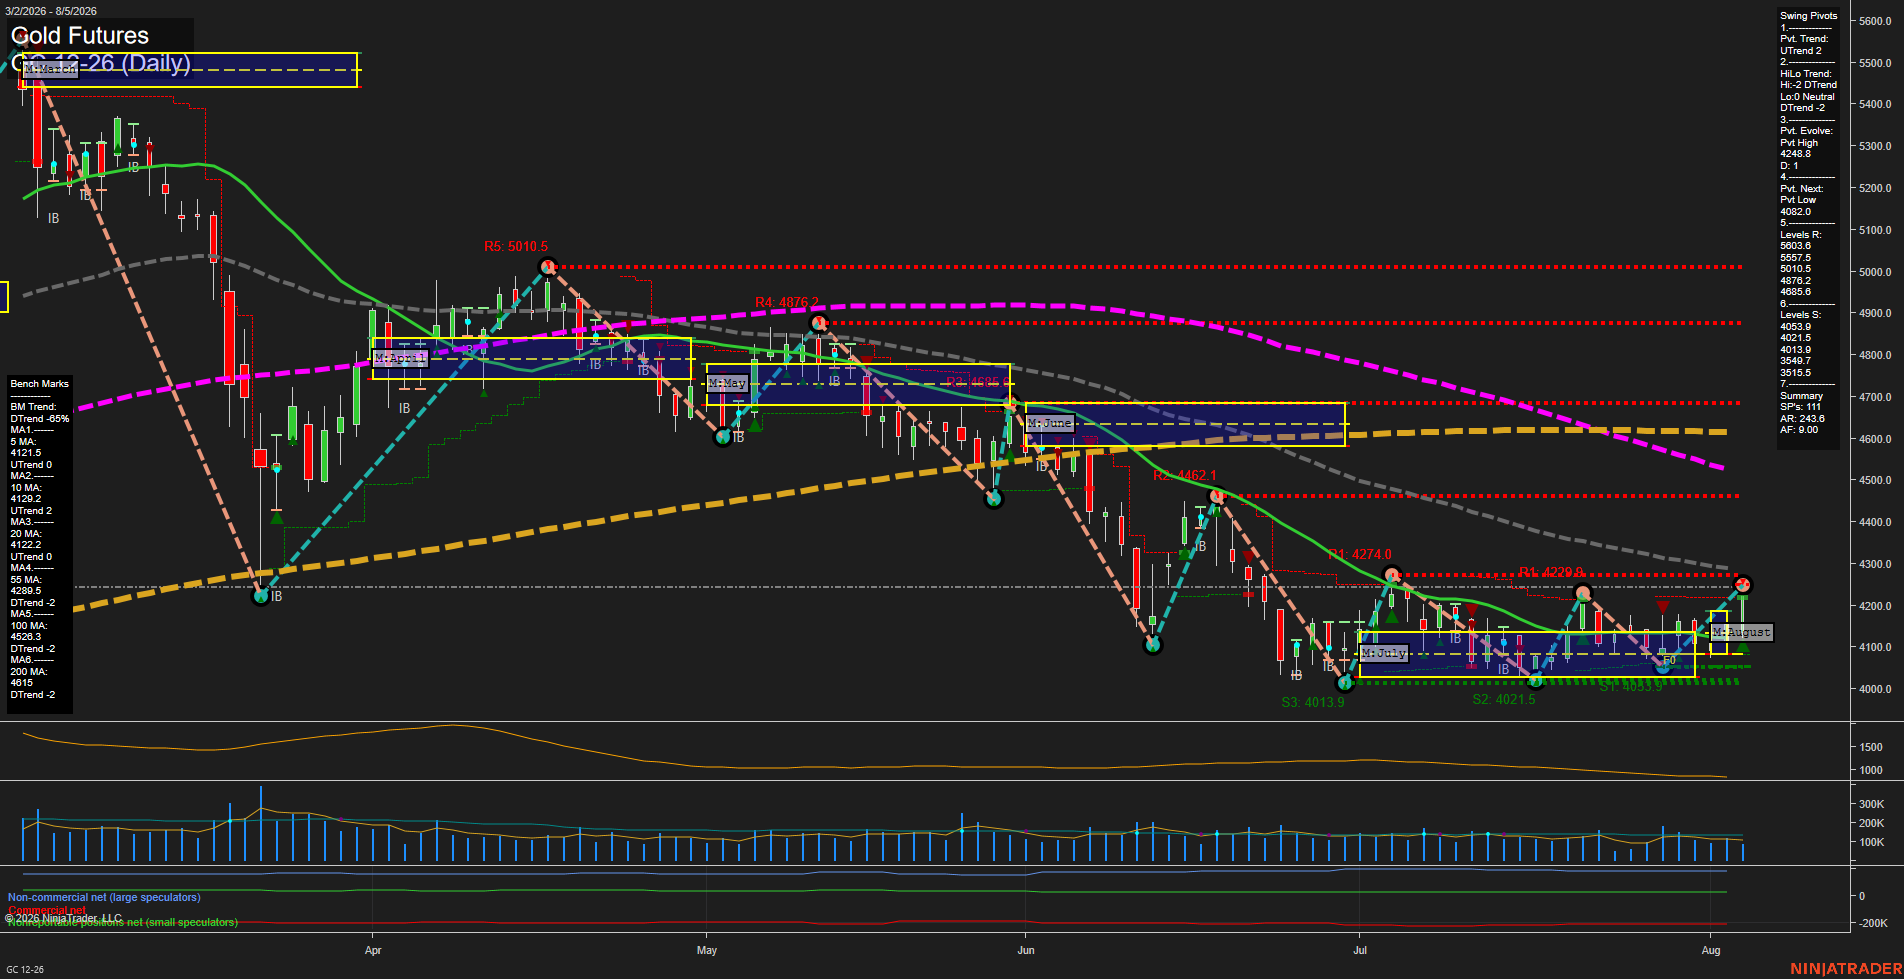
Overall Rating
- Short-Term: Bullish
- Intermediate-Term: Neutral
- Long-Term: Bearish.
Key Insights Summary
Gold has produced a sharp, large-range upside recovery from the 4013.9-4053.9 support cluster, restoring the short-term pivot structure to UTrend and lifting price above the weekly and monthly F0%/NTZ areas. The 5-, 10-, and 20-day benchmarks have turned upward, while the developing pivot high at 4248.8 and declining 55-day average near 4289.5 define the immediate overhead test zone. The intermediate structure remains mixed because the HiLo trend is still DTrend, and the longer-term backdrop remains bearish beneath the 100- and 200-day averages. Elevated ATR reflects a volatile rebound phase rather than a settled trend continuation.
View charts on: AlphaWebTrader HTF Charts