U.S. stocks closed higher as softer producer inflation, lower oil prices and technology strength lifted the S&P 500 to a record amid tariff risks.
Fundamentals: U.S. equities ended higher, with the S&P 500 rising 0.66% to a record 7,799.73 as flat July producer prices, lower oil prices and technology leadership supported risk appetite. Strong corporate profit margins added support, while gold and other metals retreated. Tariff policy, Strait of Hormuz shipping flows and Middle East tensions remained key market cross-currents.
Technicals: Major index futures retained broadly bullish intermediate- and long-term technical structures at the NYSE close, with ES, NQ, EMD, RTY and FDAX testing or consolidating beneath recent swing highs. TSLA, META and QQQ advanced among top ETF movers, while AMZN, GLD and USO declined. YM showed a more mixed short-term setup despite its broader upward trend.
After Market Close daily snapshot: market news summary and sentiment, major ETFs, Magnificent 7 analysis, Indices Futures Higher Time Frame Analysis, and E-mini S&P500, Nasdaq 100, NYMEX Crude, Gold Futures Daily Chart analysis.
As of: August 13, 2026 05:00 CT
Market News Summary:
Cooling U.S. inflation, lower oil prices, and technology strength lifted equities to fresh records, while tariff, Middle East, and valuation cross-currents remained in focus.
Primary Drivers & Risks:
- Primary Driver: Softer wholesale inflation
- Primary Risk: Tariff and Middle East uncertainty
Tone:
Constructive for equities, with selective risk signals.
Stock Market / ETFs / Indices:
U.S. stocks finished higher, with the S&P 500 gaining 0.66% to 7,799.73 and closing at a record. Technology leadership and S&P 500 profit margins running at 16.9%, the highest in FactSet data since 2009, supported the advance. Reddit rose 11% after its scheduled S&P 500 inclusion, while commentary also flagged September’s weak seasonal record and some fund-specific underperformance.
Geopolitical:
The Strait of Hormuz standoff remained an energy-market focus. Reported tanker flows through the passage varied widely, while reduced perceptions of near-term Middle East military escalation coincided with lower oil prices.
Oil / Energy:
WTI and Brent pulled back as traders focused on economic pressure toward Iran negotiations and lower escalation concerns. Oil prices had not sharply surged despite the Hormuz disruption, while technical commentary identified recovery potential alongside resistance levels. Longer-term EV production themes carry implications for oil, power, and metals demand.
Gold / Metals:
Gold, silver, and platinum faced profit-taking pressure despite cooler inflation data and declining Treasury yields. Gold held above $4,350 after breaking above its recent range, but a rejection near $4,450 highlighted nearby technical resistance; lower inflation also reduced demand for metals as immediate inflation hedges.
Fed / Financials:
July producer prices were flat after a 0.1% June decline, versus consensus for a 0.2% increase, reinforcing the prior cooler CPI reading and easing rate-hike concerns. Market commentary cited steadier-rate expectations for next month, while July FOMC minutes and manufacturing PMI data are upcoming. The average 30-year fixed mortgage rate declined to 6.67% from 6.69%.
Macro / Other:
More than 40 S&P 500 companies reported $9.6 billion in tariff refunds, with roughly $2.1 billion received in cash. Separately, a U.S. trade court upheld the administration’s removal of the de minimis tariff exemption for certain imports below $800.
Conclusion:
Moderating wholesale inflation, lower oil prices, and technology strength drove the record S&P 500 close. High corporate profit margins reinforced equity-market support.
Tariff policy developments, Hormuz shipping uncertainty, and Middle East tensions remained important cross-currents. Metals retreated as reduced inflation pressure lowered hedging demand, despite softer yields.
Market News Sentiment
Market News Articles: 52
- Positive: 40.38%
- Neutral: 40.38%
- Negative: 19.23%
Sentiment Summary: Market news sentiment is balanced, with 40% positive, 40% neutral, and 19% negative coverage across 52 articles.
Conclusion: Indices futures day traders are facing mixed-to-neutral news flow, with positive and neutral articles equally represented and negative coverage limited.
GLD,Gold Articles: 12
- Positive: 58.33%
- Negative: 33.33%
- Neutral: 8.33%
Sentiment Summary: Gold-related coverage was moderately positive, with 58% positive, 33% negative, and 8% neutral articles across 12 items.
Conclusion: The news tone around GLD and gold was positive overall, while a meaningful share of negative coverage indicated mixed sentiment.
USO,Oil Articles: 11
- Negative: 45.45%
- Neutral: 36.36%
- Positive: 18.18%
Sentiment Summary: USO/Oil coverage is predominantly negative (45%), with 36% neutral and 18% positive across 11 articles.
Conclusion: Oil-related news tone is negative overall, which may be relevant to energy-sector influence on index futures.
Market Data Snapshot
ETF Snapshot of major stock market ETFs, Mag7, and others as of: August 13, 2026 05:00
Top Movers & Losers
- TSLA 339.96 Bullish 3.80% ▲
- META 594.97 Bullish 2.78% ▲
- QQQ 732.07 Bullish 1.16% ▲
- AMZN 265.13 Bearish -0.80% ▼
- GLD 398.96 Bearish -1.47% ▼
- USO 125.03 Bearish -1.78% ▼
Major Index ETFs: SPY, QQQ, DIA, IWM, IJH
- QQQ 732.07 Bullish 1.16% ▲
- SPY 777.88 Bullish 0.70% ▲
- IJH 78.42 Bullish 0.46% ▲
- IWM 303.50 Bullish 0.26% ▲
- DIA 537.91 Bullish 0.14% ▲
Major index ETFs were Bullish across the group: QQQ led with +1.16%, followed by SPY at +0.70%. IJH gained +0.46% and IWM added +0.26%, while DIA was the least positive mover at +0.14%.
Mag 7 Stocks: AAPL, MSFT, GOOG, AMZN, META, NVDA, TSLA
- TSLA 339.96 Bullish 3.80% ▲
- META 594.97 Bullish 2.78% ▲
- AAPL 305.26 Bullish 1.00% ▲
- MSFT 496.88 Bullish 0.90% ▲
- NVDA 225.30 Bullish 0.54% ▲
- GOOG 343.94 Bullish 0.46% ▲
- AMZN 265.13 Bearish -0.80% ▼
Mag7 action was Mixed, led by TSLA as the most bullish mover at +3.80%, followed by META at +2.78%. AAPL +1.00%, MSFT +0.90%, NVDA +0.54%, and GOOG +0.46% were Bullish, while AMZN was the most bearish mover at -0.80%.
Cross-Market ETFs: TLT, GLD, USO, IBIT
- TLT 82.59 Bullish 0.58% ▲
- IBIT 35.88 Bearish -0.03% ▼
- GLD 398.96 Bearish -1.47% ▼
- USO 125.03 Bearish -1.78% ▼
Other ETFs were Mixed: TLT was the most bullish mover at +0.58%, while USO was the most bearish mover at -1.78%. GLD was Bearish at -1.47%, and IBIT was marginally Bearish at -0.03%.
ETF, Mag7, and Cross-Market ETF Insights
Overall Tone
Mixed: equity ETFs and most Mag7 names were Bullish, while commodities and IBIT were Bearish.
Equity ETFs and Mag7:
Major Index ETFs were broadly Bullish, led by QQQ at +1.16%, followed by AAPL at +1.00%, MSFT at +0.90%, SPY at +0.70%, NVDA at +0.54%, IJH and GOOG at +0.46%, IWM at +0.26%, and marginal DIA at +0.14%. Mag7 leadership was selective, with TSLA the most bullish mover at +3.80% and META advancing +2.78%, while AMZN was the most bearish equity mover at -0.80%.
Cross-Market ETFs:
Cross-market ETFs were Mixed, with TLT Bullish at +0.58% while IBIT was near-flat and Bearish at -0.03%. GLD was Bearish at -1.47%, and USO was the most bearish cross-market mover at -1.78%; TLT was the most bullish mover in this group.
Futures Indices – Higher Time Frame Analysis
Summary of the current state of US Indices Futures based on higher time-frame (HTF) technical analysis as of: 2026-08-13: 17:00 CT.
US Indices Futures
- ES: YSFG/MSFG/WSFG upward, above rising benchmarks; 7850.25 resistance, 7628.75 pivot support; weekly short signal contrasts with higher-high/higher-low structure.
- NQ: YSFG/MSFG/WSFG upward, above six rising benchmarks; 30074 resistance, 30975.50-31090 supply; 27285.50 pivot-reversal reference amid volatile consolidation.
- YM: YSFG/MSFG upward and above benchmarks; WSFG below F0% with active shorts; 54884 resistance, 53534 pivot support, 52400 weekly reversal reference.
- EMD: YSFG/MSFG/WSFG upward, above rising benchmarks; 3927/3921 resistance, 3904.7 support, 3814.0 pivot threshold; higher-high/higher-low structure remains intact.
- RTY: YSFG/MSFG/WSFG upward, above all benchmarks; 3062.1-3068.4 resistance, 2908.9 daily pivot low, 2857.2 weekly reversal threshold.
- FDAX: YSFG/MSFG/WSFG upward, above rising benchmarks; 26665-26685 resistance, 26065 pivot support, 25055 weekly retracement threshold.
Overall State
- Short-Term: Bullish
- Intermediate-Term: Bullish
- Long-Term: Bullish
Conclusion
US index futures retain broadly aligned higher-timeframe upward structure. ES, NQ, EMD, RTY, and FDAX hold above rising benchmark sets with YSFG, MSFG, and WSFG readings above primary F0% references. YM remains aligned upward on monthly and yearly structure, while its weekly grid is below F0% and short-term signals remain countertrend. Most contracts are testing or consolidating beneath pivot-high resistance: ES 7850.25, NQ 30074, EMD 3927, RTY 3068.4, and FDAX 26685. Benchmarks and opposite-pivot levels define underlying structural support across the group.
Note: Intra-day counter-trend pullbacks or retracements may occur, HTF is context for informational usage and market structure. Glossary: Session Fib Grids periods of YSFG:’Yearly’, MSFG:’Monthly’, WSFG:’Weekly’
For full details visit: AlphaWebTrader Technicals
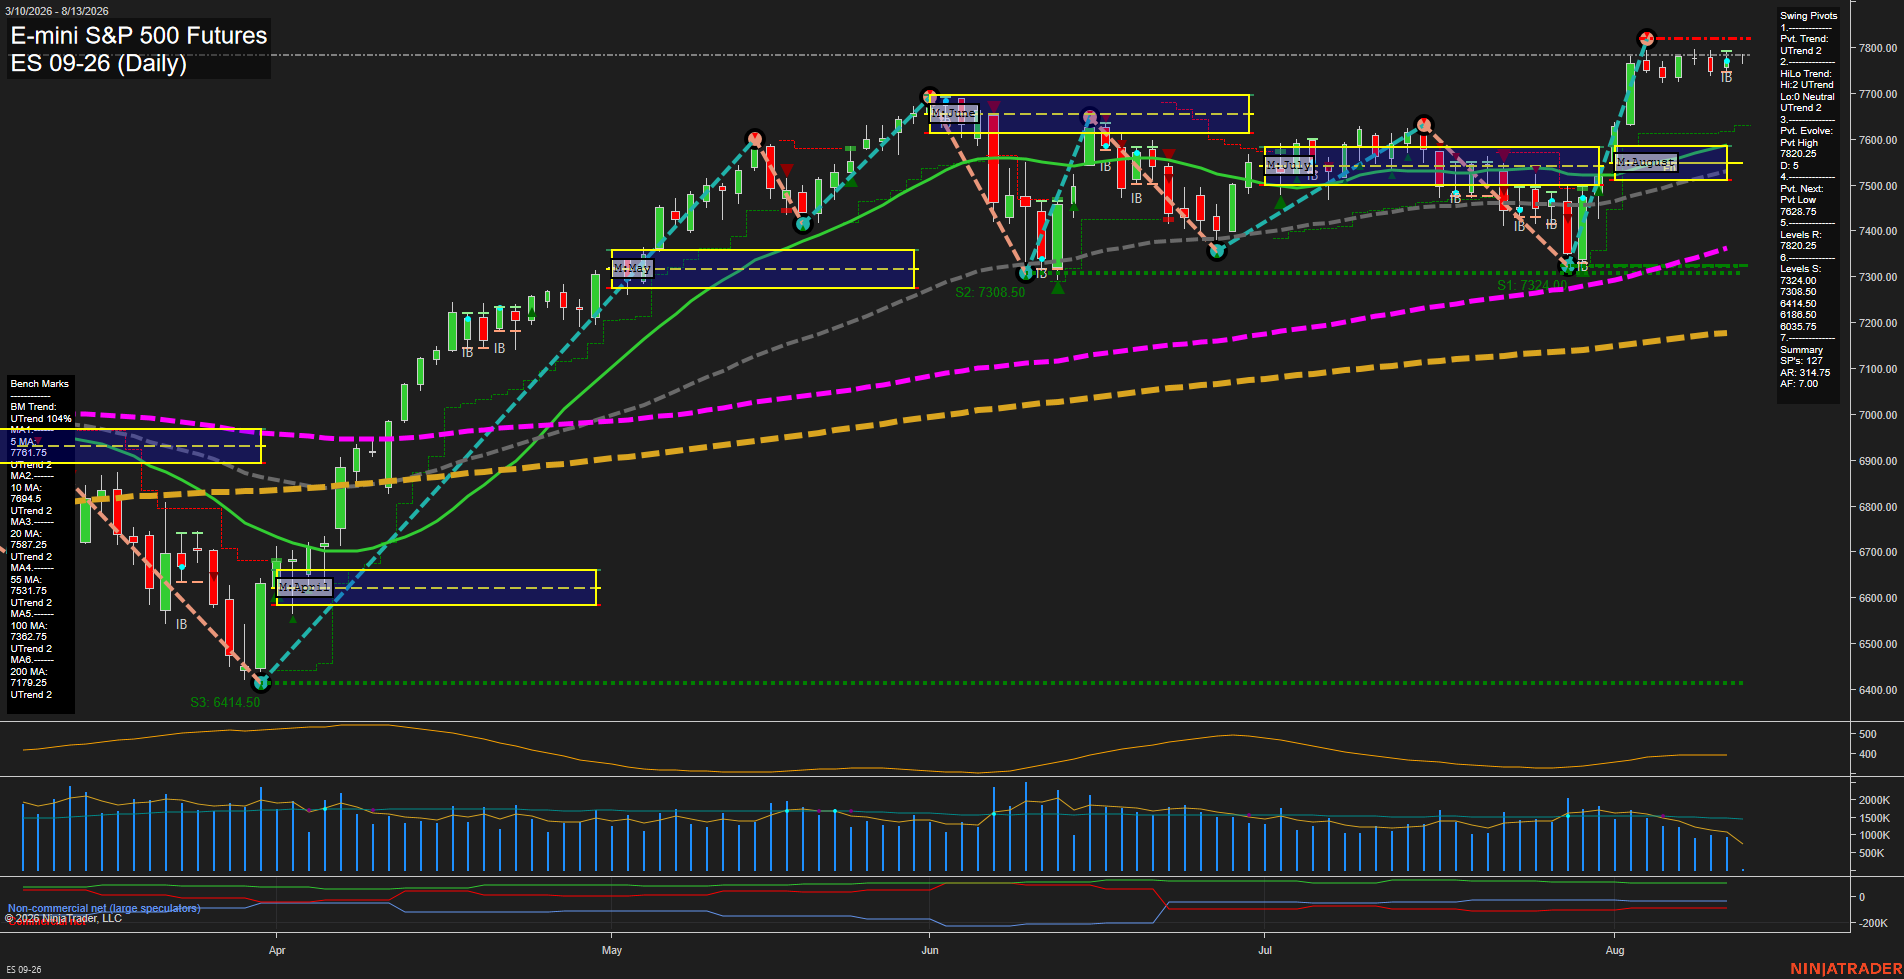
ES Daily View
Overall Rating
- Short-Term: Bullish
- Intermediate-Term: Bullish
- Long-Term: Bullish.
Key Insights Summary
Price remains in a broad daily uptrend, holding above every benchmark moving average while both short-term pivot and intermediate HiLo structures remain in UTrend. The August advance reached a new pivot high at 7838.25 and is now consolidating with small, slower-momentum bars just beneath the 7820.25 to 7838.25 resistance area. The weekly, monthly, and yearly fib-grid readings remain above their F0%/NTZ references, preserving positive multi-timeframe structure. The nearest defined pivot reversal level is 7628.75, while the rising 5-day and 10-day averages at 7761.75 and 7694.50 frame the immediate short-term trend condition.
View charts on: AlphaWebTrader HTF Charts
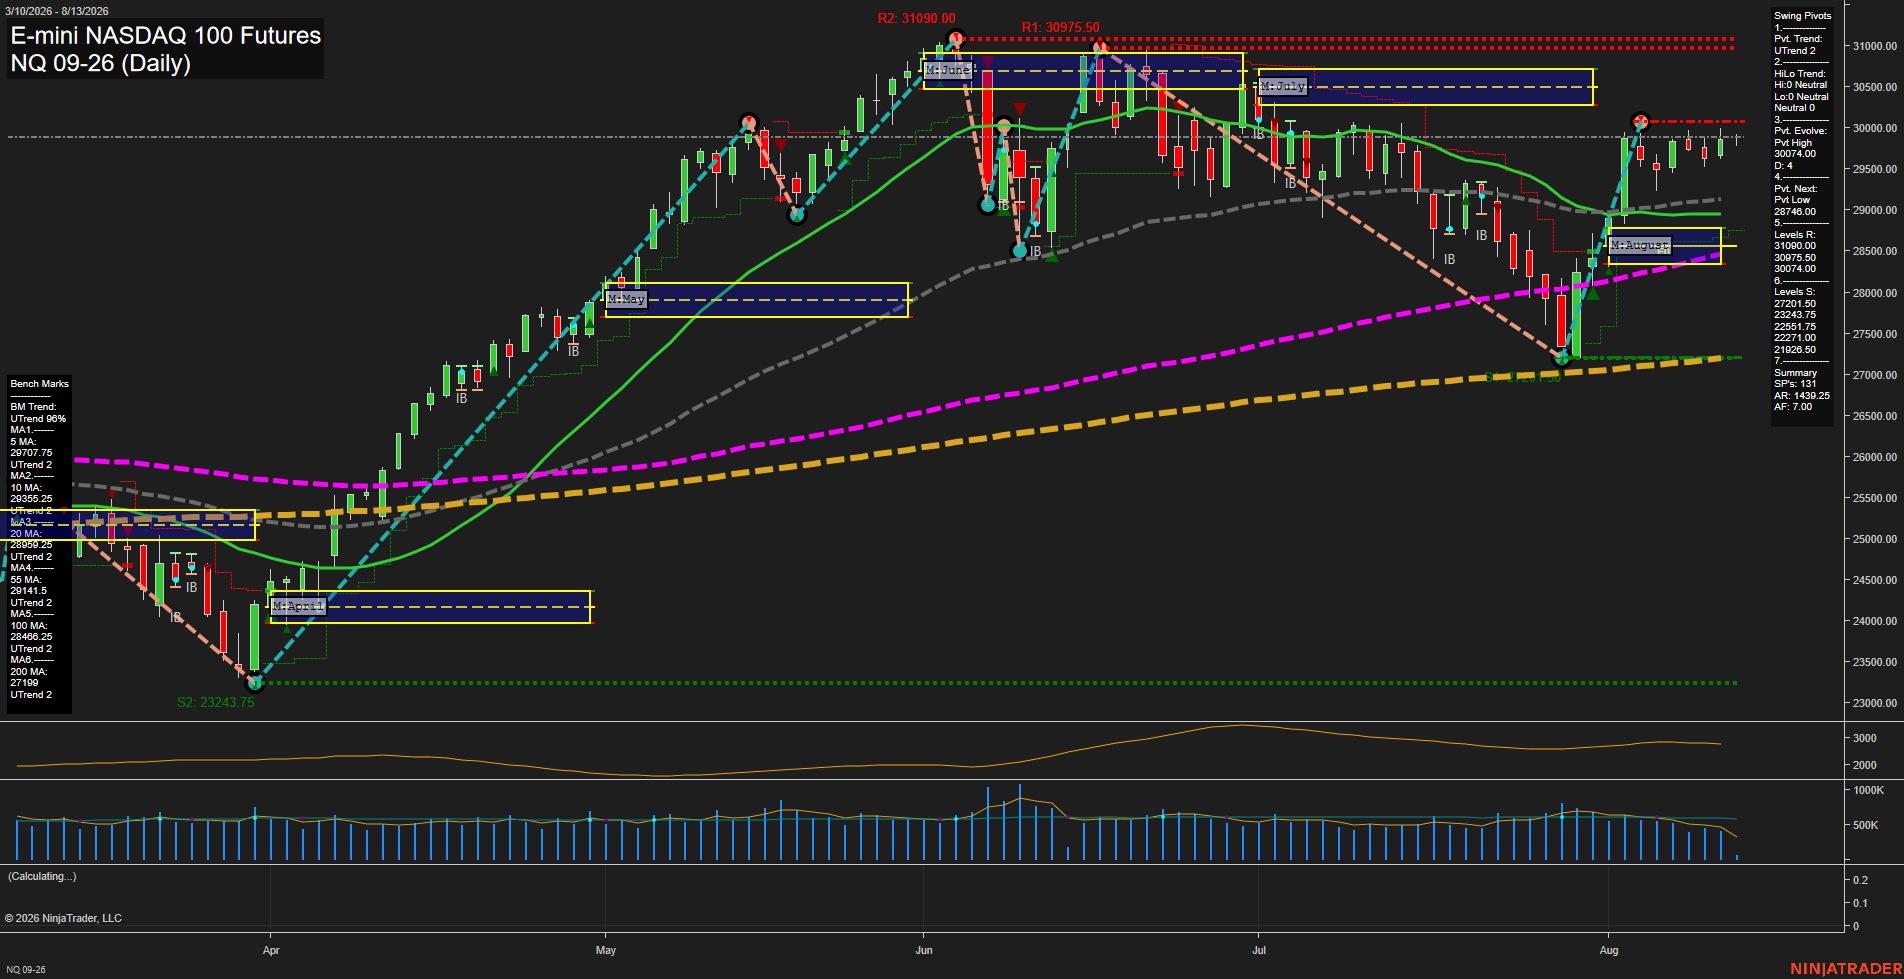
NQ Daily View
Overall Rating
- Short-Term: Bullish
- Intermediate-Term: Bullish
- Long-Term: Bullish.
Key Insights Summary
Price has staged a sharp V-shaped recovery from the late-July low near 27200 and is consolidating just beneath the 30074 pivot-high trigger. Small recent candles and slowing momentum reflect compression after the rebound, while price remains above the rising 5-, 10-, 20-, 55-, 100-, and 200-day benchmarks. The short-term pivot structure is upward, with 30074 serving as the immediate swing resistance and 30975.50-31090 the higher resistance band. The August monthly grid remains constructive above its F0% area, while the broad 2026 structure retains higher-low characteristics despite the July correction.
View charts on: AlphaWebTrader HTF Charts
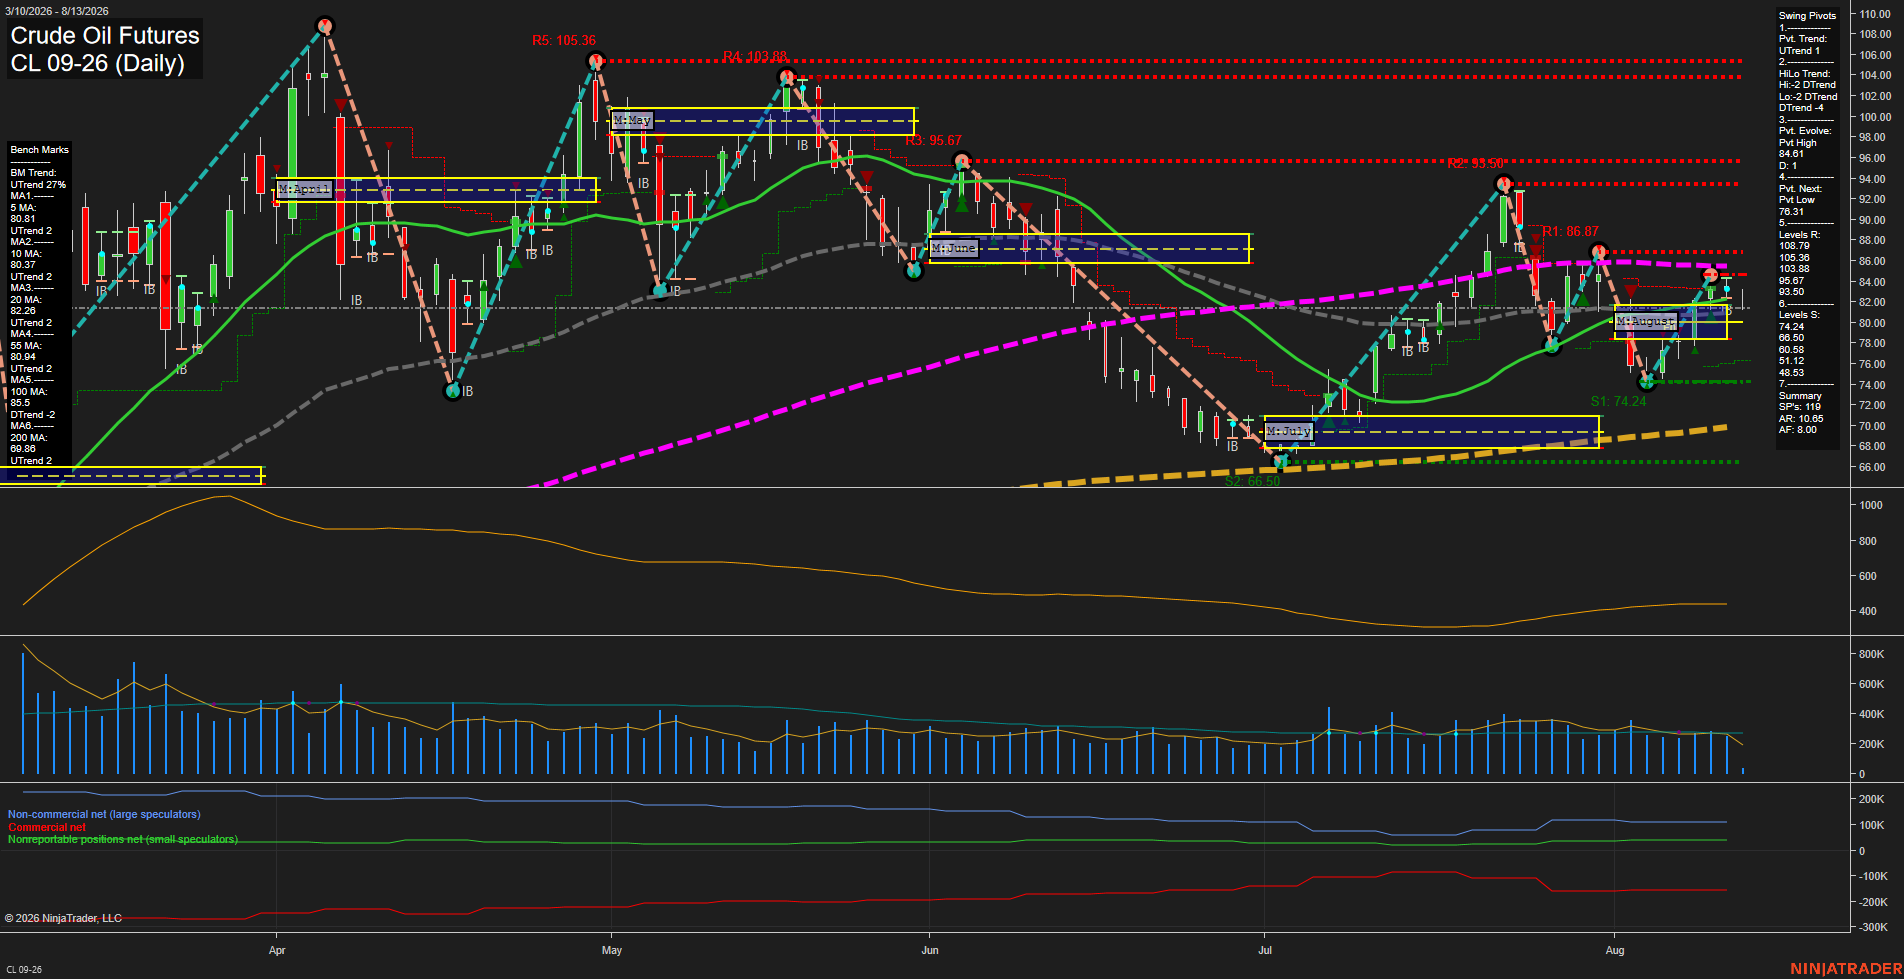
CL Daily View
Overall Rating
- Short-Term: Bullish
- Intermediate-Term: Bullish
- Long-Term: Bullish.
Key Insights Summary
Price is consolidating above the rising 5, 10, 20, and 55-day benchmarks after a sharp rebound from the late-July 74.24 swing low. The short-term pivot structure remains in an UTrend, although the active pivot-high evolution at 84.61 and the intermediate HiLo DTrend show that the rally is still operating beneath the larger 85.50 to 86.87 resistance area. Price is above the weekly and monthly F0% levels, supporting constructive near-term and intermediate-term tone, while the yearly grid and rising 200-day average preserve the broader bullish backdrop. Recent daily bars are small and volume is moderating, consistent with consolidation following the recovery rather than a high-momentum breakout.
View charts on: AlphaWebTrader HTF Charts
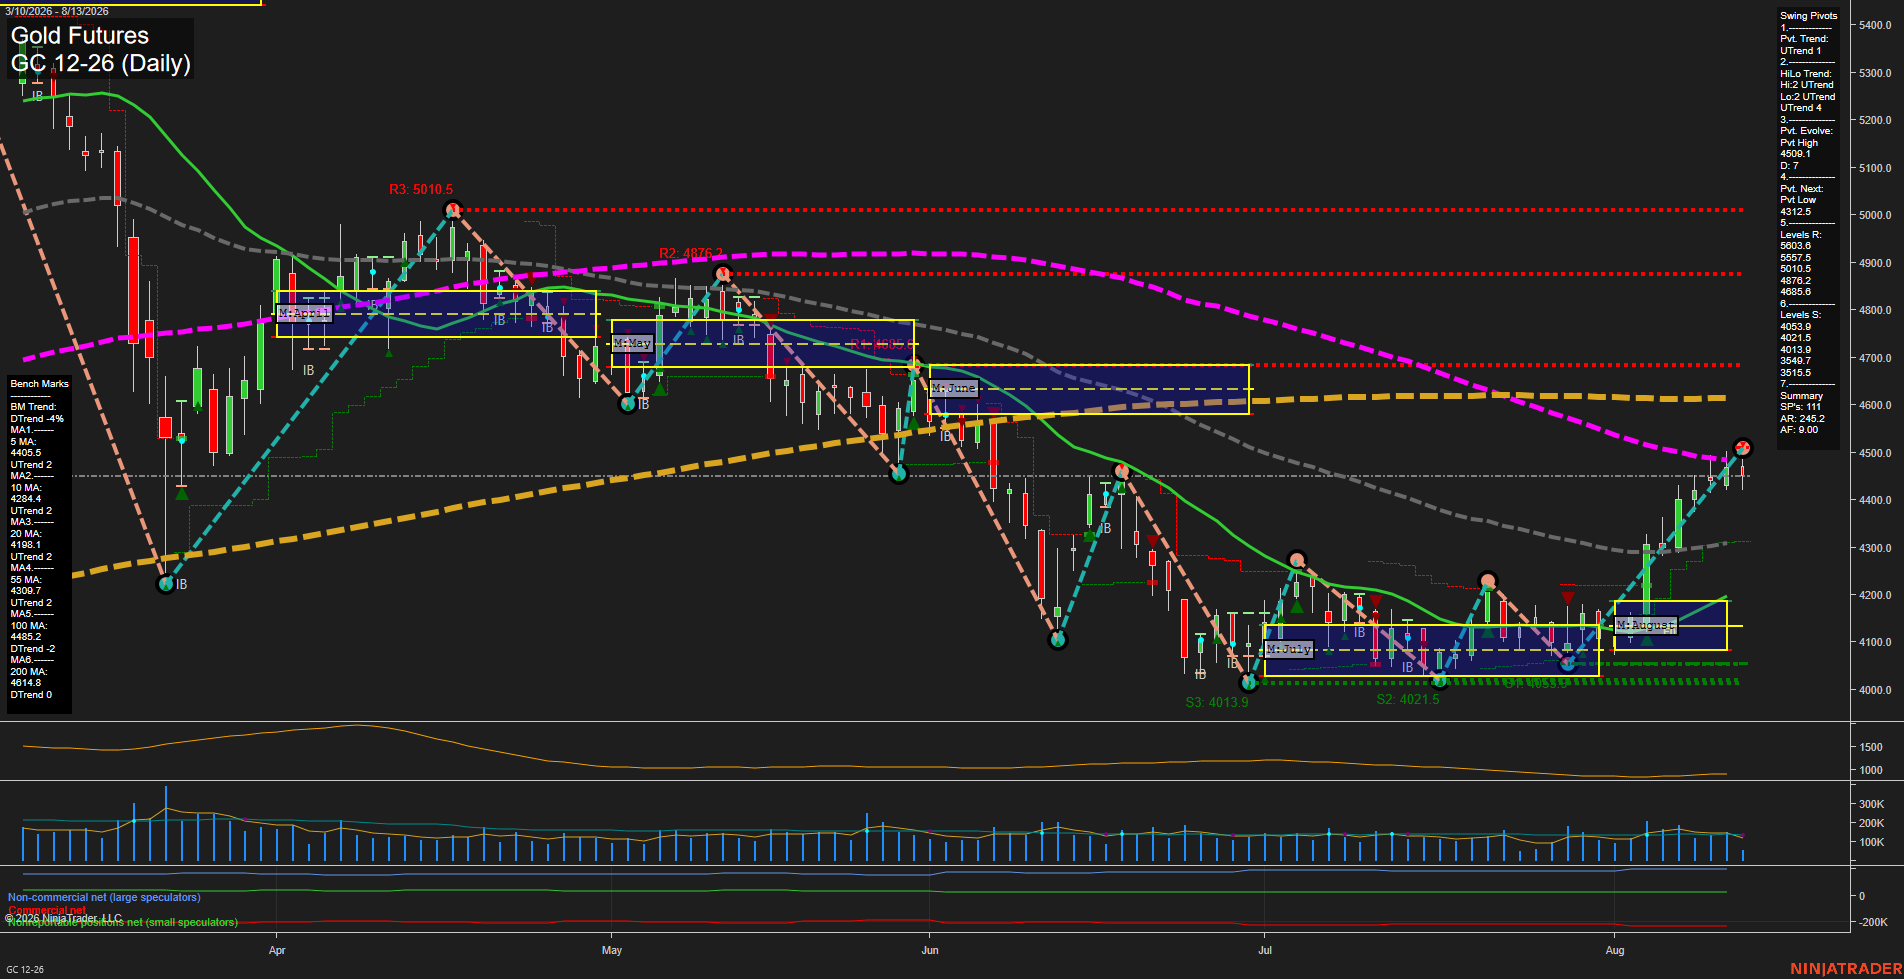
GC Daily View
Overall Rating
- Short-Term: Bullish
- Intermediate-Term: Bullish
- Long-Term: Bearish.
Key Insights Summary
Gold has produced a fast V-style recovery from the early-August 4,000 area, creating higher swing lows and restoring both short-term and intermediate pivot trends to UTrend. Price is above the weekly and monthly Fib-grid centers and has reclaimed the rising 5, 10, 20, and 55-day benchmark structure. The rally is testing the 100-day benchmark near 4485 and the newly established 4509.1 pivot high, while 4685.6 remains the next major overhead pivot resistance. The long-term structure remains mixed-to-bearish because price is below the declining 200-day benchmark and the yearly Fib-grid bias remains below its center.
View charts on: AlphaWebTrader HTF Charts