
Stocks hit record highs on AI-led buying as Iran-linked oil disruption lifted crude, inflation concerns, and market volatility into the close.
Fundamentals: U.S. stocks finished mixed after the S&P 500 and Nasdaq set fresh records on AI and semiconductor strength, while the Dow lagged and late-day breadth weakened. Geopolitical tension around Iran and the Strait of Hormuz kept crude prices elevated, adding to inflation concerns, higher yields, and a firmer tone in gold and energy.
Technicals: ETF leadership was mixed, with IWM, TSLA, and QQQ closing higher while AMZN, MSFT, and USO finished lower. Futures index reviews for ES, NQ, YM, RTY, FDAX, and EMD remained broadly bullish across daily and weekly time frames, with price action showing higher highs, higher lows, and moving averages in supportive alignment.
After Market Close daily snapshot: market news summary and sentiment, major ETFs, Magnificent 7 analysis, Indices Futures Higher Time Frame Analysis, and E-mini S&P500, Nasdaq 100, NYMEX Crude, Gold Futures Daily Chart analysis.
As of: May 26, 2026 05:00 CT
Market News Summary:
Stocks set fresh records on AI strength while Iran-related energy disruption keeps volatility elevated across crude, inflation, and sentiment.
Primary Drivers & Risks:
- Primary Driver: AI-led stock strength
- Primary Risk: Iran-linked oil disruption
Tone:
Risk-on in equities, risk-sensitive in energy.
Stock Market / ETFs / Indices:
The S&P 500 and Nasdaq reached record highs on strong AI and semiconductor buying, while the Dow finished weaker and intraday action turned mixed. Call options activity and bullish sector participation supported the equity advance, but the late-day pullback showed uneven breadth.
Geopolitical:
Iran-U.S. tensions and Strait of Hormuz disruption remained central to market behavior. Headlines cited ceasefire violations, retaliation threats, and stalled peace talks, keeping geopolitical risk in focus.
Oil / Energy:
Brent crude moved above $98 and energy markets reacted sharply to fading peace hopes, strike headlines, and supply fears. Several notes pointed to persistent disruption in the Strait of Hormuz, higher oil prices, and continued pressure on energy-related assets.
Gold / Metals:
Gold and silver bullion demand remained strong, with the Royal Mint reporting record sales. Options activity in GLD and GDX leaned bullish, while gold price action stayed compressed beneath resistance.
Fed / Financials:
Inflation worries and rising Treasury yields stayed in the background, while some commentary tied lower inflation to easing energy prices. A separate note said recent economic data gives little support for an imminent rate cut.
Macro / Other:
Consumer confidence fell as gas prices and inflation concerns rose. Broader commentary pointed to strong AI investment momentum and heavy interest in new large-cap tech names and future IPOs.
Conclusion:
Primary drivers were AI-led equity strength and the energy shock tied to Iran and the Strait of Hormuz. Those forces kept major indices supported even as crude, inflation, and intraday reversals added cross-currents.
Secondary drivers included consumer confidence weakness, Treasury yield pressure, and gold-market demand. Mixed closing action in the Dow versus record highs in the S&P 500 and Nasdaq highlighted uneven participation beneath the headline strength.
Market News Sentiment
Market News Articles: 29
- Positive: 44.83%
- Neutral: 37.93%
- Negative: 17.24%
Sentiment Summary: Market news is moderately constructive for indices futures, with 45% positive articles, 38% neutral articles, and 17% negative articles across 29 reports.
Conclusion: The news mix is tilted positive, but neutral coverage remains substantial, indicating balanced sentiment rather than a one-sided tone.
GLD,Gold Articles: 8
- Positive: 50.00%
- Neutral: 37.50%
- Negative: 12.50%
Sentiment Summary: GLD and gold articles show a mixed-to-positive tone, with 50% positive, 38% neutral, and 13% negative coverage across 8 articles.
Conclusion: The news flow is more positive than negative, but neutral coverage remains substantial, indicating an overall balanced sentiment profile.
USO,Oil Articles: 14
- Positive: 35.71%
- Negative: 35.71%
- Neutral: 28.57%
Sentiment Summary: USO oil article coverage is evenly split, with 36% positive, 36% negative, and 29% neutral sentiment across 14 articles.
Conclusion: The overall tone is mixed and balanced, with no dominant sentiment direction in the news flow.
Market Data Snapshot
ETF Snapshot of major stock market ETFs, Mag7, and others as of: May 26, 2026 05:00
Top Movers & Losers
- IWM 290.51 Bullish 1.89% ▲
- TSLA 433.59 Bullish 1.78% ▲
- QQQ 730.28 Bullish 1.78% ▲
- AMZN 265.29 Bearish -0.39% ▼
- MSFT 416.03 Bearish -0.61% ▼
- USO 137.00 Bearish -2.78% ▼
Major Index ETFs: SPY, QQQ, DIA, IWM, IJH
- IWM 290.51 Bullish 1.89% ▲
- QQQ 730.28 Bullish 1.78% ▲
- IJH 74.65 Bullish 1.56% ▲
- SPY 750.59 Bullish 0.66% ▲
- DIA 505.25 Bearish -0.17% ▼
Mixed tone across major index ETFs: IWM led as the most bullish mover at +1.89%, followed by QQQ at +1.78% and IJH at +1.56%; SPY was also bullish at +0.66%, while DIA was the most bearish mover at -0.17%, essentially near-flat.
Mag 7 Stocks: AAPL, MSFT, GOOG, AMZN, META, NVDA, TSLA
- TSLA 433.59 Bullish 1.78% ▲
- GOOG 384.84 Bullish 1.44% ▲
- META 612.34 Bullish 0.34% ▲
- AAPL 308.33 Bearish -0.16% ▼
- NVDA 214.86 Bearish -0.22% ▼
- AMZN 265.29 Bearish -0.39% ▼
- MSFT 416.03 Bearish -0.61% ▼
Mag7 is Mixed, with TSLA the most bullish mover at +1.78% and GOOG also bullish at +1.44%, while META is modestly bullish at +0.34%. On the bearish side, MSFT is the most bearish mover at -0.61%, followed by AMZN at -0.39%; AAPL at -0.16% and NVDA at -0.22% are near-flat.
Cross-Market ETFs: TLT, GLD, USO, IBIT
- TLT 85.10 Bullish 0.50% ▲
- IBIT 42.99 Bullish 0.07% ▲
- GLD 414.00 Bullish 0.04% ▲
- USO 137.00 Bearish -2.78% ▼
Mixed tone across the group: TLT was the most bullish mover at +0.50%, while USO was the most bearish mover at -2.78%. IBIT stayed near-flat with a slight gain of +0.07%, and GLD was also near-flat at +0.04%.
ETF, Mag7, and Cross-Market ETF Insights
Overall Tone
The tape is Mixed to Bullish, with equity ETFs mostly positive while cross-market signals are split by a sharp bearish move in USO.
Equity ETFs and Mag7:
Major Index ETFs are broadly Bullish, led by IWM +1.89% and QQQ +1.78%, with IJH +1.56% also firm; SPY is steadier at +0.66%, while DIA is slightly Mixed at -0.17%. Mag7 is more selective and Mixed, with TSLA the most bullish mover at +1.78% and GOOG at +1.44%, offset by MSFT as the most bearish mover at -0.61%, alongside AMZN -0.39%, NVDA -0.22%, and AAPL -0.16%.
Cross-Market ETFs:
Cross-Market ETFs are Mixed and mostly muted versus equities, with TLT Bullish at +0.50% and GLD nearly flat at +0.04%, while IBIT is marginally higher at +0.07%. USO is the clear outlier and most bearish mover in the group at -2.78%, showing notable commodity weakness against the generally firmer equity complex.
Futures Indices – Higher Time Frame Analysis
Summary of the current state of US Indices Futures based on higher time-frame (HTF) technical analysis as of: 2026-05-26: 17:00 CT.
US Indices Futures
- ES Bullish across YSFG, MSFG, WSFG, above F0% centers, rising 20/55/100/200MA stack, UTrend pivots, support prior breakout shelf, resistance fresh highs.
- NQ Bullish across YSFG, MSFG, WSFG, above F0% centers, rising benchmark stack, UTrend pivots, support breakout holds, resistance at fresh highs near 29995.
- YM Bullish across YSFG, MSFG, WSFG, above equilibrium zones, rising benchmark stack, UTrend pivots, support April low base, resistance at new highs near 51209.
- EMD Bullish HTF, above YSFG, MSFG, WSFG, benchmarks aligned higher, daily short-term neutral, UTrend pivots evolving, support spring low area, resistance 3737-3767.
- RTY Bullish across YSFG, MSFG, WSFG, above F0/NTZ, full bullish MA stack, UTrend pivots, support breakout zones, resistance near 2900-2922.7.
- FDAX Bullish across YSFG, MSFG, WSFG, above F0% midlines, rising benchmark stack, UTrend pivots, support 24816 and 25494, resistance 25656 and 25854.
Overall State
- Short-Term: Bullish
- Intermediate-Term: Bullish
- Long-Term: Bullish
Conclusion
US Indices Futures remain broadly aligned in bullish HTF structure. ES, NQ, YM, RTY, and FDAX show price above YSFG, MSFG, and WSFG references, with benchmark averages stacked higher and pivot maps in UTrend. RTY and NQ show the strongest expansion behavior, while EMD is the main near-term laggard with daily short-term neutrality under resistance. Across the complex, higher highs, higher lows, and accepted value above fib grid midpoints continue to define the dominant trend structure.
Note: Intra-day counter-trend pullbacks or retracements may occur, HTF is context for informational usage and market structure. Glossary: Session Fib Grids periods of YSFG:’Yearly’, MSFG:’Monthly’, WSFG:’Weekly’
For full details visit: AlphaWebTrader Technicals
ES Daily View
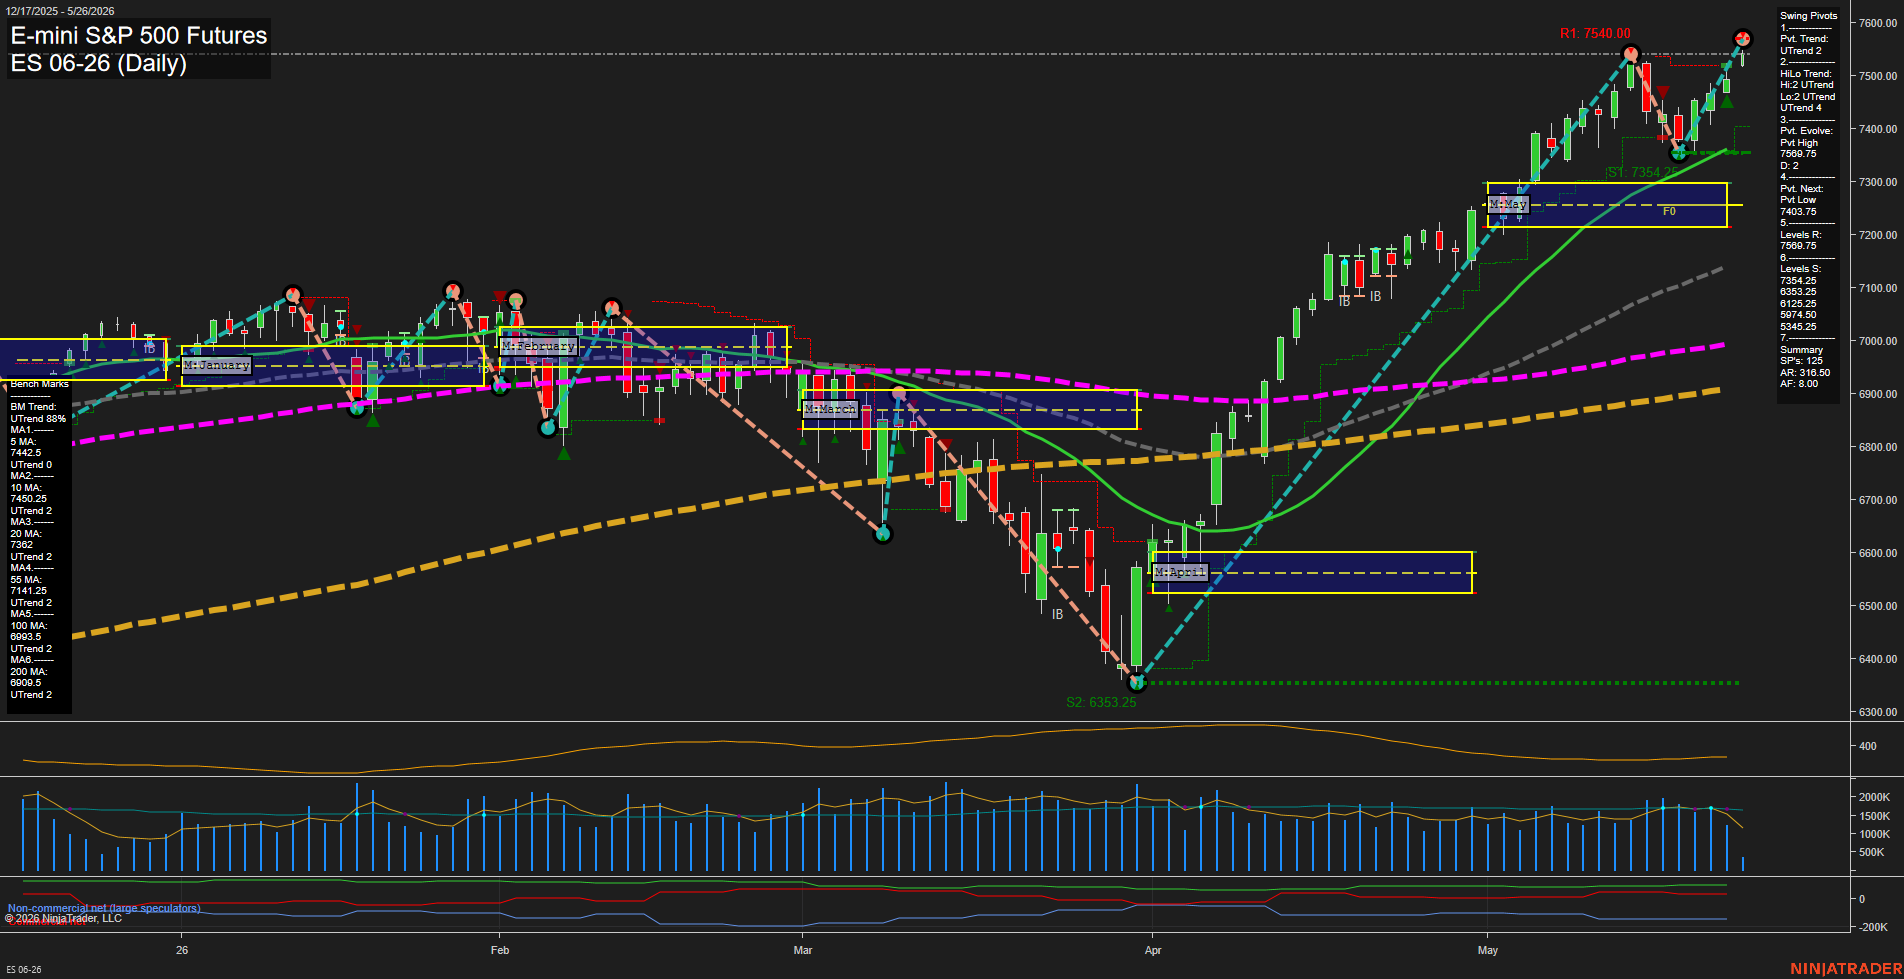
Overall Rating
- Short-Term: Bullish
- Intermediate-Term: Bullish
- Long-Term: Bullish.
Key Insights Summary
The daily structure remains strongly constructive after the April base and May breakout, with price pressing new highs above all major benchmark averages and holding well above the weekly, monthly, and yearly fib grid midpoints. Swing pivots remain in UTrend, and the sequence of higher highs and higher lows confirms persistent upside continuation rather than a mean-reversion phase. Momentum is strong, bar expansion is large, and the recent push through the prior resistance shelf near the upper NTZ reflects a clean trend continuation with little sign of distribution. Longer-term context is also favorable, as the 55, 100, and 200-day benchmarks all slope higher beneath price, reinforcing a broad bullish trend regime.
View charts on: AlphaWebTrader HTF Charts
NQ Daily View
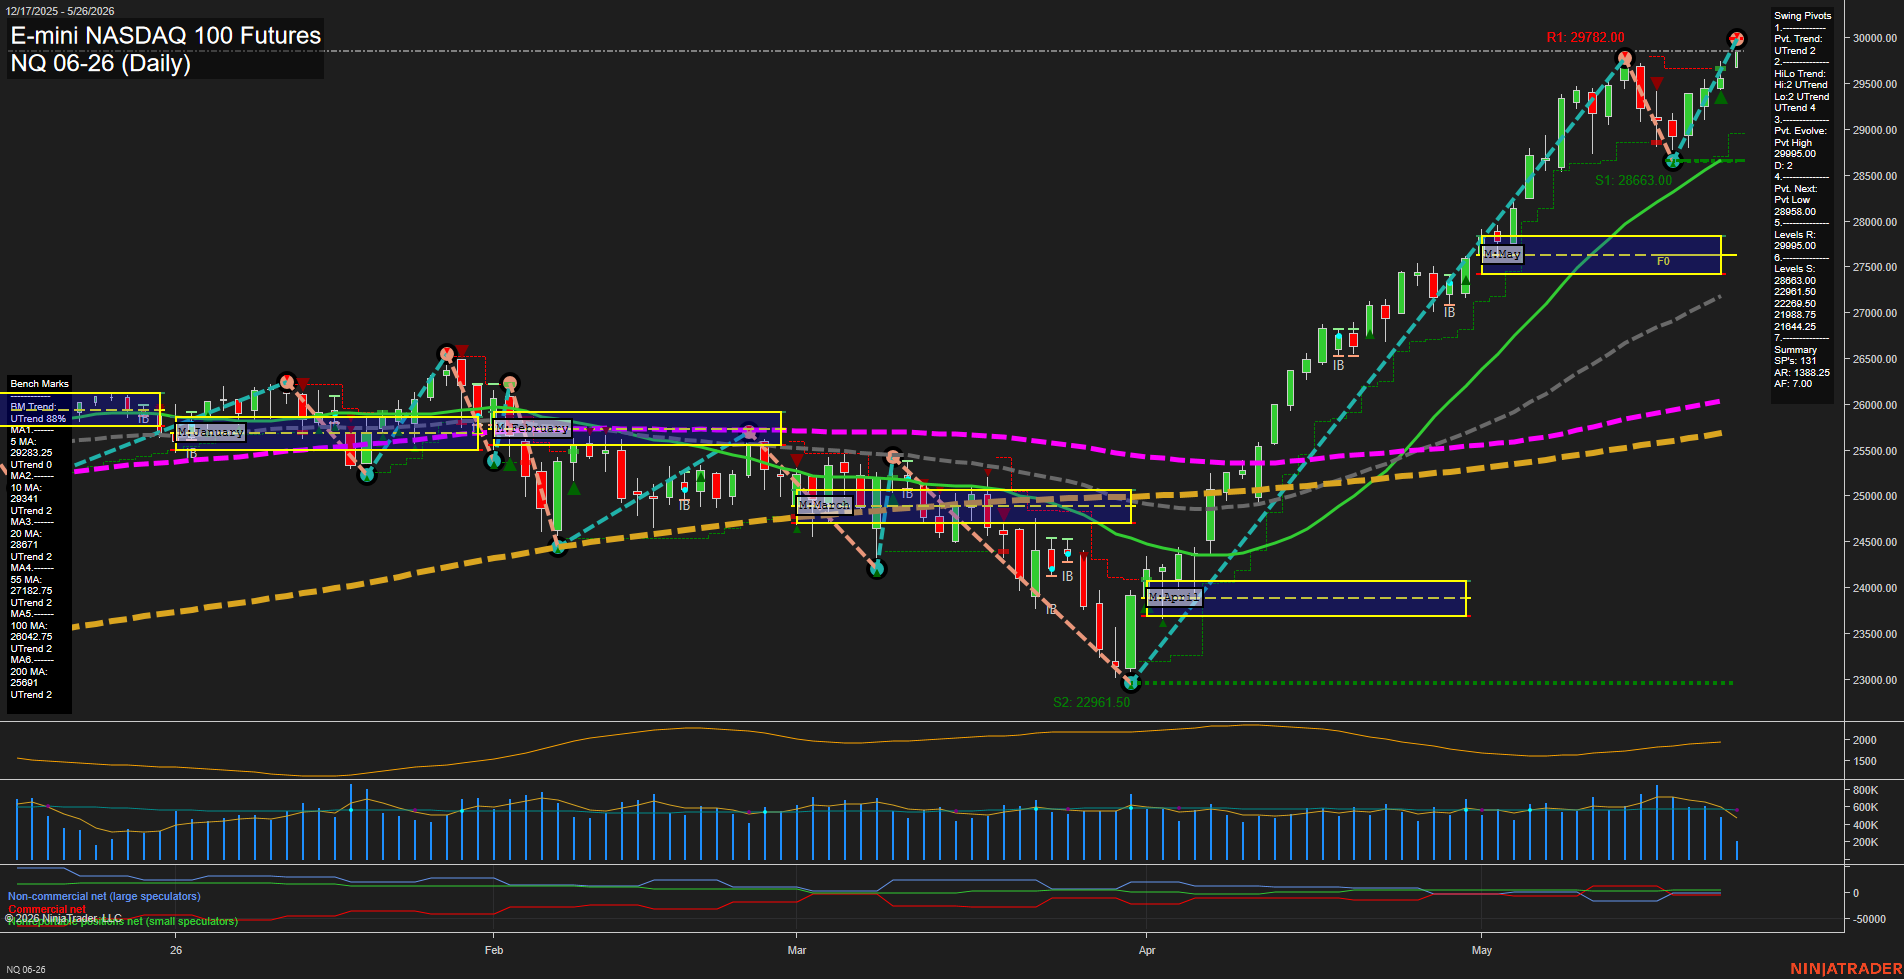
Overall Rating
- Short-Term: Bullish
- Intermediate-Term: Bullish
- Long-Term: Bullish.
Key Insights Summary
The daily structure remains in a strong upward swing with price pressing into fresh highs near 29995 after a powerful May advance. Swing pivot trend and HiLo trend are both aligned in UTrend, and price remains above the weekly, monthly, and yearly session fib grids, confirming broad upside control. All benchmark moving averages are rising or firmly supported below price, with the 20-day, 55-day, 100-day, and 200-day trends all pointing higher, reinforcing a mature but still intact uptrend. Recent candles show continued expansion near the highs, reflecting fast momentum and strong trend persistence after the April base and May breakout. The pattern is consistent with trend continuation, higher highs, and higher lows, with prior inside-bar pauses resolved back to the upside.
View charts on: AlphaWebTrader HTF Charts
CL Daily View
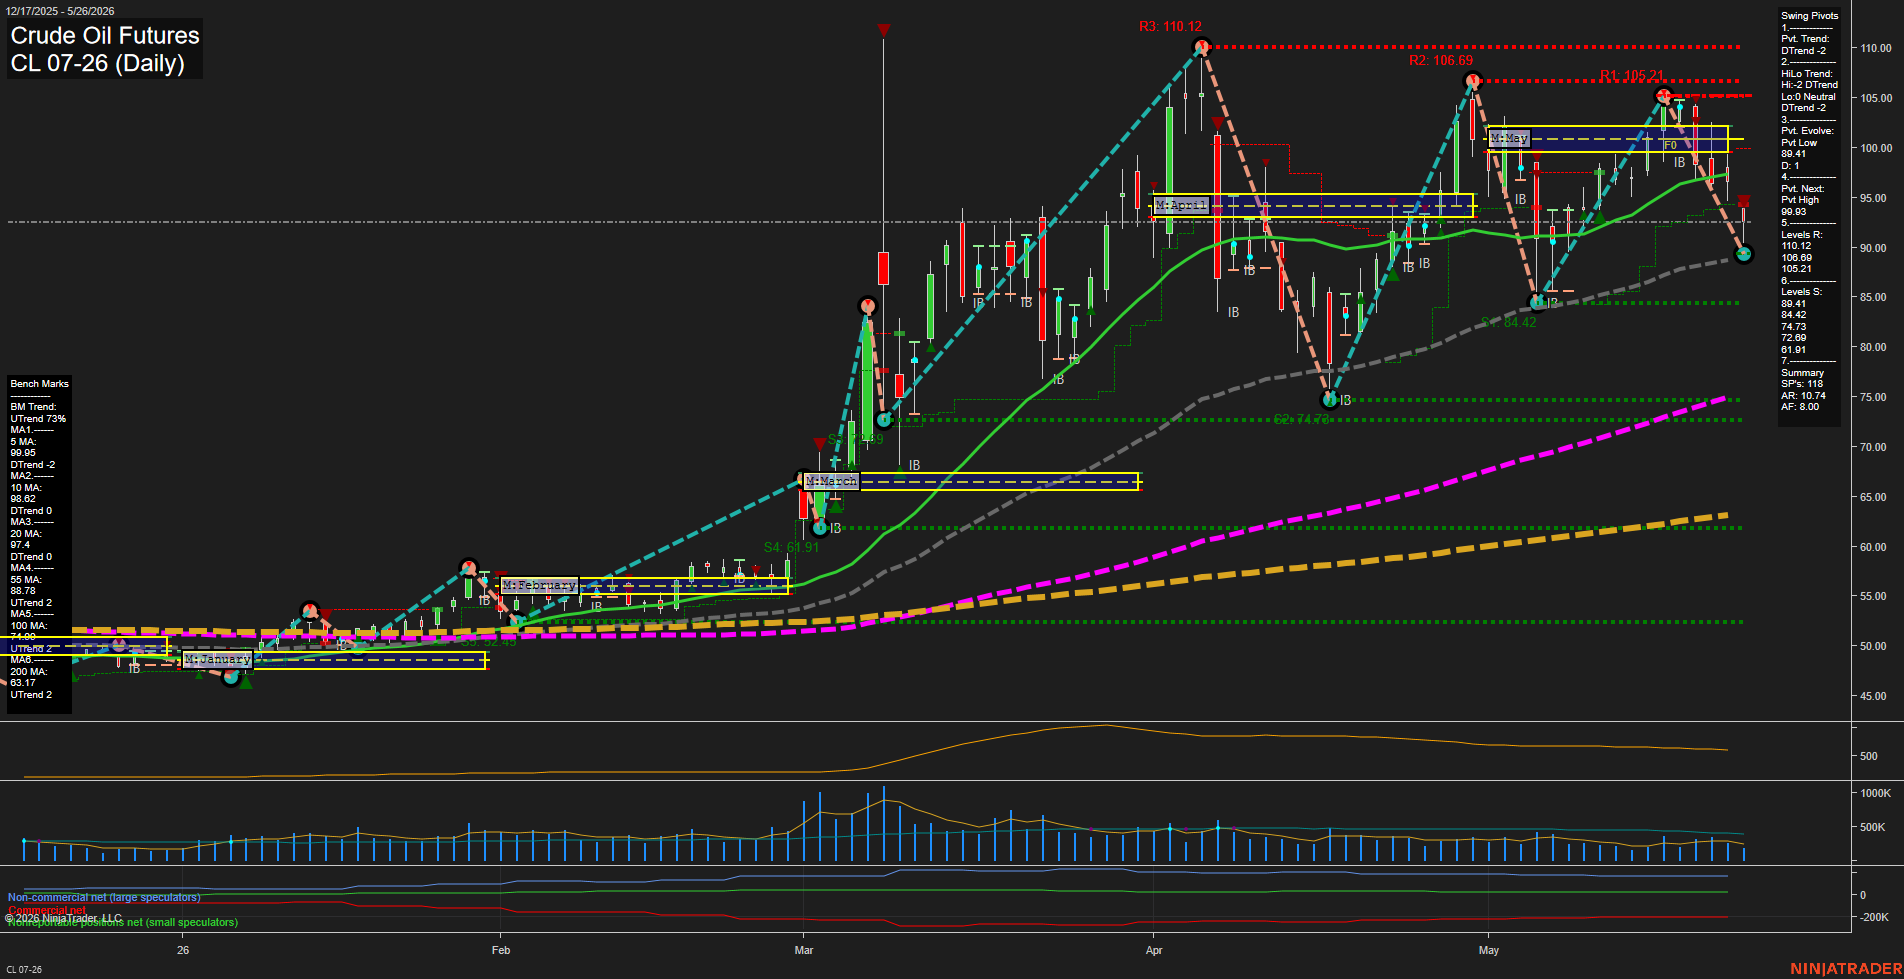
Overall Rating
- Short-Term: Bearish
- Intermediate-Term: Bearish
- Long-Term: Bullish.
Key Insights Summary
Crude oil is pressing into a short-term bearish phase after a sharp selloff from the early-May rejection zone near 105-110, with the latest price sitting at the active pivot low area around 89.41. The daily structure shows a clear sequence of lower highs and lower lows in the near term, while the WSFG and MSFG both remain below their F0%/NTZ centers and are aligned downside. The swing pivot matrix also confirms DTrend across both short-term and intermediate-term measures, with the next upside pivot still well overhead near 99.93. Benchmarks are mixed: the 5/10/20-day averages are rolling over, but the 55/100/200-day averages remain in broader uptrend alignment, keeping the long-term backdrop constructive despite the recent weakness. The chart reflects a large-range, high-volatility swing environment with repeated tests and rejections across the 99-105 supply band and a current focus on whether the 89-84 support zone holds or gives way into a deeper retracement.
View charts on: AlphaWebTrader HTF Charts
GC Daily View
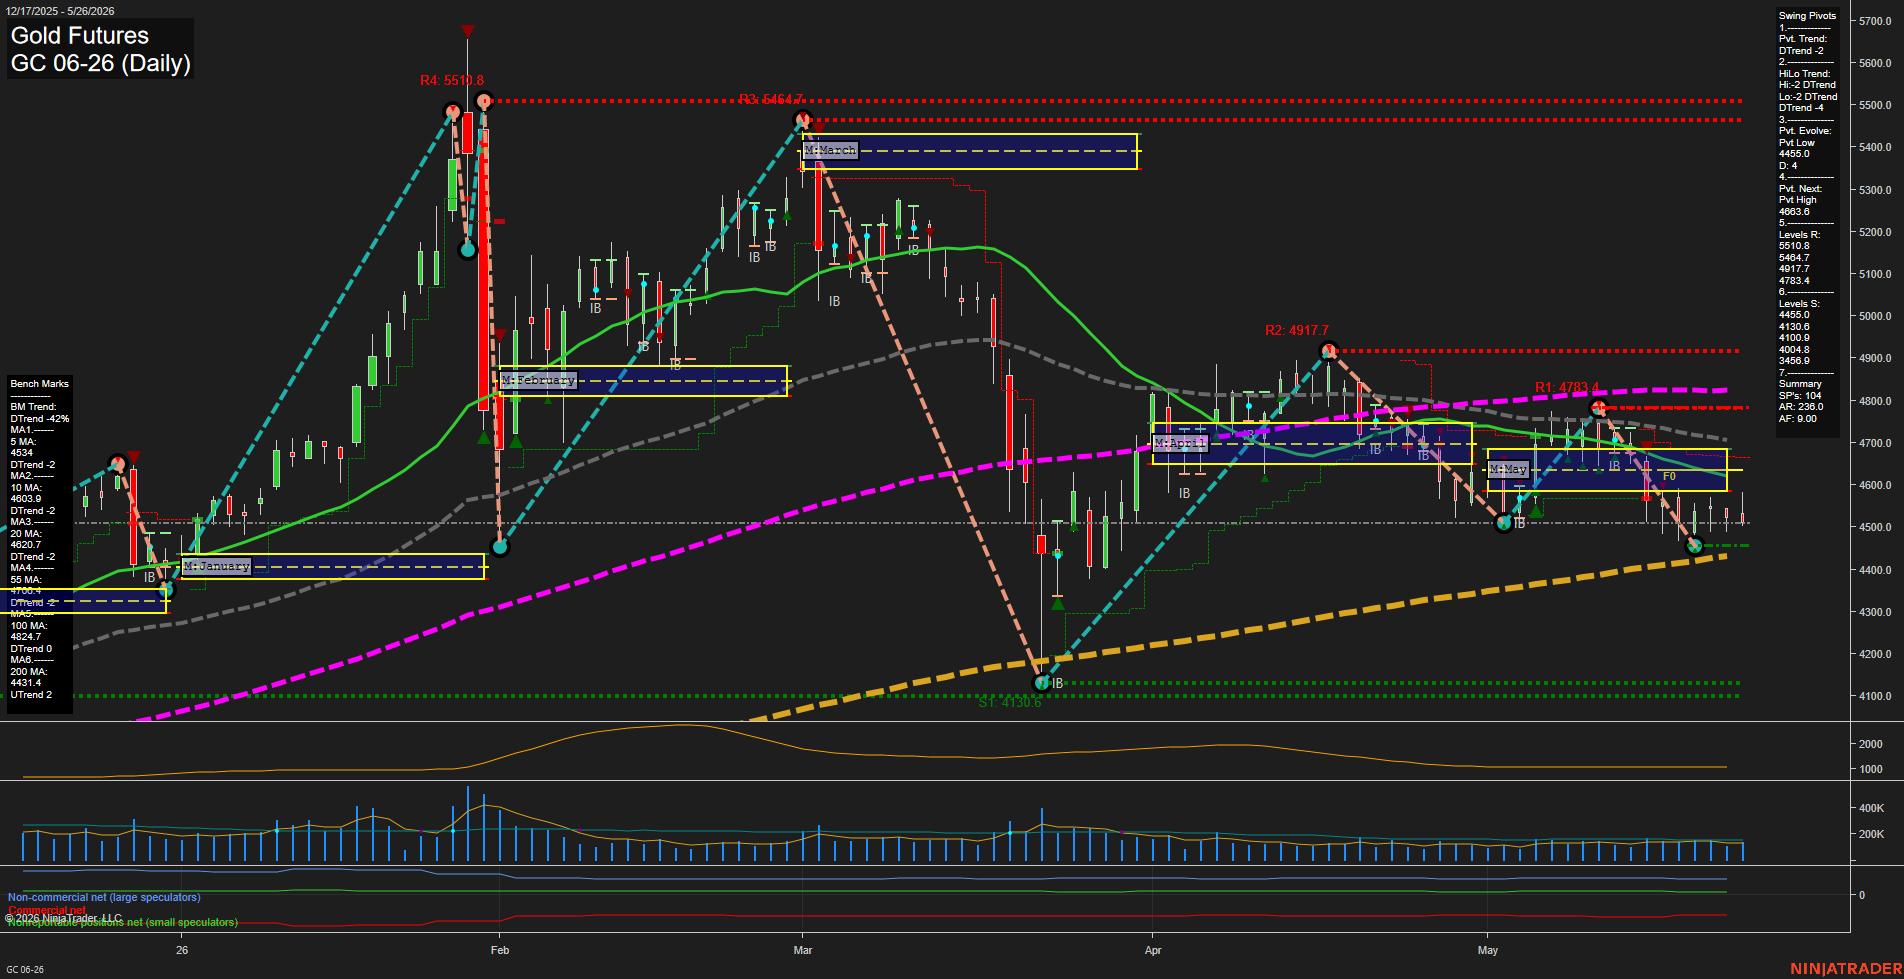
Overall Rating
- Short-Term: Bearish
- Intermediate-Term: Bearish
- Long-Term: Neutral.
Key Insights Summary
Gold futures are in a broad downtrend with price trading below the weekly, monthly, and yearly session Fib grid midpoint zones, and the pivot structure remains aligned to the downside with lower highs and lower lows. The recent rebound failed to sustain above the upper pivot resistance cluster, while the market is now rotating back toward the 4455 support area and the 200-day benchmark neighborhood. Momentum is subdued relative to the prior swing expansion, and the daily structure shows a corrective retracement inside a larger bearish sequence rather than a clean reversal. Volume has moderated versus prior spikes, matching a more compressed, rotational tape after the prior selloff and rebound phases.
View charts on: AlphaWebTrader HTF Charts