Sunday market radar reviews index futures, ETF movers and technical levels as oil disruption, AI earnings and Treasury bills shape sentiment this week.
Fundamentals: U.S. equities weakened as renewed hostilities involving Iran slowed shipping through the Strait of Hormuz and lifted oil prices. Softer CPI and PPI readings eased immediate rate concerns, while investors assess AI earnings, technology valuations, capital spending and concentration in major S&P 500 holdings. A $90 billion Treasury bill issuance adds liquidity considerations for risk assets.
Technicals: ETF action showed gains in USO, GLD and TLT, while NVDA, TSLA and META declined. Futures technicals reflect broad long-term bullish structures across major indices, alongside short-term pullbacks and mixed intermediate readings. The S&P 500 is consolidating below recent highs, while Nasdaq, Dow, Russell 2000 and DAX show weaker daily momentum near key support zones.
Market Week Ahead – Trading 360° view Market Radar for: holidays, earnings, eco-news, market-news summary, news sentiment, and major ETFs, MAG7, Higher Time Frame Analysis Indices Futures Summary, and ETF SPY S&P500, QQQ Tech, USO Oil, GLD Gold Weekly Chart analysis
As of: July 19, 2026 06:15 CT
Earnings Radar
Monitoring for earnings releases by the Magnificent 7, AI-tech-related firms, and major financial institutions.
- INTC Release: 2026-07-23 T:AMC
- GOOGL Release: 2026-07-22 T:AMC
- TSLA Release: 2026-07-22 T:AMC
Conclusion: Index futures face concentrated mega-cap tech earnings risk with GOOGL and TSLA reporting after the close on July 22, followed by INTC after the close on July 23. These releases place AI, major tech, and semiconductor results at the center of broad index sentiment; market momentum and volume can slow ahead of these reports.
For full details visit: Yahoo Earnings Calendar
EcoNews Radar U.S. Events
| Day | Time | Impact | Event |
|---|---|---|---|
| Wed | 10:30 | Low | Crude Oil Inventories |
| Thu | 08:30 | Medium | Unemployment Claims |
EcoNews Summary
No qualifying high-impact EcoNews events are listed. The scheduled crude oil inventories release is relevant to energy pricing, petroleum supply conditions, inflation-sensitive markets, and energy-sector futures. The medium-impact unemployment claims release is excluded because it is not directly related to oil, crude inventories, energy prices, or petroleum supply.
Event Notes:
- Wednesday 10:30 – USD Crude Oil Inventories: A weekly measure of U.S. commercial crude oil stockpiles. Traders monitor inventory changes for indications of petroleum supply-demand conditions and their effect on crude and energy prices.
Conclusion:
Wednesday’s 10:30 USD Crude Oil Inventories report is the week’s single most important listed event due to its direct connection to petroleum supply and energy-price conditions. High oil prices directly affect markets through inflation and geopolitical concerns. The 10 AM time cycle context remains relevant, with the 10:30 release serving as a potential catalyst for market reversals or continuations.
For full details visit: Forex Factory EcoNews
Market News Summary:
Middle East escalation, disrupted oil shipping, and a pivotal AI earnings week frame index-futures conditions.
Primary Drivers & Risks:
- Primary Driver: Iran conflict disrupts Hormuz oil flows
- Primary Risk: AI concentration and Treasury liquidity drain
Tone:
Cautious, with inflation relief offset by geopolitical and valuation pressures.
Stock Market / ETFs / Indices:
U.S. equities declined as renewed conflict lifted oil prices, while the S&P 500 remained below its yearly high after a stalled rally. Technology and semiconductor shares are consolidating ahead of earnings from Alphabet, IBM, Intel, and Tesla, with investors focused on AI spending, chip demand, and returns on capital investment. Commentary also highlighted elevated AI valuations and heavy concentration among the largest S&P 500 holdings.
Geopolitical:
Renewed Iran-war hostilities and consecutive U.S. strikes have intensified market attention on the Middle East conflict. Escalating fighting has slowed shipping through the Strait of Hormuz.
Oil / Energy:
Gulf crude and condensate exports reached their highest first-half July level since before the Iran war, but flows through Hormuz slowed as fighting escalated. Oil prices surged on supply concerns, and gasoline prices rose after weeks of easing energy pressure.
Gold / Metals:
Gold consolidated as traders assessed higher oil prices, inflation implications, and the Fed outlook. Separate commentary characterized gold’s decline as a signal related to the currencies in which it is priced.
Fed / Financials:
Softer-than-anticipated CPI and PPI data reduced near-term rate-hike concerns and pushed bond yields modestly lower. Rising oil prices remain a complicating factor for the inflation and policy backdrop.
Macro / Other:
Treasury bill issuance of $90 billion this week was identified as a liquidity drain for risk assets, with cited historical weakness and volatility around settlement days for the Nasdaq and semiconductor ETFs. Chinese suppliers’ dominance of the U.S. energy-storage market also raised strategic dependence concerns.
Conclusion:
Iran-related disruption to Hormuz shipping and the associated rise in oil prices are central market drivers. Softer U.S. inflation readings have eased immediate rate-hike pressure.
AI earnings, valuation concentration, and capital-spending scrutiny remain key equity cross-currents. Large Treasury bill issuance adds a separate liquidity and volatility concern.
Market News Sentiment
Market News Articles: 9
- Negative: 44.44%
- Neutral: 33.33%
- Positive: 22.22%
Sentiment Summary: Market news sentiment is mixed-to-negative, with 44% negative, 33% neutral, and 22% positive coverage across 9 articles.
Conclusion: Indices futures day traders are facing a news backdrop with more negative than positive headlines, while neutral coverage remains significant.
GLD,Gold Articles: 2
- Negative: 50.00%
- Positive: 50.00%
Sentiment Summary: GLD and gold coverage is evenly split, with 50% positive and 50% negative articles across 2 articles.
Conclusion: Gold-related news sentiment is neutral overall, providing no clear directional bias for indices futures day traders.
USO,Oil Articles: 1
- Negative: 100.00%
Sentiment Summary: USO and oil coverage was 100% negative across 1 article.
Conclusion: The available oil-related news tone was uniformly negative, based on limited coverage.
SPY Weekly View
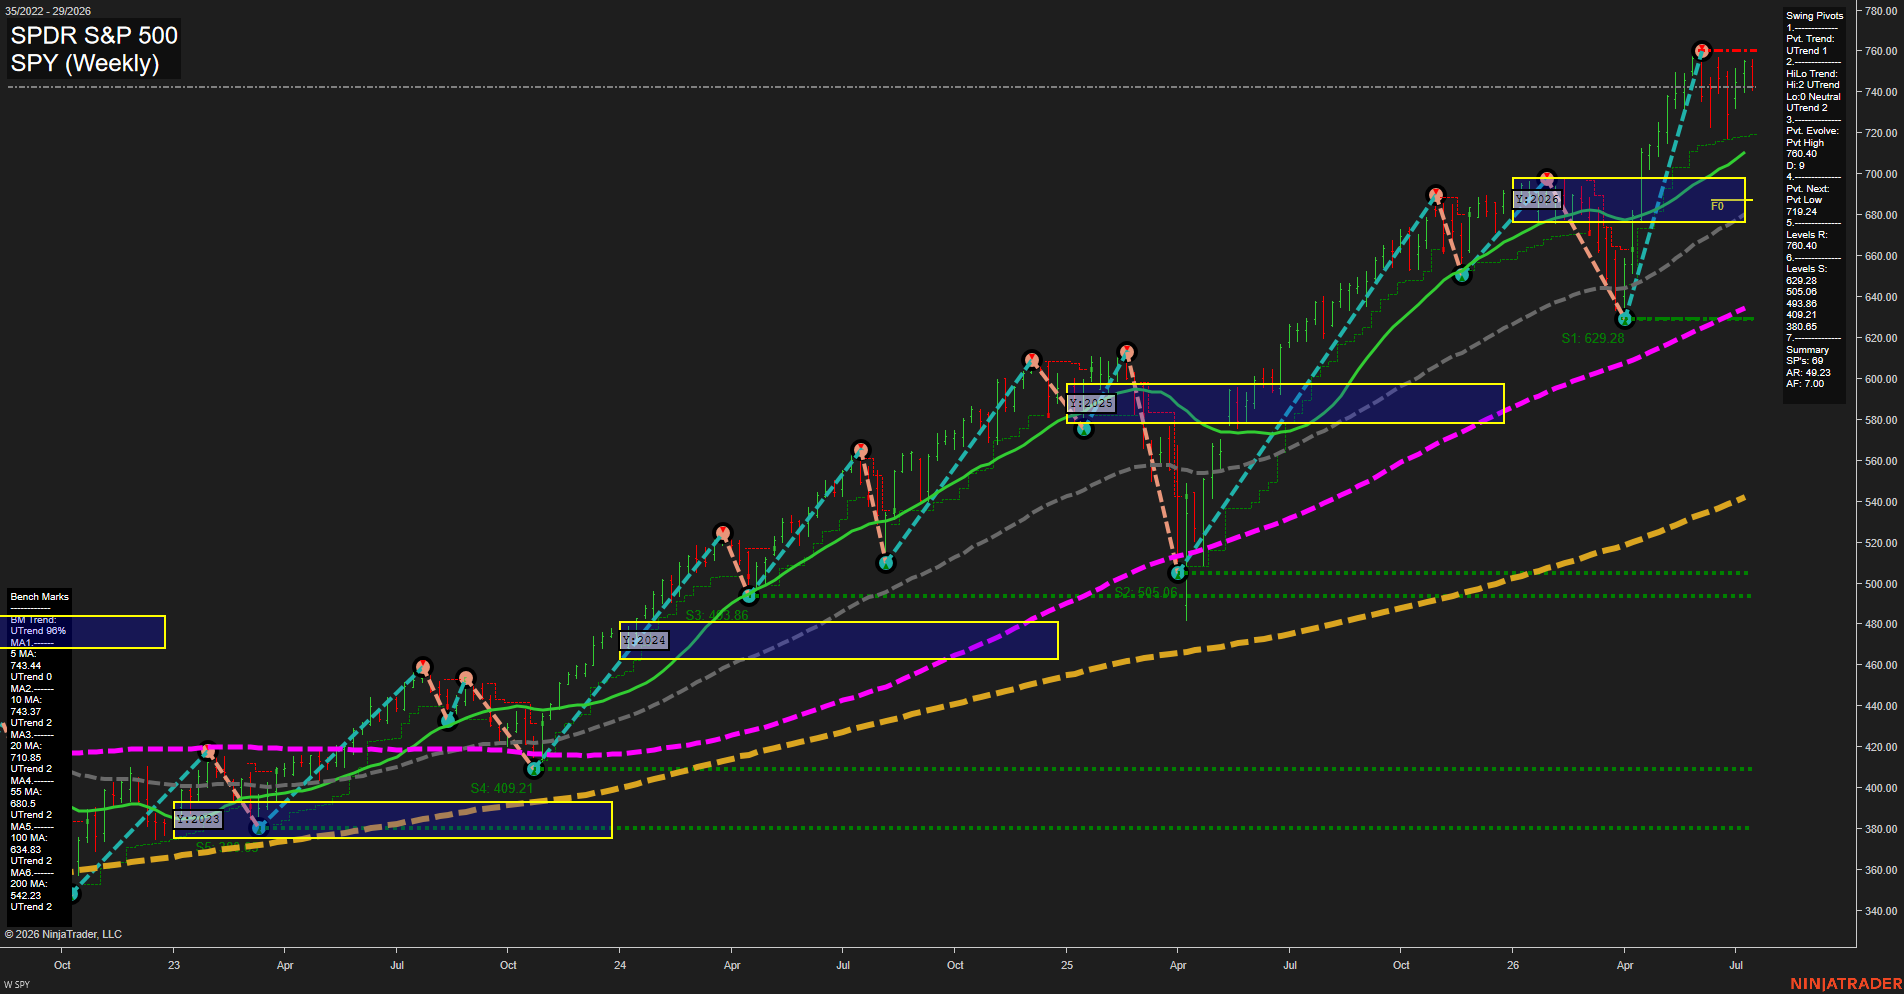
Overall Rating
- Short-Term: Bullish
- Intermediate-Term: Bullish
- Long-Term: Bullish.
Key Insights Summary
The weekly structure remains broadly bullish from a futures swing-trader perspective: price is above every benchmark average, the pivot and HiLo trends are both in UTrend, and the yearly grid has been decisively exceeded to the upside. Recent weekly bars are comparatively small beneath 760.40 pivot resistance, indicating consolidation after a steep advance rather than a confirmed breakdown. The 719.24 pivot-next level defines the nearest structural swing reference, while the 710.85 20-week benchmark is the more significant intermediate-term pullback reference. The prevailing condition is an extended higher-high, higher-low advance with momentum moderating near the upper range.
View charts on: AlphaWebTrader HTF Charts
QQQ Weekly View
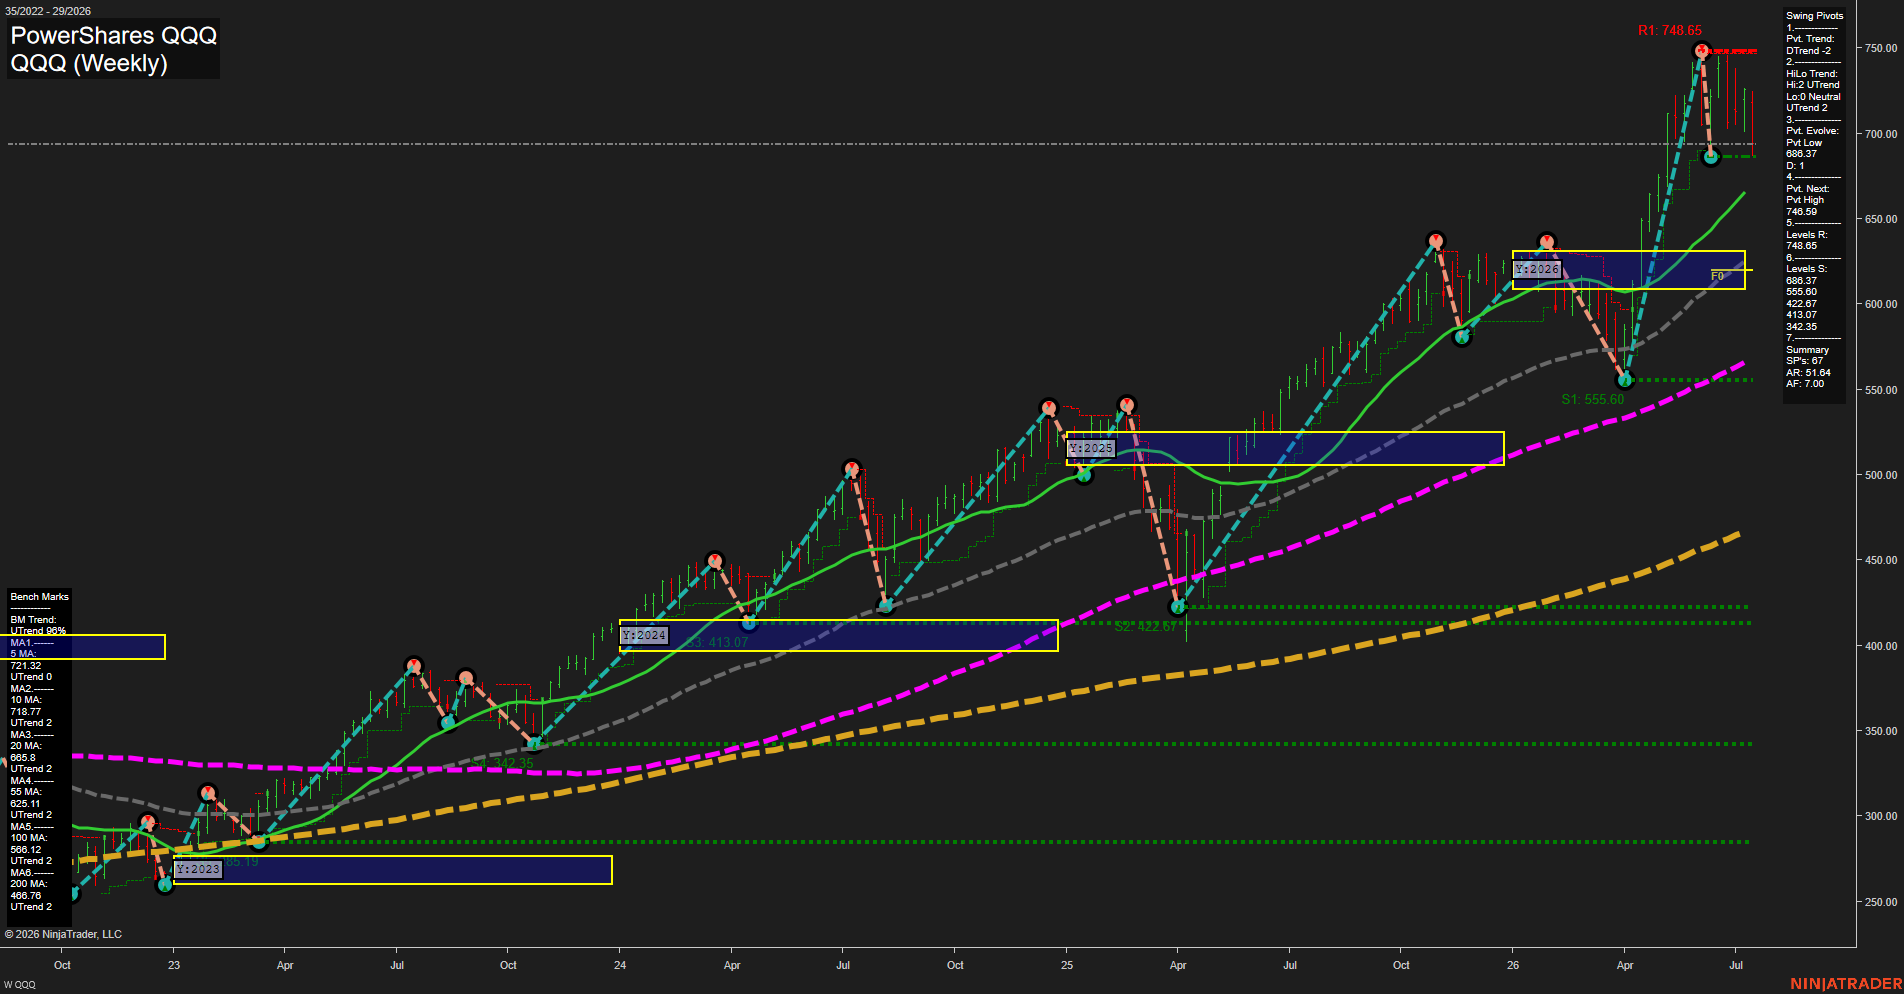
Overall Rating
- Short-Term: Bearish
- Intermediate-Term: Bullish
- Long-Term: Bullish.
Key Insights Summary
QQQ reflects a futures swing-trader style pullback within a broader bullish weekly structure. The short-term pivot sequence is in a DTrend after rejection from the 746.59 to 748.65 high area, with price below the rising 5 and 10 period benchmarks. The intermediate HiLo trend remains UTrend and price holds above the rising 20, 55, 100, and 200 period benchmarks. The 686.37 pivot area is the immediate structural support reference, while 746.59 is the key overhead swing-high resistance. The yearly grid bias remains positive because price is materially above the 2026 F0% and NTZ area, indicating that the current decline is a counter-trend retracement inside the larger advance rather than a confirmed long-term trend reversal.
View charts on: AlphaWebTrader HTF Charts
USO Weekly View
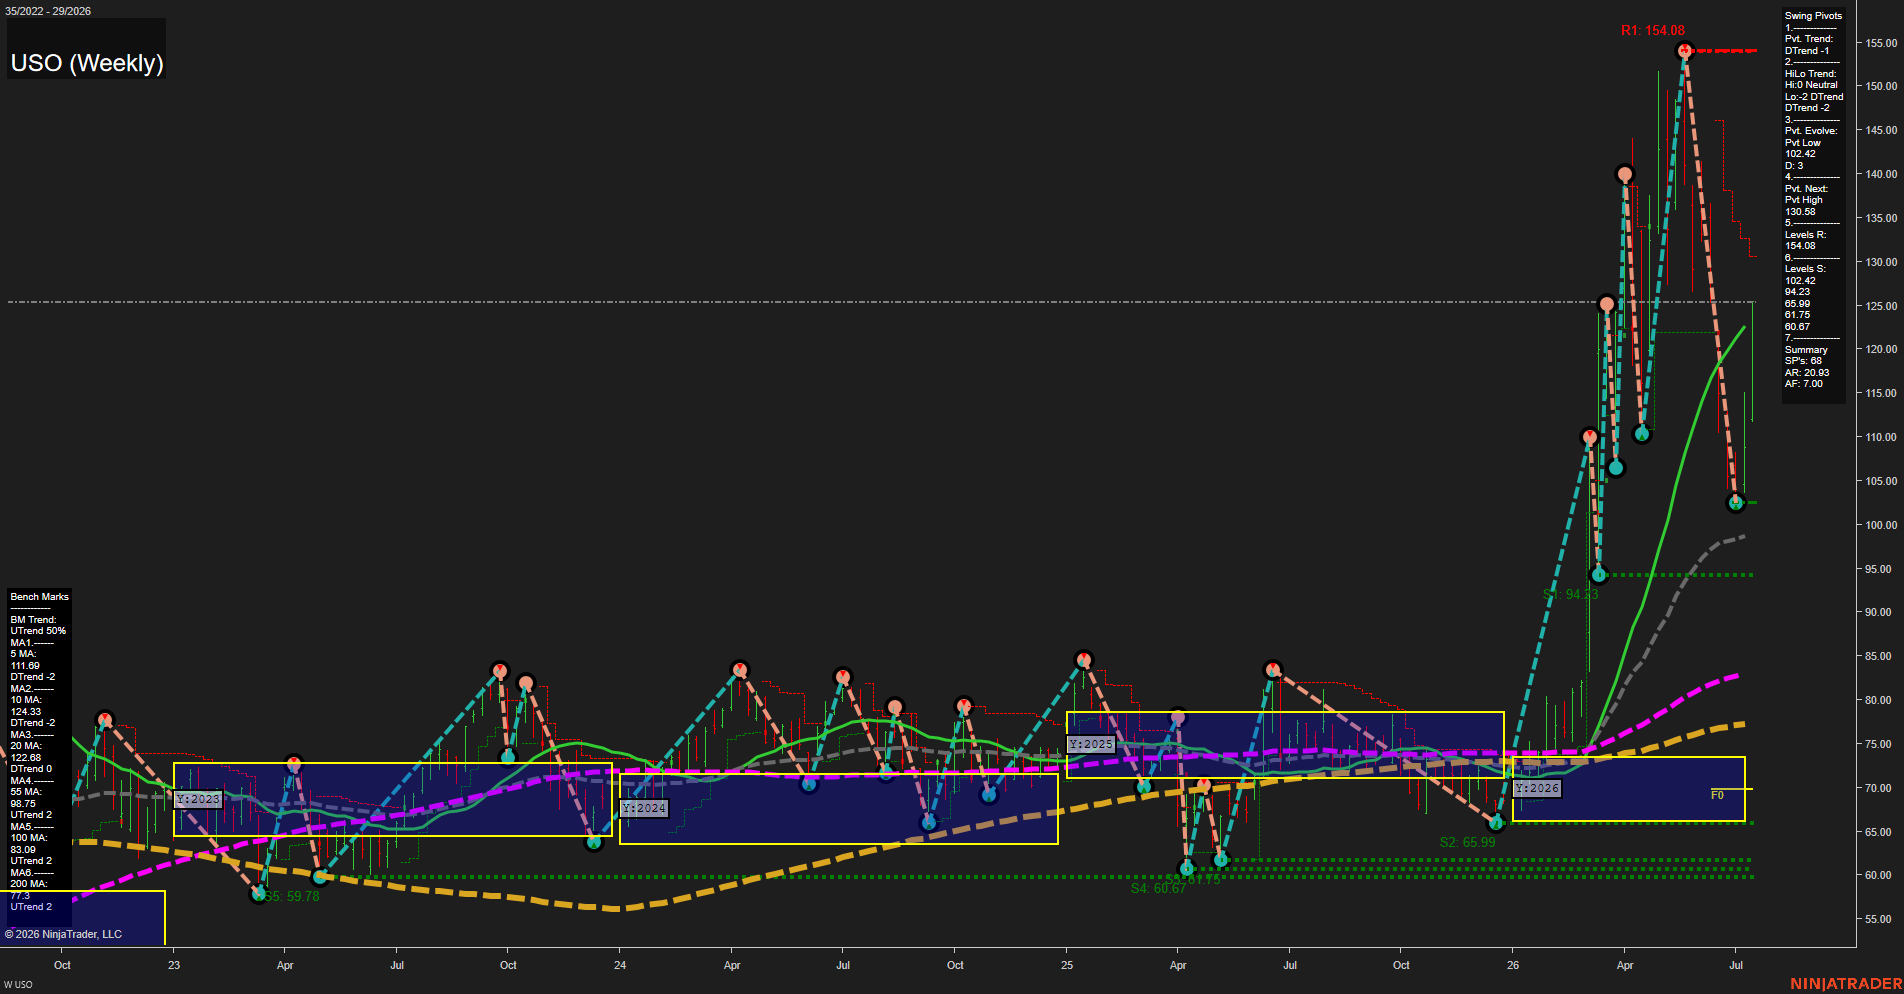
Overall Rating
- Short-Term: Bearish
- Intermediate-Term: Bearish
- Long-Term: Bullish.
Key Insights Summary
USO remains in a sharp weekly countertrend selloff following rejection from the 154.08 pivot high. Large-range bars and fast downside momentum have driven price beneath the 5, 10, and 20-week benchmarks, confirming short-term and intermediate-term pivot weakness. The 102.42 pivot low is the immediate structural reference, with 94.23 the next major support. Despite the intense retracement, price remains above the rising 55, 100, and 200-week benchmarks and well above the 2026 yearly NTZ, preserving the broader long-term recovery structure.
View charts on: AlphaWebTrader HTF Charts
GLD Weekly View
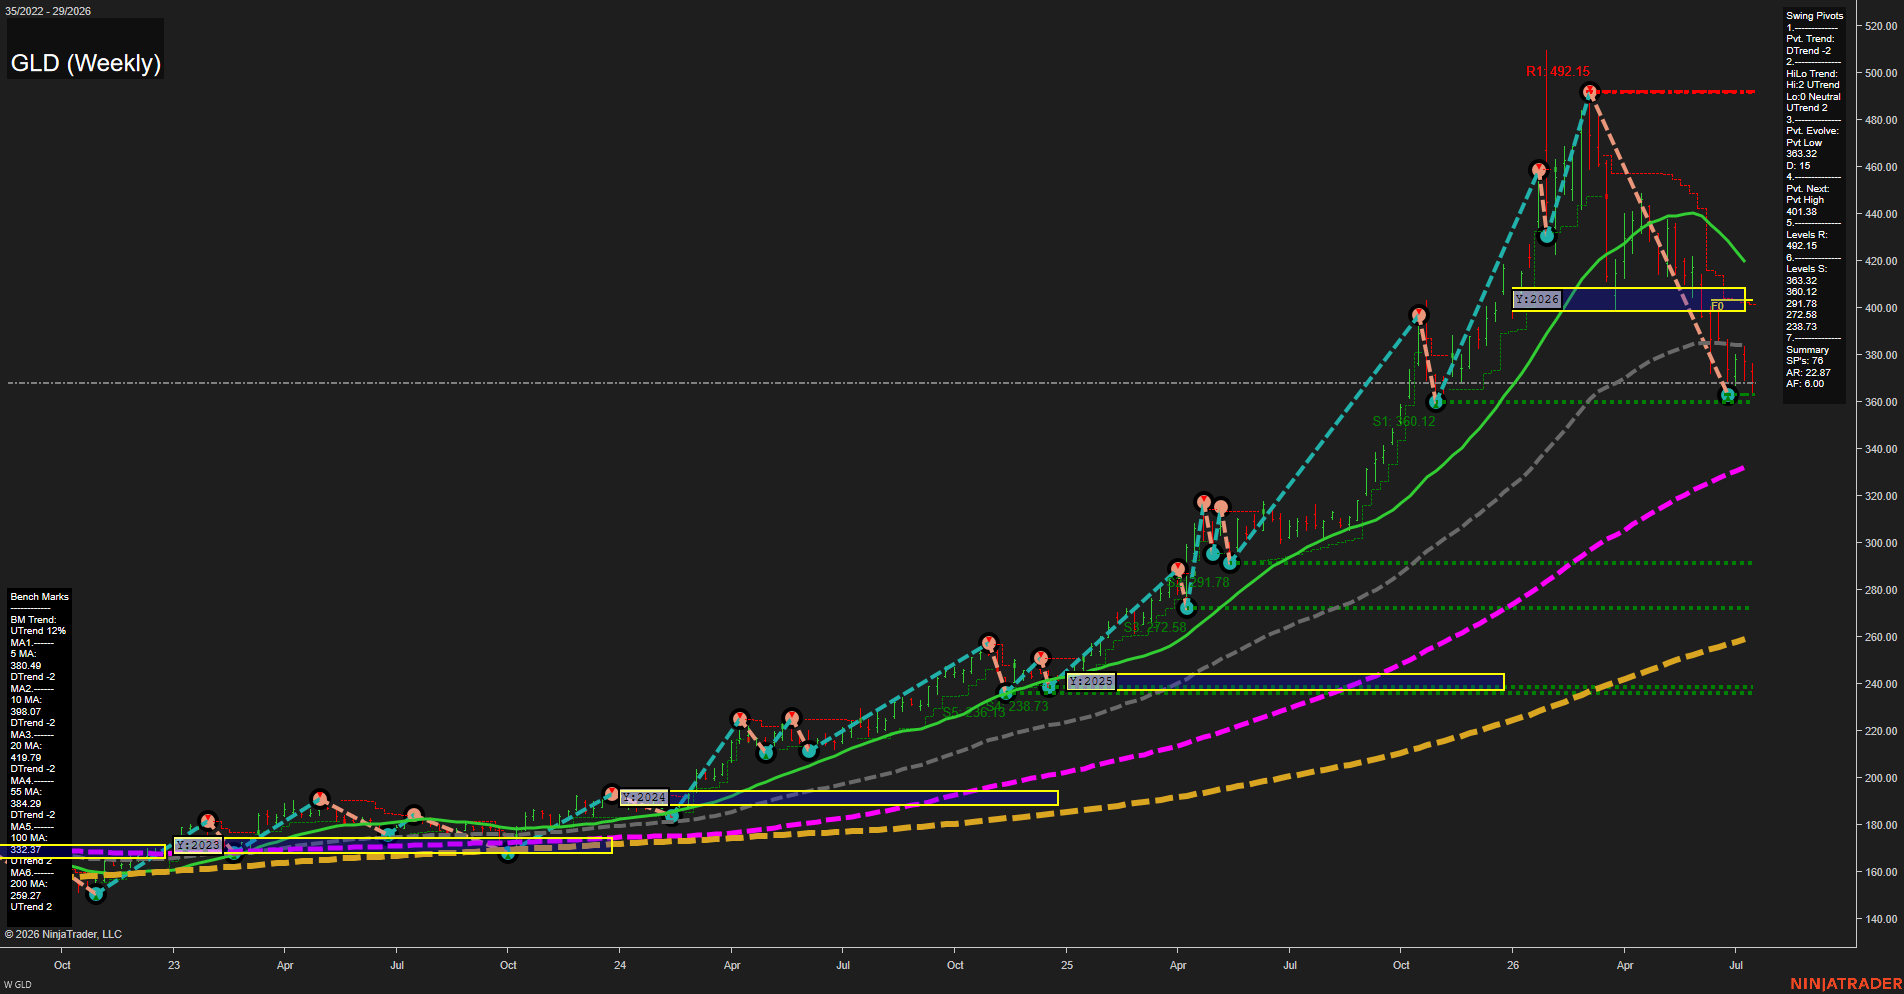
Overall Rating
- Short-Term: Bearish
- Intermediate-Term: Bearish
- Long-Term: Bullish.
Key Insights Summary
GLD reflects a sharp countertrend liquidation from the 492.15 swing-high area into the 363.32 to 360.12 support band. For a futures swing-trader framework, the short-term structure remains bearish: price is beneath the 5, 10, 20, and 55-week benchmarks, the active pivot trend is DTrend, and the yearly F0/NTZ area near 401.38 remains overhead resistance. The intermediate HiLo trend remains UTrend because the broader sequence of major higher lows has not yet been fully broken, while the rising 100- and 200-week benchmarks preserve the long-term bull-cycle context. The current market condition is a fast downside retracement within that larger uptrend, with 360.12 defining the nearby structural floor and 401.38 the first pivotal recovery threshold.
View charts on: AlphaWebTrader HTF Charts