
U.S. stocks closed a weak week lower as semiconductor and AI selling, high Treasury yields, oil volatility and Middle East tensions weighed on markets.
Fundamentals: U.S. equities ended lower as semiconductor and AI-related shares extended their decline, pulling major indexes down and pressuring technology leadership. Oil moved toward weekly highs amid Strait of Hormuz concerns, while elevated Treasury yields weighed on equity valuations and gold near $4,000. Consumer sentiment improved, but housing and import-cost pressures persisted.
Technicals: U.S. ETF trading was mixed, with USO leading gains alongside GLD and TLT, while NVDA, TSLA and META declined. Futures analysis showed consolidation in E-mini S&P 500 and Dow contracts, while Nasdaq, Russell 2000 and DAX daily structures remained bearish after pullbacks from recent highs. Across markets, longer-term moving-average trends generally stayed constructive.
After Market Close daily snapshot: market news summary and sentiment, major ETFs, Magnificent 7 analysis, Indices Futures Higher Time Frame Analysis, and E-mini S&P500, Nasdaq 100, NYMEX Crude, Gold Futures Daily Chart analysis.
As of: July 17, 2026 05:00 CT
Market News Summary:
U.S. equities ended a weak week lower as semiconductor and AI-related selling intensified, while oil volatility, Treasury-yield shifts, and Middle East tensions added cross-currents.
Primary Drivers & Risks:
- Primary Driver: Semiconductor-led technology selloff
- Primary Risk: High yields and geopolitical tensions
Tone:
Risk-off, volatile, and sector-driven.
Stock Market / ETFs / Indices:
The S&P 500, Nasdaq 100, and Dow declined, with the Dow down nearly 400 points. Chip stocks extended a multi-day slide as concerns over AI spending and China’s Moonshot AI model weighed on semiconductor and broader technology shares; Netflix also fell after warning of slower growth. Commentary cited fading tech leadership, elevated valuations, and unusually high volatility in tech and momentum stocks, although some analysts characterized the pullback as a reset and pointed to a strong earnings-season start.
Geopolitical:
Middle East tensions remained a source of market uncertainty. U.S. military efforts focused on protecting oil and gas flows through the Strait of Hormuz, while the Energy Secretary said Hormuz tolls were off the table.
Oil / Energy:
Oil prices moved back toward intraweek highs and USO participated in the year’s oil rally. Oil-market volatility and Ukrainian attacks on Russian refining were cited alongside rising gasoline prices, with the national average nearing $4 per gallon.
Gold / Metals:
Gold faced bearish pressure near the closely watched $4,000 level as high Treasury yields weighed on prices. Gold tested and rebounded around that area during the week, but several reports highlighted broken trend support, lower technical levels, and bearish near-term Wall Street sentiment; silver and platinum were also covered in market forecasts.
Fed / Financials:
Treasury-market signals on Federal Reserve rate hikes shifted after months of concern about further increases. Persistent high interest rates remained a stated headwind for equity valuations, while rising yields pressured gold.
Macro / Other:
Preliminary July consumer sentiment rose 10% to 54.4, its second consecutive monthly gain of that size. Import prices and declining housing affordability were cited as ongoing consumer-cost pressures.
Conclusion:
Technology and semiconductor weakness drove the index decline and weekly loss. AI-spending concerns and competitive developments in Chinese AI intensified pressure on market-leading chip shares.
Oil strength and Middle East supply-route concerns contrasted with the equity risk-off move. Treasury yields, gold’s $4,000 support test, consumer-cost pressures, and mixed earnings commentary added cross-currents.
Market News Sentiment
Market News Articles: 42
- Neutral: 40.48%
- Negative: 40.48%
- Positive: 19.05%
Sentiment Summary: Market news sentiment is evenly split between neutral and negative coverage at 40% each, while positive coverage accounts for 19%.
Conclusion: Indices futures headlines reflect a cautious tone, with negative and neutral news outweighing positive reports.
GLD,Gold Articles: 16
- Negative: 62.50%
- Positive: 25.00%
- Neutral: 12.50%
Sentiment Summary: GLD/Gold coverage is predominantly negative at 63%, with 25% positive and 13% neutral across 16 articles.
Conclusion: Gold-related news tone is negative overall, which may be relevant to indices futures traders monitoring cross-asset market sentiment.
USO,Oil Articles: 9
- Positive: 66.67%
- Negative: 22.22%
- Neutral: 11.11%
Sentiment Summary: USO/Oil coverage is predominantly positive, with 67% positive, 22% negative, and 11% neutral articles.
Conclusion: Oil-related news sentiment is net positive, which may be relevant context for energy-sensitive index futures components.
Market Data Snapshot
ETF Snapshot of major stock market ETFs, Mag7, and others as of: July 17, 2026 05:00
Top Movers & Losers
- USO 123.96 Bullish 3.91% ▲
- GLD 368.41 Bullish 0.95% ▲
- TLT 84.52 Bullish 0.37% ▲
- NVDA 202.81 Bearish -2.21% ▼
- TSLA 380.84 Bearish -2.61% ▼
- META 646.01 Bearish -2.79% ▼
Major Index ETFs: SPY, QQQ, DIA, IWM, IJH
- IWM 294.04 Bearish -0.52% ▼
- IJH 75.54 Bearish -0.59% ▼
- DIA 520.81 Bearish -0.77% ▼
- SPY 743.29 Bearish -0.99% ▼
- QQQ 695.33 Bearish -1.50% ▼
Major index ETFs were Bearish across the board: QQQ led declines at -1.50%, followed by SPY at -0.99% and DIA at -0.77%. IJH fell -0.59%, while IWM was the least negative mover at -0.52%.
Mag 7 Stocks: AAPL, MSFT, GOOG, AMZN, META, NVDA, TSLA
- AAPL 333.74 Bullish 0.14% ▲
- AMZN 247.23 Bearish -1.06% ▼
- MSFT 393.82 Bearish -1.81% ▼
- GOOG 346.12 Bearish -2.17% ▼
- NVDA 202.81 Bearish -2.21% ▼
- TSLA 380.84 Bearish -2.61% ▼
- META 646.01 Bearish -2.79% ▼
Mixed Mag7 performance: AAPL was the most bullish mover at +0.14%, a marginal gain. META was the most bearish mover at -2.79%, followed by TSLA at -2.61%, NVDA at -2.21%, and GOOG at -2.17%. MSFT declined -1.81% and AMZN fell -1.06%, leaving broad Bearish pressure across the group.
Cross-Market ETFs: TLT, GLD, USO, IBIT
- USO 123.96 Bullish 3.91% ▲
- GLD 368.41 Bullish 0.95% ▲
- TLT 84.52 Bullish 0.37% ▲
- IBIT 36.35 Bearish -0.11% ▼
Other ETFs were Mixed: USO was the most bullish mover at +3.91%, while GLD gained +0.95% and TLT added +0.37%. IBIT was the most bearish mover, marginally lower at -0.11%.
ETF, Mag7, and Cross-Market ETF Insights
Overall Tone
Mixed conditions: equity ETFs and Mag7 were Bearish, while strength in oil, gold, and bonds provided a selective Bullish cross-market counterweight.
Equity ETFs and Mag7:
Major equity ETFs were broadly Bearish, led lower by QQQ at -1.50%, followed by SPY at -0.99% and DIA at -0.77%; IWM at -0.52% was the least negative mover, while IJH declined -0.59%. Mag7 performance was also broadly Bearish and weaker than the major index ETFs, with AAPL marginally positive at +0.14% as the most bullish mover and META at -2.79% as the most bearish mover. TSLA fell -2.61%, NVDA -2.21%, GOOG -2.17%, MSFT -1.81%, and AMZN -1.06%, indicating selective rather than aligned equity leadership.
Cross-Market ETFs:
Cross-market ETFs were Mixed but generally Bullish outside of IBIT, with USO the most bullish mover at +3.91%, materially stronger than equities. GLD gained +0.95% and TLT rose +0.37%, while IBIT was marginally Bearish at -0.11% as the most bearish mover. Oil strength alongside gains in gold and bonds diverged from the broad Bearish equity ETF and Mag7 performance.
Futures Indices – Higher Time Frame Analysis
Summary of the current state of US Indices Futures based on higher time-frame (HTF) technical analysis as of: 2026-07-17: 17:00 CT.
US Indices Futures
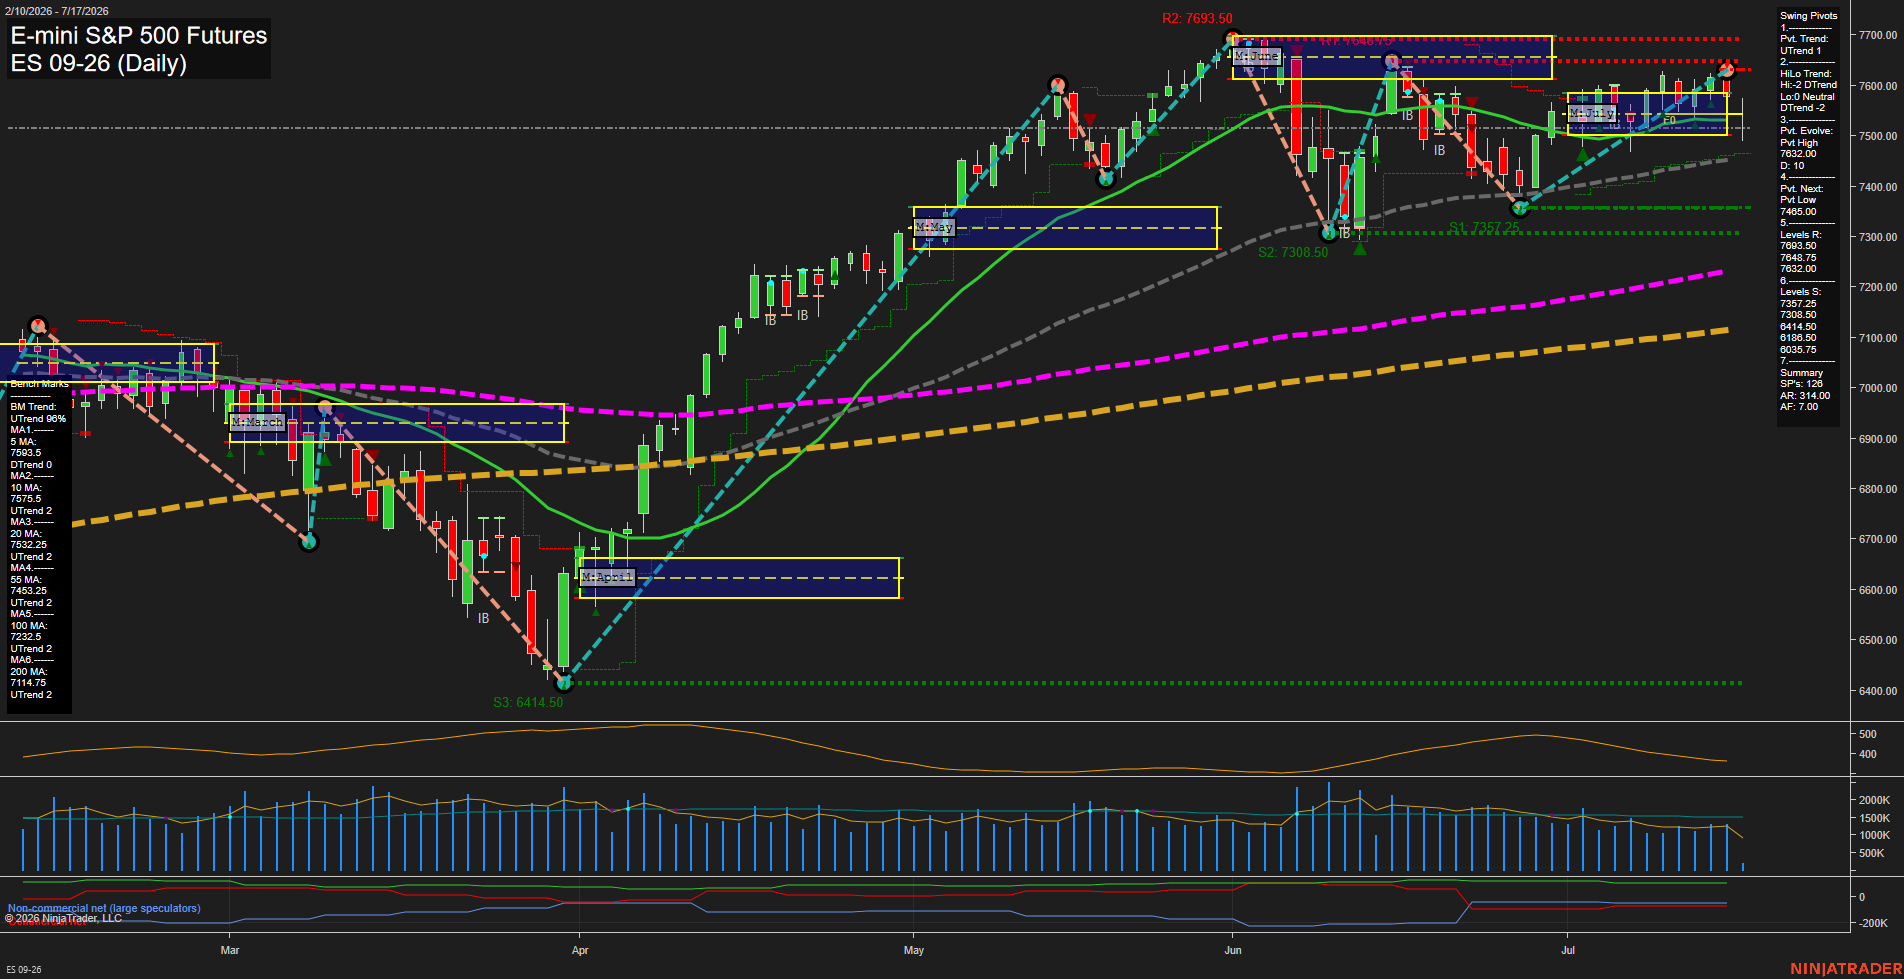
- ES: YSFG up; MSFG/WSFG below F0%, UTrend and rising benchmarks; 7278.50 pivot support, 7632/7648.75/7693.50 resistance.
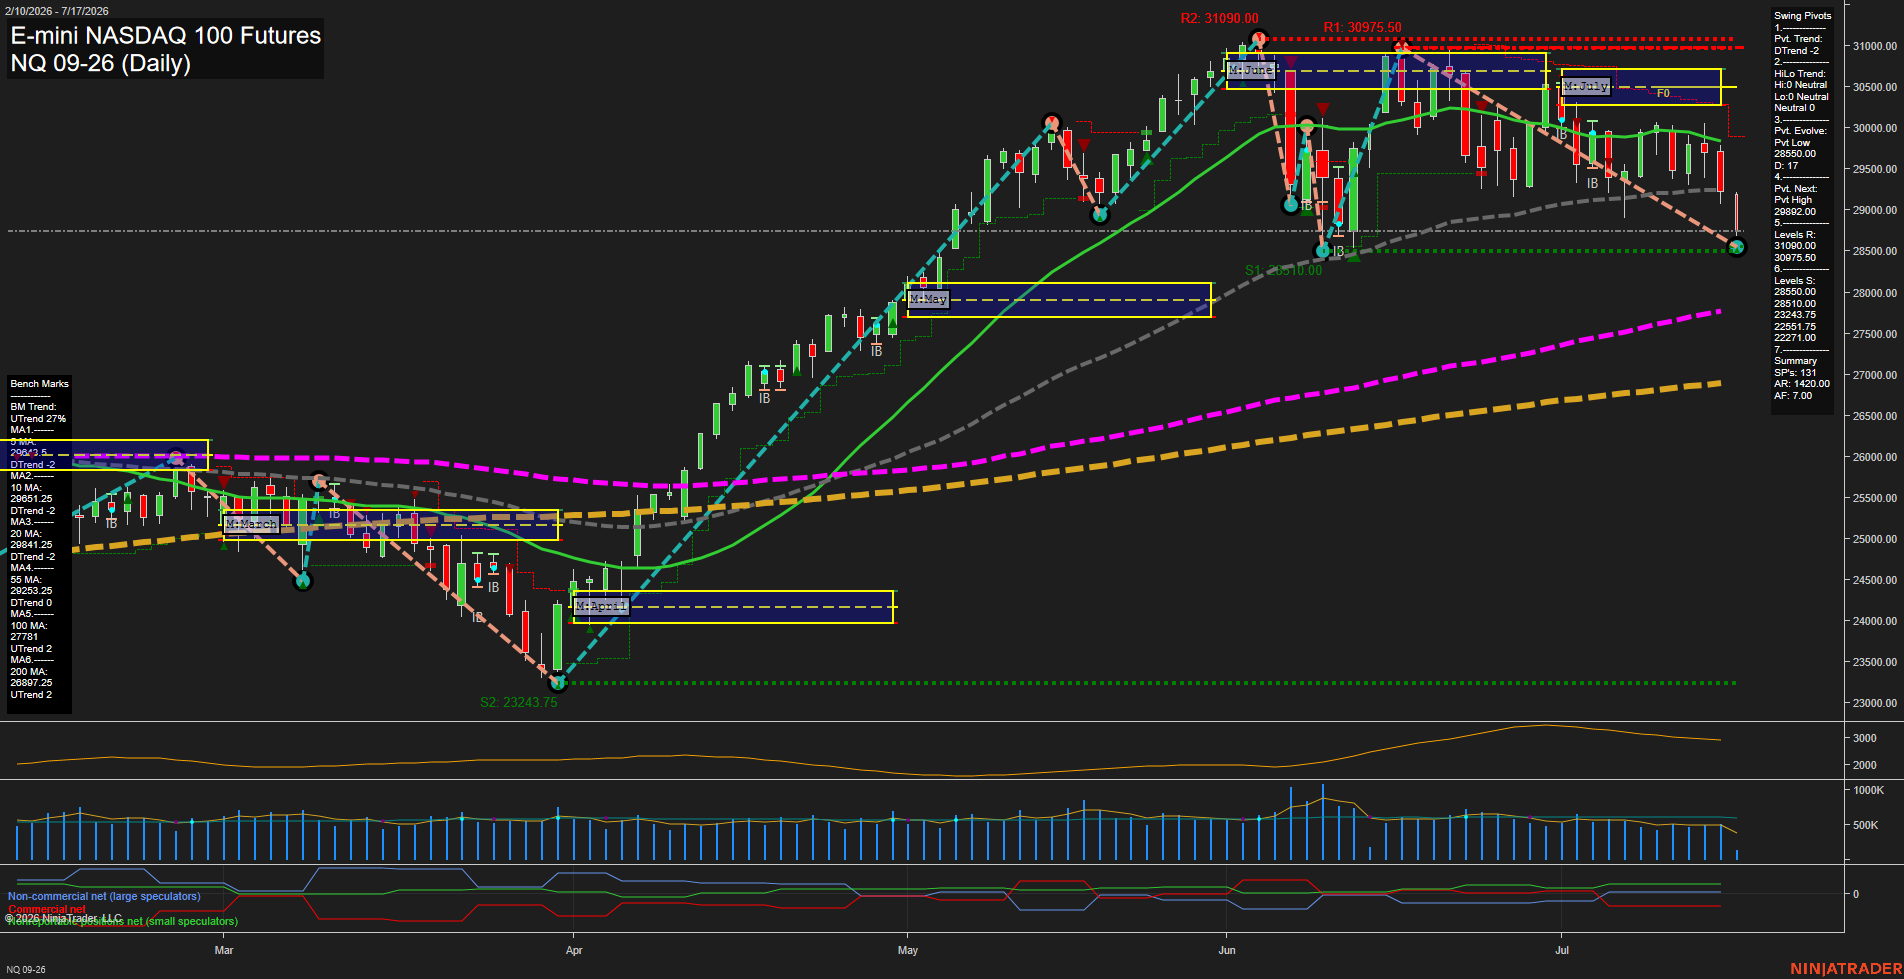
- NQ: YSFG up; MSFG/WSFG down below F0%, DTrend and declining short benchmarks; 27757/26392 support, 31090 resistance.
- YM: YSFG up; MSFG near F0%, WSFG down; benchmarks remain aligned upward; 51006/52255 support, 53393/53658 resistance.
- EMD: YSFG and WSFG above F0%, MSFG below F0%; mixed daily pivots; 3727.8/3692.9 support, 3839.8/3892.4 resistance.
- RTY: YSFG up; MSFG/WSFG below F0%, weekly UTrend versus daily DTrend; 2941.9/2827.8 support, 3043.0/3068.4 resistance.
- FDAX: YSFG and benchmarks up; MSFG/WSFG below F0%, daily downside momentum; 24715/24130 support, 25487/26064 resistance.
Overall State
- Short-Term: Bearish
- Intermediate-Term: Neutral
- Long-Term: Bullish
Conclusion
Long-term YSFG structure and 100/200-period benchmarks remain upward across all indices. Short-term MSFG and WSFG weakness is concentrated in NQ and FDAX, with YM and RTY also retracing. ES and EMD remain comparatively balanced near pivot resistance. NQ and FDAX are the principal downside momentum correlations, while major pivot supports define current corrective structure.
Note: Intra-day counter-trend pullbacks or retracements may occur, HTF is context for informational usage and market structure. Glossary: Session Fib Grids periods of YSFG:’Yearly’, MSFG:’Monthly’, WSFG:’Weekly’
For full details visit: AlphaWebTrader Technicals
ES Daily View
Overall Rating
- Short-Term: Neutral
- Intermediate-Term: Neutral
- Long-Term: Bullish.
Key Insights Summary
Price is consolidating just below the 7632.00 pivot-high resistance after recovering from the late-June pullback. The short-term pivot has turned upward and price remains above the rising 10-day and 20-day benchmarks, but the weekly and monthly fib-grid readings remain below their F0% levels while the intermediate HiLo pivot trend remains down. This creates a mixed swing structure: an advancing near-term recovery inside a broader consolidation beneath 7648.75 and 7693.50 resistance. The long-term structure remains constructive, supported by price holding above all major rising intermediate- and long-term moving averages and the positive yearly fib-grid trend.
View charts on: AlphaWebTrader HTF Charts
NQ Daily View
Overall Rating
- Short-Term: Bearish
- Intermediate-Term: Bearish
- Long-Term: Bullish.
Key Insights Summary
Daily price action has shifted into a fast downside swing, with large bars pressing the 28550 to 28510 pivot-support area after rejection from the 30975.5 to 31090 resistance zone. Short-term structure is a DTrend, price is below both the weekly and monthly Fib-grid centers, and all short-to-intermediate benchmark averages are declining. The larger 2026 trend remains constructive because price is still above rising 100-day and 200-day benchmarks, framing the current decline as a sharp countertrend retracement within the longer-term advance.
View charts on: AlphaWebTrader HTF Charts
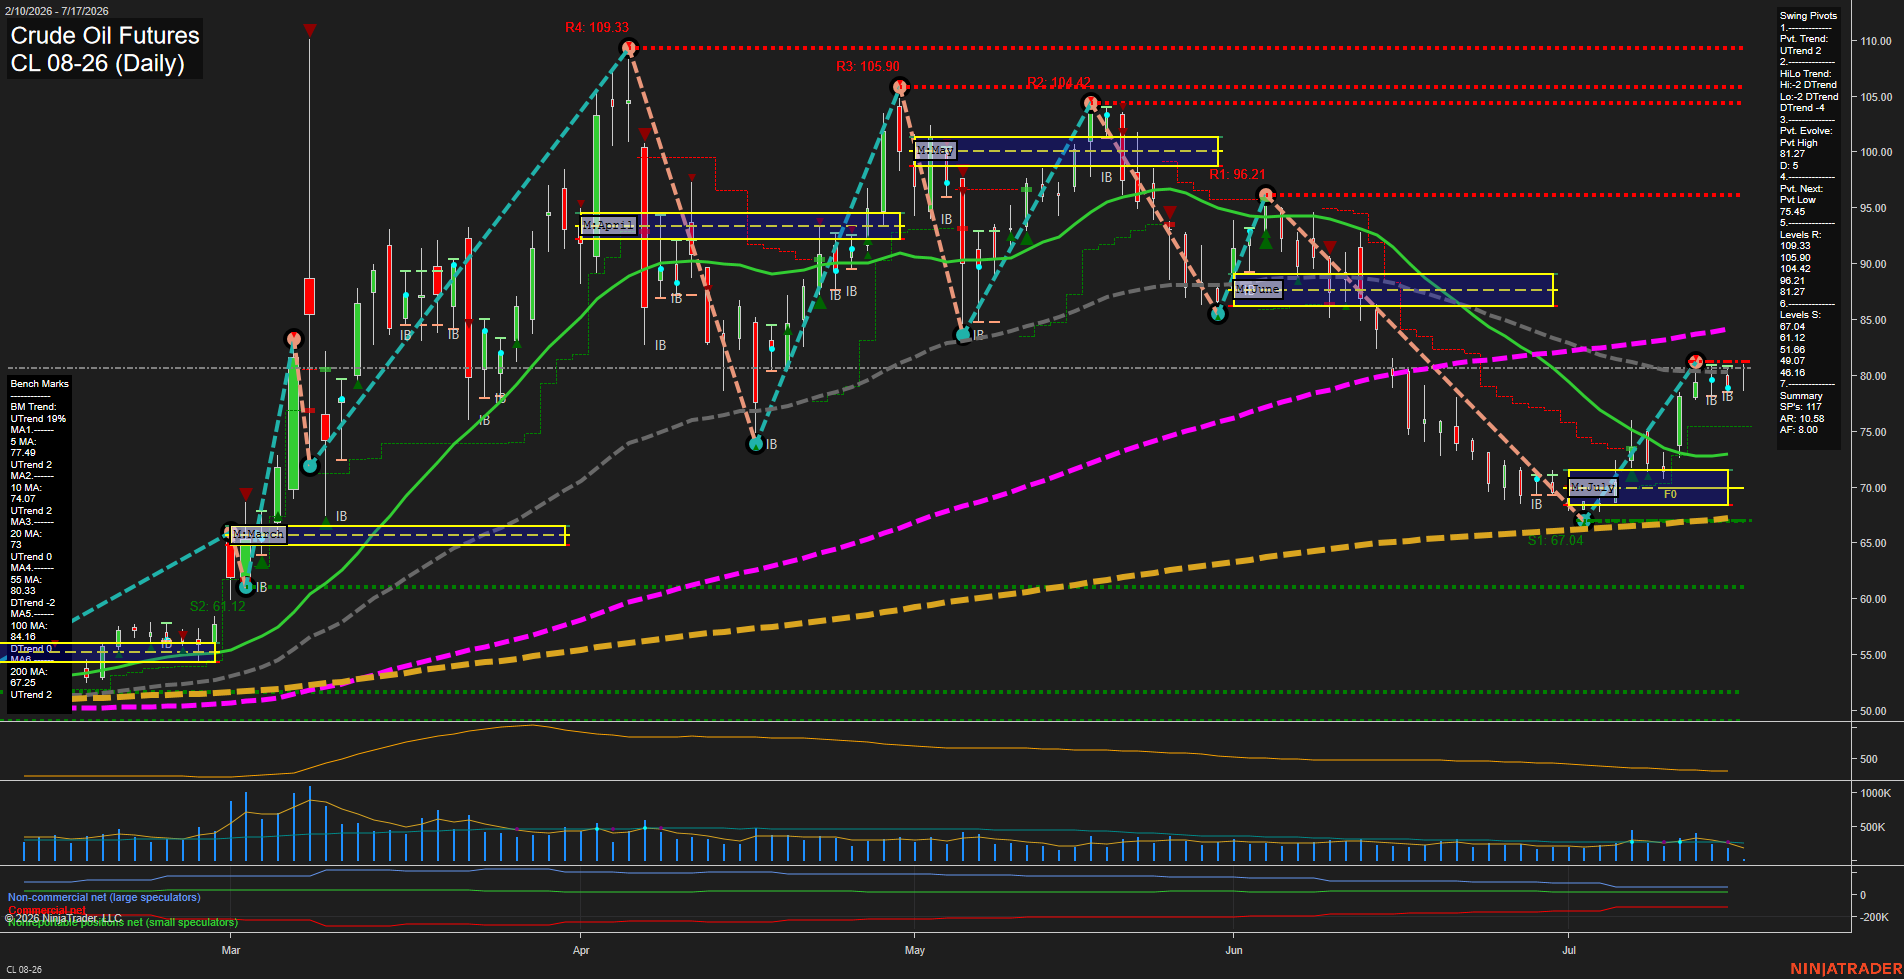
CL Daily View
Overall Rating
- Short-Term: Bullish
- Intermediate-Term: Neutral
- Long-Term: Neutral.
Key Insights Summary
Price has staged a sharp V-shaped recovery from the July low near 67.04 and is holding above the rising 5-, 10-, and 20-day benchmarks, supporting the short-term UTrend and positive weekly/monthly Fib-grid bias. The rebound has reached the declining 55-day average near 80.33 and remains below the 100-day average near 84.10, leaving the intermediate structure defined as a countertrend recovery within a broader HiLo DTrend. Small recent bars near 81 indicate slowing momentum and consolidation beneath the evolving 81.87 pivot high, while 75.45 is the next pivot-reversal reference. The major 200-day benchmark remains rising near 67.25, preserving constructive long-cycle support despite the intermediate-term overhead resistance structure.
View charts on: AlphaWebTrader HTF Charts
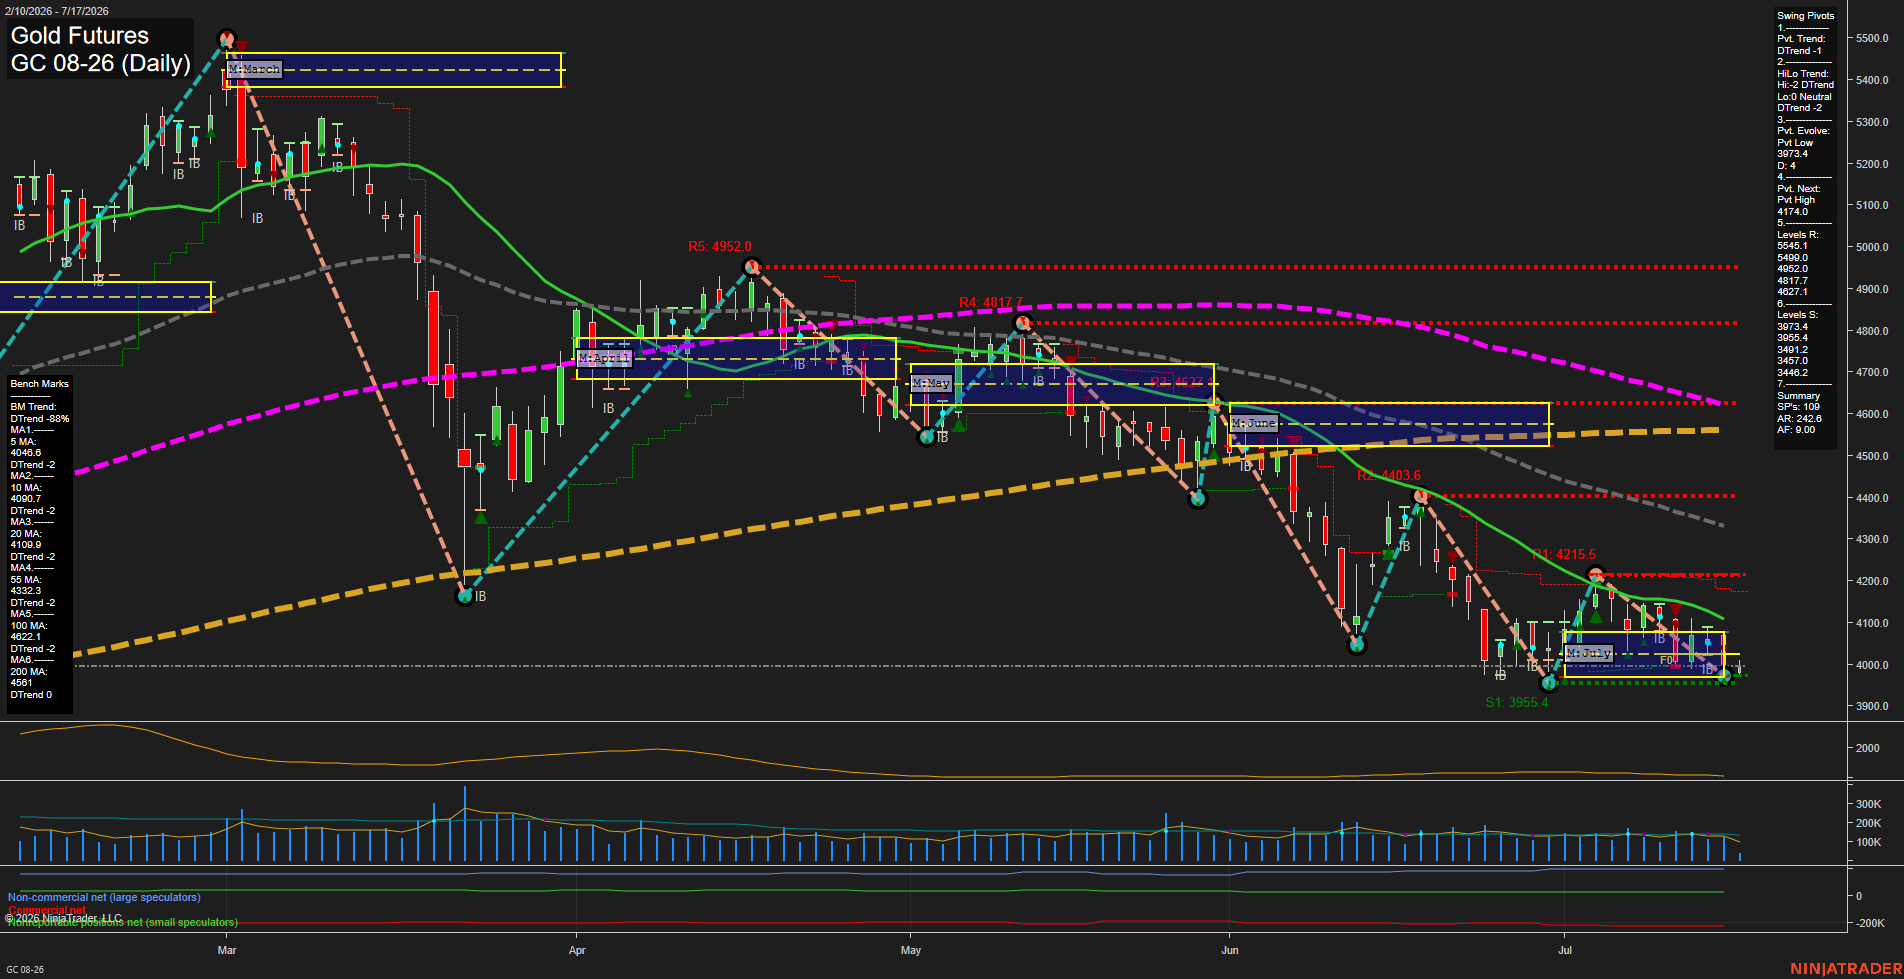
GC Daily View
Overall Rating
- Short-Term: Bearish
- Intermediate-Term: Bearish
- Long-Term: Bearish.
Key Insights Summary
Gold remains in a broad daily downtrend, with price trading beneath the declining 10, 20, 55, 100, and 200-day benchmarks. The July monthly grid is marginally positive above its F0% level, but this counter-trend condition has not changed the lower-high and lower-low pivot structure. Small daily bars and slowing momentum indicate consolidation near the 3955.4 to 3973.4 support zone, while 4174.0 is the next pivot reversal threshold and 4215.5 is nearby structural resistance. The short-term signal alignment is negative, and the intermediate and long-term benchmark structure remains decisively downward.
View charts on: AlphaWebTrader HTF Charts