U.S. pre-market trading is mixed as ETF strength in NVDA, IBIT and USO contrasts with weakness in AAPL and MSFT amid oil, Fed and Middle East risks.
Fundamentals: U.S. pre-market sentiment is being shaped by rising U.S.-Iran tensions, disruptions in the Strait of Hormuz, and a jump in oil prices after attacks on shipping and energy targets. Softer inflation data supported rate-cut expectations and lifted futures, while traders also weighed Fed testimony, AI-led equity strength, and a mixed earnings backdrop.
Technicals: Early trading shows a mixed risk backdrop as major ETFs finish with strength in NVDA, IBIT and USO while AAPL and MSFT lag. Futures remain broadly constructive on the daily and longer time frames, but several weekly and daily structures show near-term pullbacks or consolidation across ES, NQ, YM, EMD, RTY and FDAX.
Pre-Market Trading 360° view Market Radar of: holidays, earnings, eco-news, market-news summary, news sentiment, prior session major ETFs, MAG7, Higher Time Frame Analysis Indices Futures Summary, and E-mini S&P500, Nasdaq 100, NYMEX Crude, Gold Futures Daily Chart analysis.
As of: July 15, 2026 07:16 CT
Earnings Radar
Monitoring for earnings releases by the Magnificent 7, AI-tech-related firms, and major financial institutions.
- MS Release: 2026-07-15 T:BMO
Conclusion: Morgan Stanley’s 2026-07-15 pre-market release is the only event listed, so the main index impact centers on financials and broader risk sentiment rather than MAG7 or semis. With no additional major tech or AI names in the data, the session focus stays on the immediate read-through from MS and its effect on bank-sector tone.
For full details visit: Yahoo Earnings Calendar
EcoNews Radar U.S. Events
| Day | Time | Impact | Event |
|---|---|---|---|
| Wed | 08:30 | High | Core PPI m/m |
| Wed | 08:30 | High | PPI m/m |
| Wed | 10:00 | High | Fed Chairman Warsh Testifies |
| Wed | 10:30 | Low | Crude Oil Inventories |
| Thu | 08:30 | Medium | Core Retail Sales m/m |
| Thu | 08:30 | Medium | Philly Fed Manufacturing Index |
| Thu | 08:30 | Medium | Retail Sales m/m |
| Thu | 08:30 | Medium | Unemployment Claims |
| Fri | 10:00 | Medium | Prelim UoM Consumer Sentiment |
| Fri | 10:00 | Medium | Prelim UoM Inflation Expectations |
EcoNews Summary
Wednesday carries the week’s highest-impact market catalysts, led by USD Core PPI m/m, USD PPI m/m, and USD Fed Chairman Warsh Testifies. Thursday and Friday include medium-impact USD data focused on retail demand, labor conditions, manufacturing activity, and consumer inflation sentiment. The only energy-linked release is Wednesday’s crude oil inventories report, which draws attention because it reflects petroleum supply and can influence energy prices and inflation-sensitive index moves.
Event Notes:
- Wednesday 08:30 USD Core PPI m/m: Measures monthly producer price inflation excluding food and energy; traders monitor it for upstream inflation pressure and its market impact on rate expectations.
- Wednesday 08:30 USD PPI m/m: Measures monthly change in prices received by domestic producers; a key inflation gauge that informs yield, dollar, and equity index reaction.
- Wednesday 10:00 USD Fed Chairman Warsh Testifies: A high-impact Fed communication event that can shift expectations on policy stance, rates, and risk sentiment.
- Wednesday 10:30 USD Crude Oil Inventories: Measures weekly change in crude stockpiles; traders monitor it for petroleum supply conditions, energy price direction, and inflation-sensitive market reactions.
- Thursday 08:30 USD Core Retail Sales m/m: Measures consumer spending excluding autos; monitored as a read on demand strength and overall economic momentum.
- Thursday 08:30 USD Philly Fed Manufacturing Index: Measures regional manufacturing activity; traders watch it for industrial growth and business-cycle signals.
- Thursday 08:30 USD Retail Sales m/m: Measures total monthly retail spending; a broad gauge of consumer demand that can influence growth and inflation expectations.
- Thursday 08:30 USD Unemployment Claims: Measures initial filings for jobless benefits; watched as a timely labor-market indicator and sentiment driver.
- Friday 10:00 USD Prelim UoM Consumer Sentiment: Measures consumer confidence in economic conditions; monitored for demand outlook and risk appetite.
- Friday 10:00 USD Prelim UoM Inflation Expectations: Measures consumer inflation outlook; watched for its influence on rate expectations and inflation narrative.
Conclusion:
Wednesday is the most important day of the week, with USD Fed Chairman Warsh Testifies as the single most important event. The combination of high-impact producer inflation data at 08:30 and a 10:00 Fed testimony creates the main volatility window for indices futures, while the 10 AM time cycle also stands out as a catalyst point for continuation or reversal. Wednesday’s crude oil inventories release adds an energy-supply focus that feeds into inflation and broader index sentiment.
For full details visit: Forex Factory EcoNews
Market News Summary:
Markets focused on U.S.-Iran tensions, oil disruption risks, softer inflation data, and mixed signals around AI, earnings, and rates.
Primary Drivers & Risks:
- Primary Driver: Strait of Hormuz oil disruption
- Primary Risk: Inflation and volatility pickup
Tone:
Risk-sensitive and cross-asset driven.
Stock Market / ETFs / Indices:
U.S. stock futures moved higher after softer CPI lifted rate-cut expectations, with Nasdaq futures leading. Headlines also pointed to AI leadership returning, strong earnings themes, and concern about AI froth, stock issuance, and a broader divide in earnings season.
Geopolitical:
U.S.-Iran hostilities intensified, with strikes, retaliation, and a naval blockade tied to Iranian ports and shipping. Coverage repeatedly highlighted the Strait of Hormuz as a critical pressure point for global markets.
Oil / Energy:
Oil prices rose to a one-month high as attacks on shipping and energy targets in the Strait of Hormuz disrupted trade. OPEC also cut its 2026 oil demand outlook, while the IMF warned that the global economy has less cushion against energy supply shocks.
Gold / Metals:
Gold and silver rebounded after softer U.S. inflation data, but higher oil prices and Middle East risks kept inflation concerns alive. Another update noted gold was steady while rising yields increased the opportunity cost of holding non-interest-bearing assets.
Fed / Financials:
Inflation cooled and the chance of a rate hike this month was described as low. Commentary around Kevin Warsh, Fed uncertainty, and reduced Fed rate-hike expectations kept policy as a central market theme, while Goldman Sachs reported strong Q2 results with solid trading and investment banking activity.
Macro / Other:
Mortgage rates rose to the highest level in nearly a year, weighing on homebuyer activity. Data center power costs, softer U.S. inflation, and China refiners reducing fuel oil demand added further macro cross-currents.
Conclusion:
The main drivers are the U.S.-Iran conflict, oil’s move higher, and softer U.S. inflation data that supported equities and rate-sensitive assets. These themes are also feeding into gold, Treasury, and futures pricing.
Secondary drivers include AI-related market leadership, strong and uneven earnings season signals, and rising concerns about stock issuance and market froth. Higher mortgage rates, power costs, and reduced energy supply buffer remain additional cross-currents.
Market News Sentiment
Market News Articles: 52
- Neutral: 59.62%
- Negative: 26.92%
- Positive: 13.46%
Sentiment Summary: Market news is predominantly neutral at 60%, with negative articles at 27% and positive articles at 13%.
Conclusion: The news flow is mostly mixed and non-directional, with neutral coverage outweighing both negative and positive sentiment.
GLD,Gold Articles: 10
- Negative: 40.00%
- Neutral: 30.00%
- Positive: 30.00%
Sentiment Summary: GLD and gold articles are mixed, with 40% negative, 30% neutral, and 30% positive sentiment across 10 articles.
Conclusion: The overall tone is slightly negative, with no clear directional sentiment dominance.
USO,Oil Articles: 15
- Positive: 60.00%
- Negative: 33.33%
- Neutral: 6.67%
Sentiment Summary: Oil-related coverage for USO is mostly positive, with 60% positive articles, 33% negative articles, and 7% neutral articles.
Conclusion: The news flow is positive overall and shows a mixed but positive-skewed tone in oil sentiment.
Market Data Snapshot
ETF Snapshot of major stock market ETFs, Mag7, and others as of: July 15, 2026 07:16
Top Movers & Losers
- NVDA 211.80 Bullish 4.06% ▲
- IBIT 36.58 Bullish 3.86% ▲
- USO 120.17 Bullish 2.02% ▲
- DIA 524.69 Bullish 0.04% ▲
- AAPL 314.86 Bearish -0.77% ▼
- MSFT 384.93 Bearish -1.55% ▼
Major Index ETFs: SPY, QQQ, DIA, IWM, IJH
- QQQ 719.69 Bullish 1.12% ▲
- IJH 75.57 Bullish 0.44% ▲
- SPY 751.83 Bullish 0.36% ▲
- IWM 294.51 Bullish 0.35% ▲
- DIA 524.69 Bullish 0.04% ▲
Indices futures tone is bullish across the group, led by QQQ at +1.12% as the most bullish mover; IJH followed at +0.44%, SPY at +0.36%, and IWM at +0.35%, while DIA was the least positive mover at +0.04%, essentially flat.
Mag 7 Stocks: AAPL, MSFT, GOOG, AMZN, META, NVDA, TSLA
- NVDA 211.80 Bullish 4.06% ▲
- GOOG 357.33 Bullish 1.90% ▲
- META 661.04 Bullish 0.66% ▲
- TSLA 396.18 Bullish 0.36% ▲
- AMZN 247.49 Bullish 0.07% ▲
- AAPL 314.86 Bearish -0.77% ▼
- MSFT 384.93 Bearish -1.55% ▼
Mag7 is Mixed: NVDA led the group as the most bullish mover at +4.06%, followed by GOOG at +1.90%, META at +0.66%, TSLA at +0.36%, and AMZN near-flat at +0.07%; on the downside, AAPL was the most bearish mover at -0.77%, while MSFT marked the largest net loss at -1.55%.
Cross-Market ETFs: TLT, GLD, USO, IBIT
- IBIT 36.58 Bullish 3.86% ▲
- USO 120.17 Bullish 2.02% ▲
- GLD 372.15 Bullish 1.37% ▲
- TLT 84.08 Bullish 0.13% ▲
Mixed-to-Bullish cross-market tone: IBIT led as the most bullish mover at +3.86%, followed by USO at +2.02% and GLD at +1.37%, while TLT was the least positive mover with a near-flat +0.13%.
ETF, Mag7, and Cross-Market ETF Insights
Overall Tone
The tape is Bullish overall, with equities and cross-market ETFs showing constructive risk appetite led by growth and crypto exposure, while defensive signals remain mixed.
Equity ETFs and Mag7:
Major index ETFs are broadly aligned to the upside, led by QQQ at +1.12%, while SPY at +0.36%, IWM at +0.35%, IJH at +0.44%, and DIA at +0.04% are all near-flat to modestly positive. Mag7 leadership is selective and concentrated in NVDA at +4.06% and GOOG at +1.90%, while MSFT at -1.55% and AAPL at -0.77% lag; META at +0.66%, TSLA at +0.36%, and AMZN at +0.07% are comparatively muted. The most bullish mover is NVDA at +4.06%, and the most bearish mover is MSFT at -1.55%.
Cross-Market ETFs:
Cross-market ETFs are mostly constructive and somewhat aligned with the equity bid, highlighted by IBIT at +3.86% and USO at +2.02%. GLD at +1.37% also firms, while TLT at +0.13% is near-flat and less directional. The most bullish mover is IBIT at +3.86%, and the least positive mover is TLT at +0.13%.
Futures Indices – Higher Time Frame Analysis
Summary of the current state of US Indices Futures based on higher time-frame (HTF) technical analysis as of: 2026-07-15: 07:16 CT.
US Indices Futures
- ES Weekly: WSFG below F0%, YSFG/MSFG bullish, rising MA stack above 20/55/100/200D, pivot high then low, resistance 7628.75/7648.75/7693.50, support 7545.25/7357.25/7308.50.
- NQ Weekly: WSFG below NTZ, YSFG bullish, MSFG below center, MA stack above 20/55/100/200D, pivot trend UTrend, resistance 30975.50/31090.00/31090 pivot, support around 30293.75.
- YM Weekly: WSFG below center, YSFG/MSFG bullish, rising benchmark stack, pivots in UTrend, new highs near 53586, support at 52255, 50136, 48986, 45430.
- EMD Weekly: WSFG/MSFG below center, YSFG bullish, rising MA stack across 5/10/20/55/100/200D, pivot trend UTrend, breakout toward 3892.4, support from prior pivot low zone.
- RTY Weekly: WSFG/MSFG below F0%, YSFG bullish, 55/100/200D still constructive, reversal from 3068 high, next lower pivot 2827.8, support near 2943.4 and below.
- FDAX Weekly: YSFG above f0%, WSFG/MSFG mixed to softer, MA stack rising, pivots in UTrend, fresh highs near 26064, resistance overhead, pullback structure remains contained.
Overall State
- Short-Term: Neutral
- Intermediate-Term: Bullish
- Long-Term: Bullish
Conclusion
HTF structure remains aligned to the upside on the yearly grids and broad benchmark stacks, with ES, NQ, YM, EMD, RTY, and FDAX all holding constructive long-term profiles. Weekly price is extended or consolidating near upper-year structure in ES, YM, EMD, and FDAX, while NQ and RTY show sharper short-cycle pullback pressure with WSFG/MSFG below center. Daily structures are more mixed: ES remains above all daily benchmarks, NQ and RTY are corrective below weekly/monthly midlines, YM is consolidating below short-term averages, EMD is rotational beneath the 20D, and FDAX is recovering but below key short-term references. Directional correlations remain strongest on the long-term trend base, while short-term session fib grids and recent swing pivots show rotation, retracement, and localized resistance/support tests across the index set.
Note: Intra-day counter-trend pullbacks or retracements may occur, HTF is context for informational usage and market structure. Glossary: Session Fib Grids periods of YSFG:’Yearly’, MSFG:’Monthly’, WSFG:’Weekly’
For full details visit: AlphaWebTrader Technicals
ES Daily View
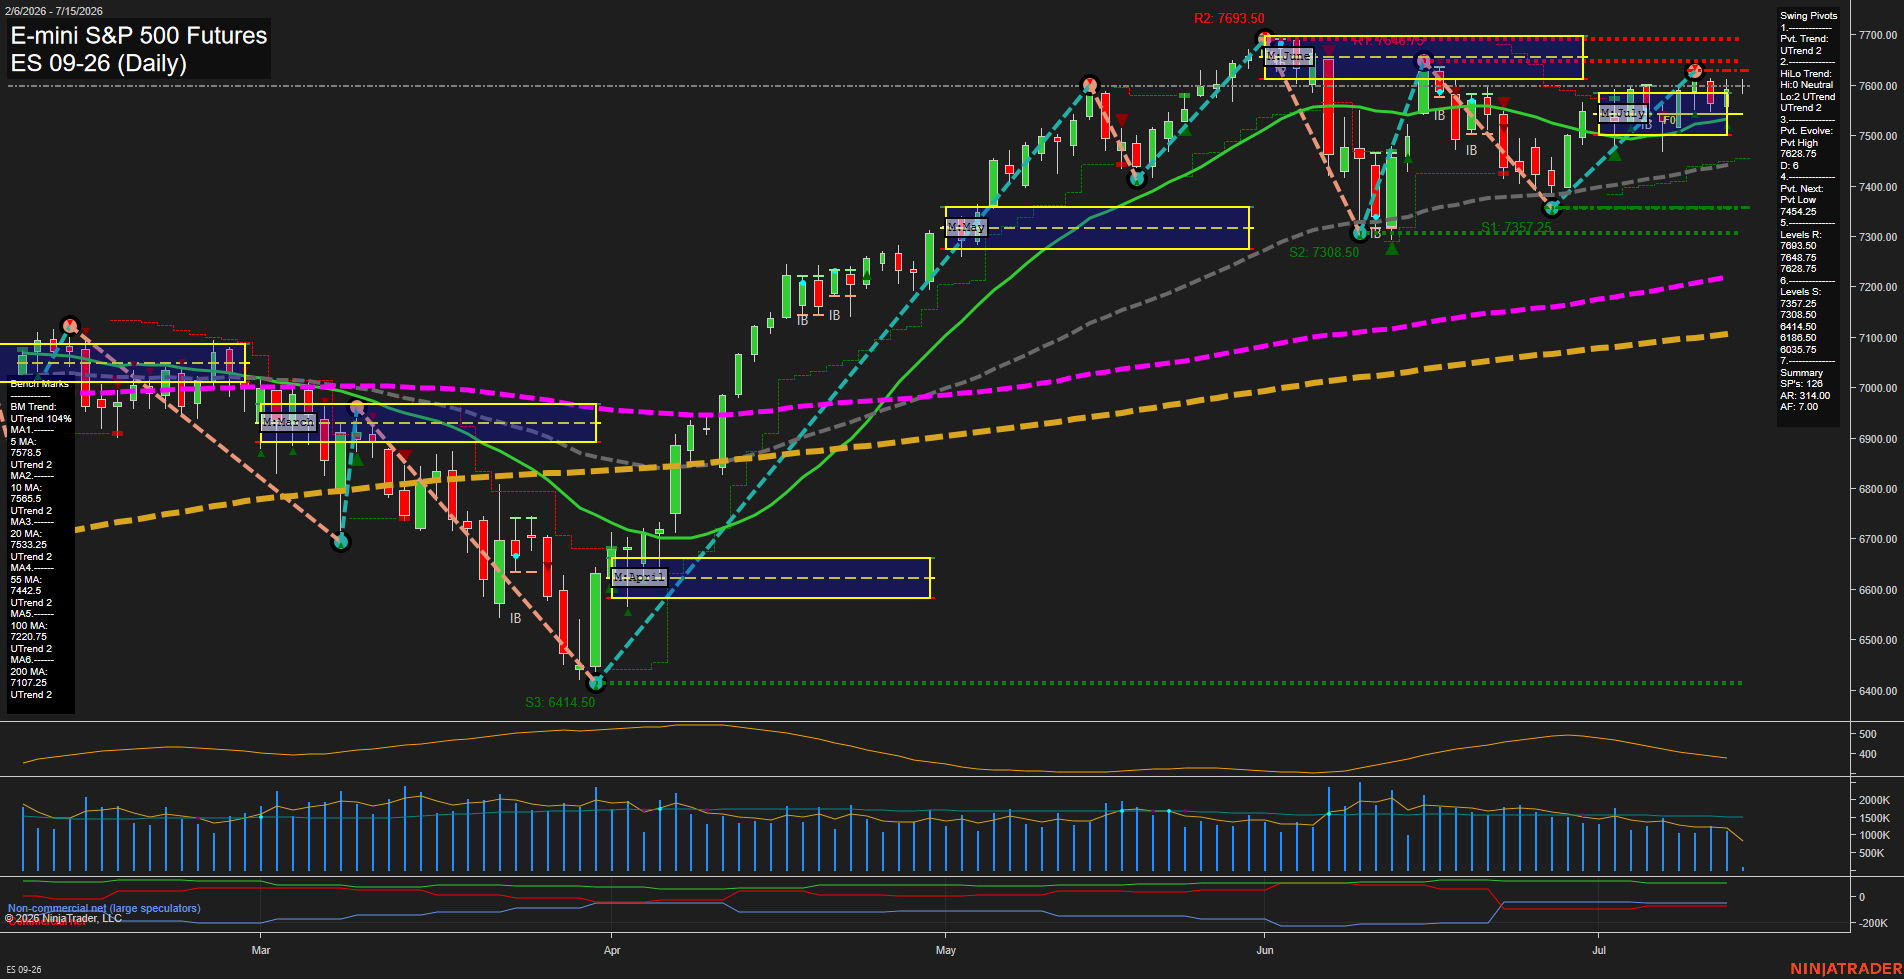
Overall Rating
- Short-Term: Bullish
- Intermediate-Term: Bullish
- Long-Term: Bullish.
Key Insights Summary
Price is holding above the 5, 10, 20, 55, 100, and 200 day benchmarks, which keeps the broader daily structure firmly positive. The pivot sequence remains in an uptrend, with price trading near the upper part of the recent range after a strong recovery from the early-June pullback and the July test of support. Weekly structure is still below the weekly F0%/NTZ midpoint and trends down, so the shorter-cycle backdrop is mixed versus the stronger monthly and yearly posture. The daily tape shows a constructive advance with medium-sized bars and average momentum, while nearby resistance sits at 7628.75, 7648.75, and 7693.50; support is layered at 7545.25, 7357.25, and 7308.50. Recent signals show renewed long bias on the monthly and TR120 measures after the prior weekly short signal, reflecting a transition from the July dip back into the larger uptrend.
View charts on: AlphaWebTrader HTF Charts
NQ Daily View
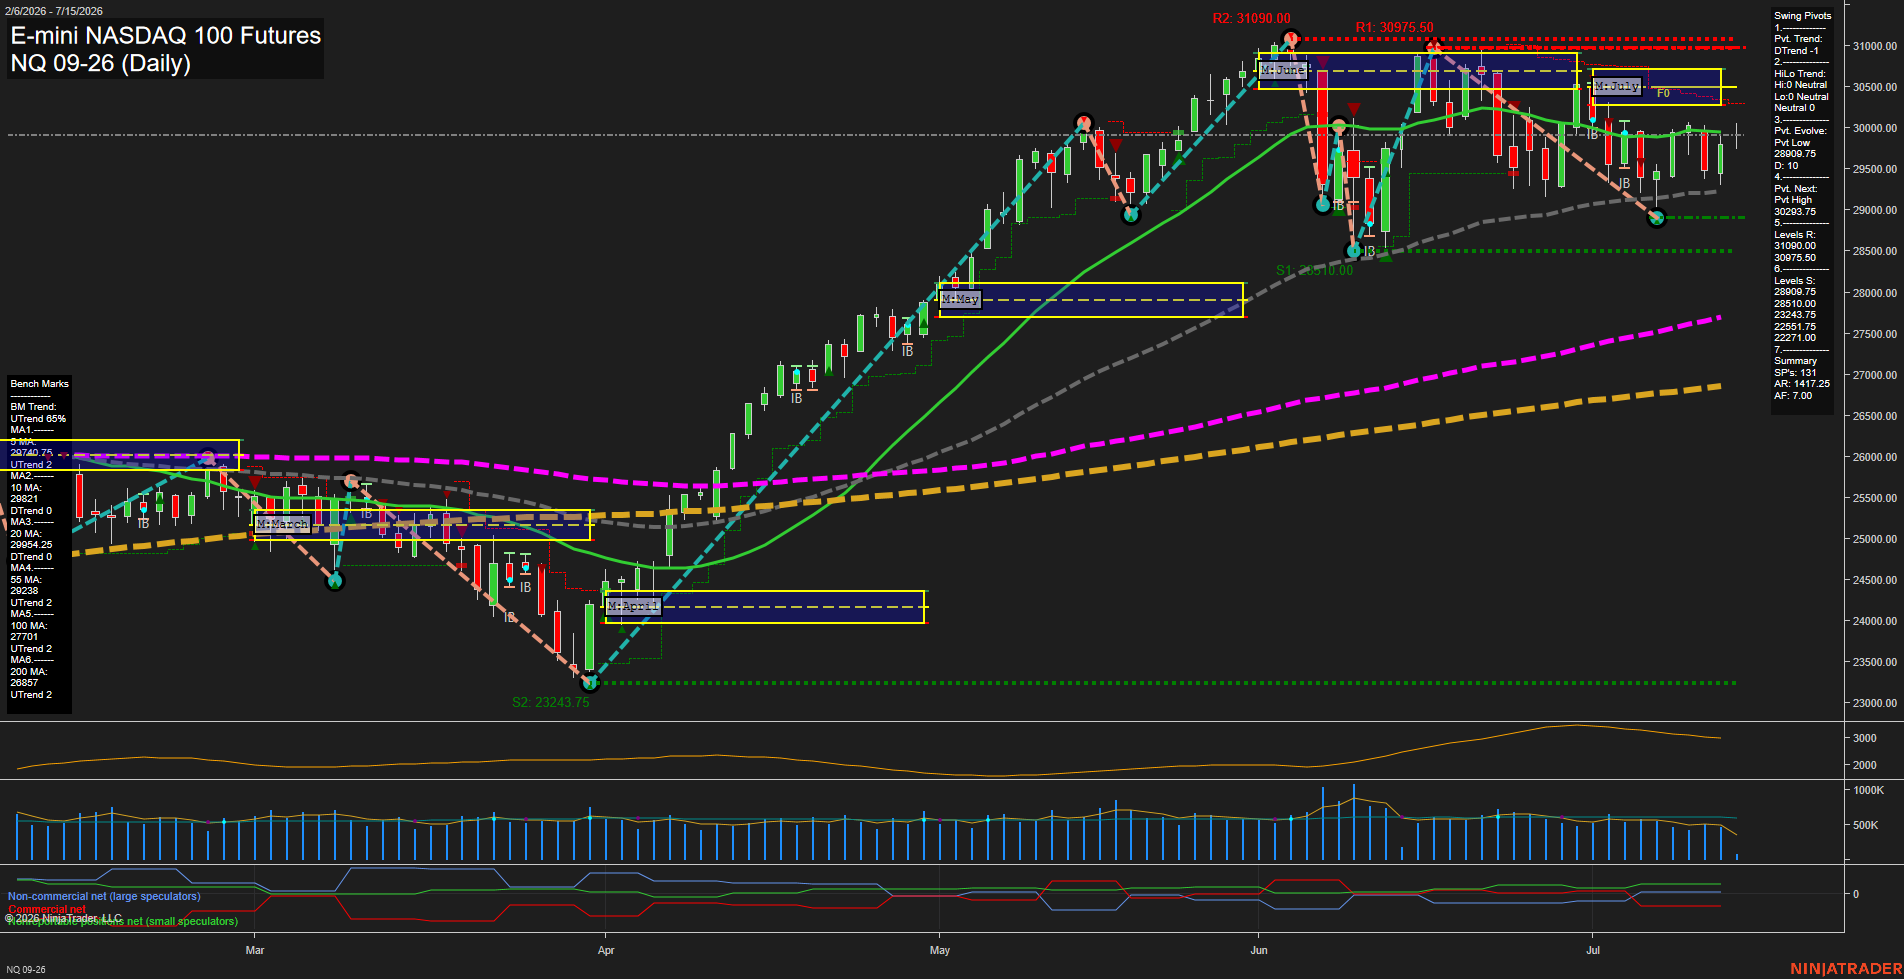
Overall Rating
- Short-Term: Bearish
- Intermediate-Term: Bearish
- Long-Term: Bullish.
Key Insights Summary
Price is trading below both the weekly and monthly session fib zero lines, which keeps the short- and intermediate-term structure tilted lower despite the longer-term 2026 yearly profile remaining firmly above its midpoint. The swing pivot model is in a down phase with a lower pivot evolve and the next opposite pivot defined higher at 30293.75, while nearby resistance remains stacked overhead at 30975.50 and 31090.00. Benchmark alignment is mixed but still corrective in the nearer time frames, with the 5-day above price support behavior and the 10-day and 20-day leaning lower, while the 55-day, 100-day, and 200-day remain constructive on the broader trend. The recent sequence shows a strong advance into June, followed by a pullback and consolidation band into July, leaving the chart in a choppy, range-to-corrective posture under the upper resistance shelf.
View charts on: AlphaWebTrader HTF Charts
CL Daily View
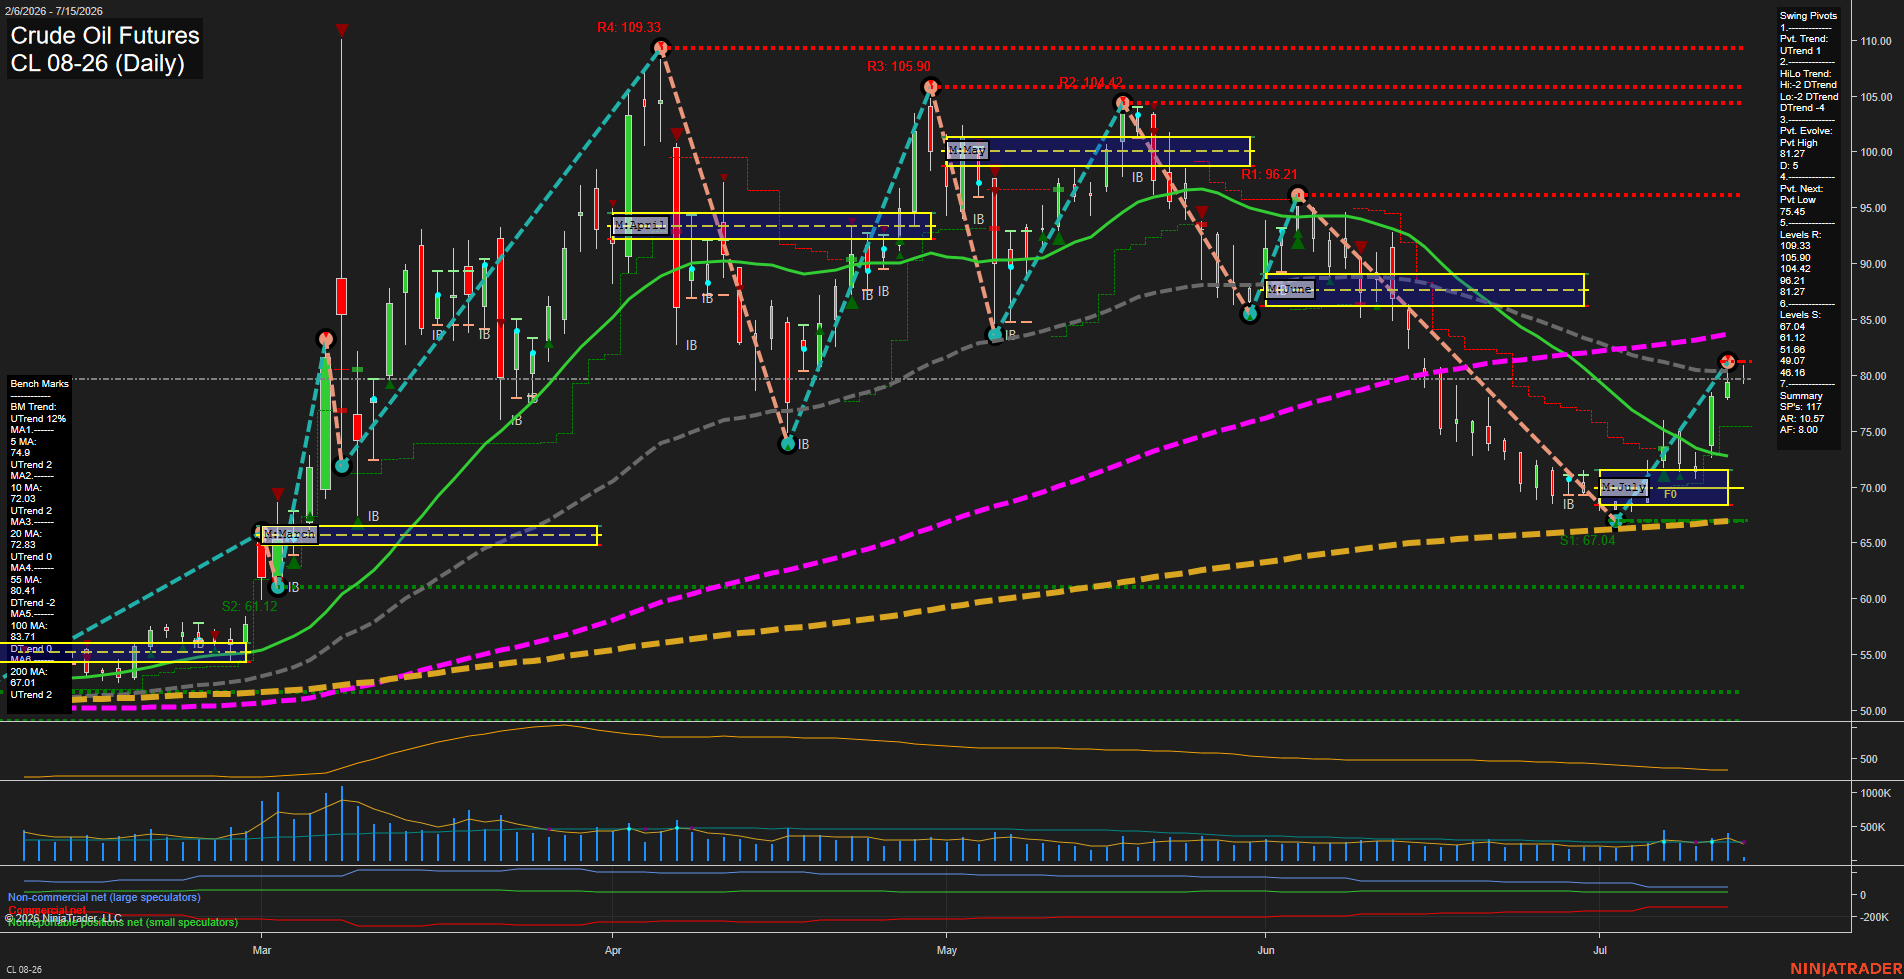
Overall Rating
- Short-Term: Bullish
- Intermediate-Term: Bullish
- Long-Term: Bullish.
Key Insights Summary
Crude oil remains in a constructive recovery phase after the early-July pullback, with price reclaiming the 75-area and pressing back toward the 79-80 zone. The short-term swing structure is aligned bullish, while the intermediate HiLo trend still reflects a broader downtrend backdrop, showing that the market is transitioning rather than fully escaping the prior decline. Price is above the weekly, monthly, and yearly F0%/NTZ reference zones, reinforcing a positive grid bias across all higher timeframes. The daily benchmark set is mixed but supportive overall: the 5, 10, and 20-day averages are rising, while the 55-day remains a nearby overhead pressure point. Recent long signals from WSFG, MSFG, and TR120 confirm improving momentum, and the current market profile resembles a rebound leg within a larger rotational structure.
View charts on: AlphaWebTrader HTF Charts
GC Daily View
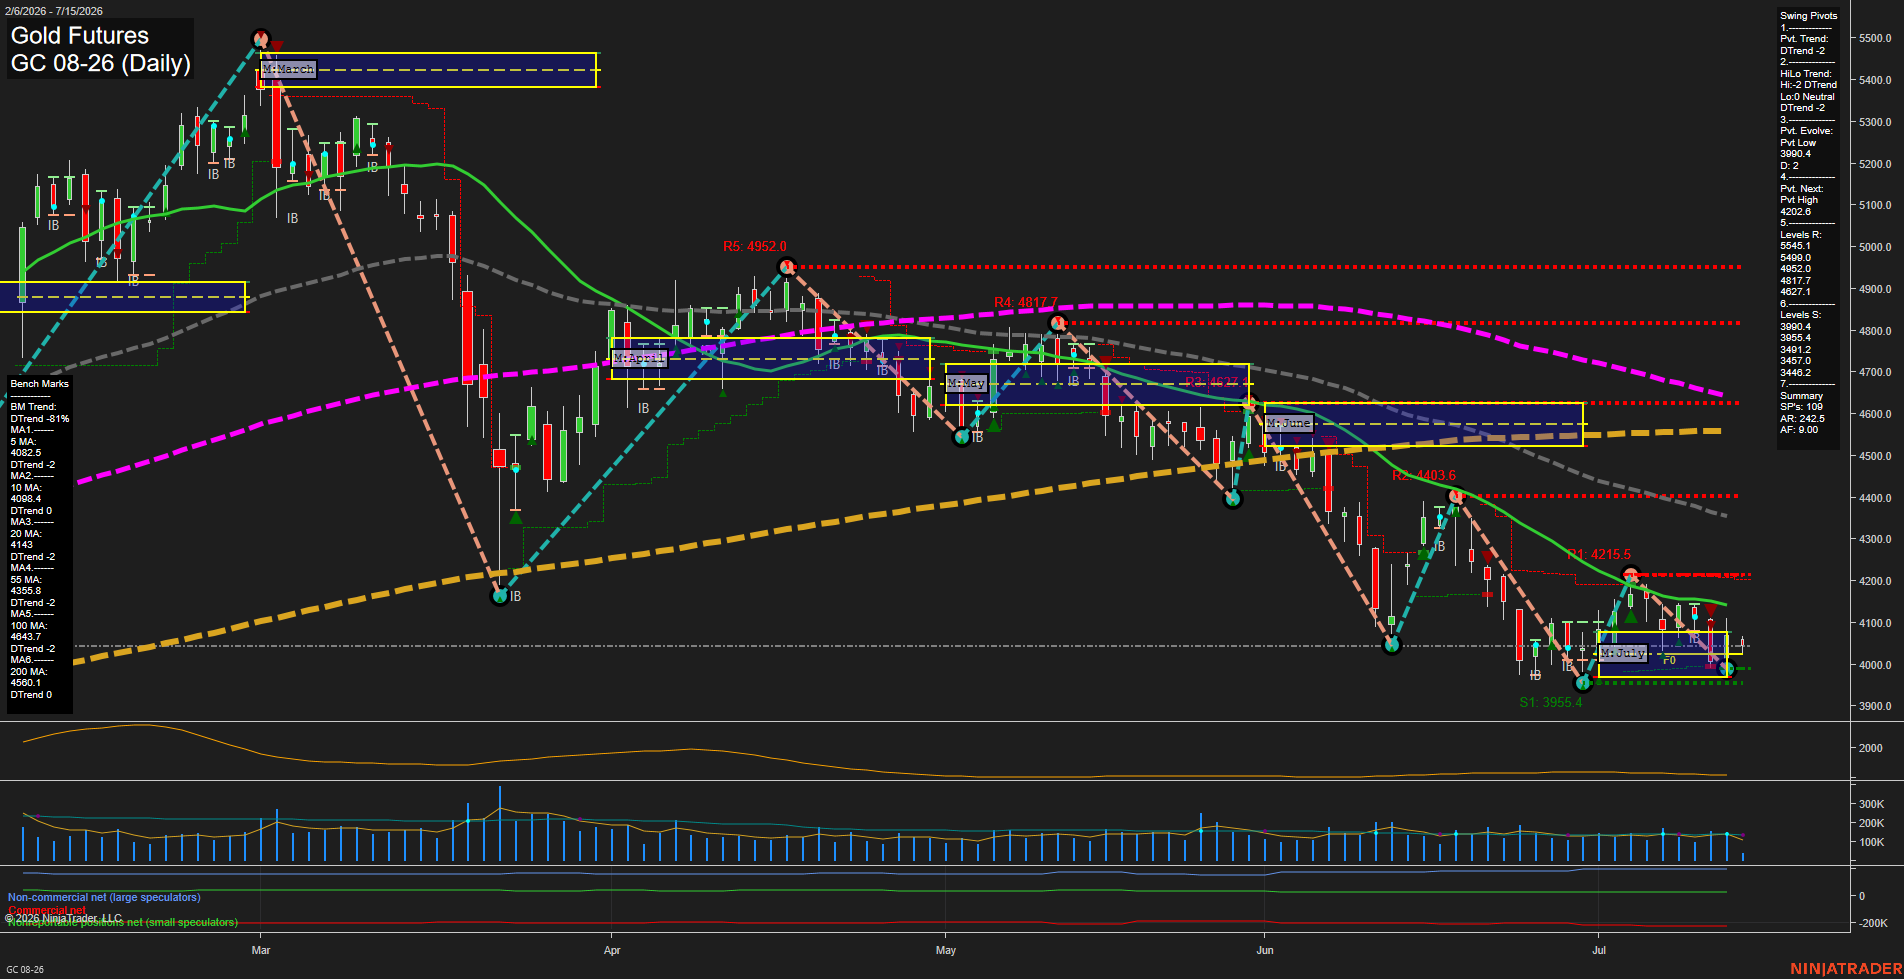
Overall Rating
- Short-Term: Bearish
- Intermediate-Term: Bearish
- Long-Term: Bearish.
Key Insights Summary
Gold futures are trading deep below the main benchmark moving-average stack, with the 5, 10, 20, 55, 100, and 200 day measures all sloping down and positioned overhead, confirming persistent downside structure. The daily swing pivot model is in DTrend, with the next pivot marked as a pivot high, while price remains pinned near the lower July session fib zone after a sharp selloff and bounce attempts. Weekly fib structure is below the NTZ midpoint, monthly structure remains slightly above its midpoint bias, and the yearly framework is still negative, reflecting a broader bearish backdrop despite short countertrend rebounds. Recent trade signals show alternating short-term reversal activity, but the dominant chart pattern is a lower-high, lower-low sequence with repeated rejection near prior resistance shelves and a late-month breakdown into the 3900-4050 area.
View charts on: AlphaWebTrader HTF Charts