
U.S. stocks fell as Strait of Hormuz tensions drove oil higher, rate fears rose, and AI and chip shares sold off, pressuring risk assets.
Fundamentals: U.S. index futures and equities came under pressure as renewed Strait of Hormuz disruption pushed oil sharply higher and revived inflation and rate concerns. A selloff in AI and chip stocks added to the risk-off tone, while investors also tracked bank earnings, Treasury yields, and the impact of geopolitical tensions on energy supply.
Technicals: The latest market roundup shows mixed action across ETFs and futures, with energy and mega-cap names posting gains while several high-profile tech and crypto-linked stocks weakened. Index analysis across ES, NQ, YM, RTY, FDAX, and EMD points to a divided setup: longer-term trends remain mostly constructive, but several daily and weekly structures show short-term pullbacks, resistance tests, and choppy consolidation near recent highs.
After Market Close daily snapshot: market news summary and sentiment, major ETFs, Magnificent 7 analysis, Indices Futures Higher Time Frame Analysis, and E-mini S&P500, Nasdaq 100, NYMEX Crude, Gold Futures Daily Chart analysis.
As of: July 13, 2026 05:00 CT
Market News Summary:
U.S. index futures face pressure from a sharp oil rally, renewed Strait of Hormuz disruption, and a selloff in AI and chip stocks.
Primary Drivers & Risks:
- Primary Driver: Strait of Hormuz tensions
- Primary Risk: Higher oil and rate fears
Tone:
Risk-off, with energy and geopolitics outweighing earnings optimism.
Stock Market / ETFs / Indices:
Stocks fell amid an AI and chip selloff, with Nasdaq weakness tied to SK hynix’s U.S. debut and broader doubts about the AI trade. Earnings season also sits in focus, with banks starting results and investors watching whether strong profit growth supports S&P 500 sentiment.
Geopolitical:
President Trump’s renewed blockade and the closure of the Strait of Hormuz lifted geopolitical risk and unsettled markets. U.S.-Iran tensions and fresh attacks added to uncertainty around global supply routes and broader market stability.
Oil / Energy:
Oil surged on the Strait of Hormuz disruption and renewed U.S. action against Iran, with prices near $80 a barrel and a 9% jump mentioned in coverage. Concerns centered on supply security, inflation, and stress on the U.S. economy as the strategic reserve draws attention.
Gold / Metals:
Gold and silver fell as traders priced in higher rate risk and a firmer dollar, despite the conflict backdrop. Gold slipped below $4,000 and the safe-haven bid weakened as oil and rate expectations rose together.
Fed / Financials:
Two-year Treasury yields rose and Fed rate hike talk intensified after comments from Fed officials and a hotter inflation backdrop tied to the Iran conflict. Banks begin earnings with expectations for profit growth, dealmaking strength, and pressure from lending margins and credit provisions.
Macro / Other:
Analysts highlighted high Q2 earnings expectations for the S&P 500, along with tariff rebates and war-related uncertainty. Strategic Petroleum Reserve weakness and equipment issues added another macro layer to the energy shock narrative.
Conclusion:
Primary pressure comes from the renewed Strait of Hormuz disruption, which pushed oil sharply higher and lifted inflation concerns. At the same time, AI and chip weakness weighed on indices, reinforcing a broad risk-off tone.
Secondary drivers include higher Treasury yields, firmer Fed tightening talk, and mixed earnings-season positioning. Gold’s decline, reserve concerns, and ETF/index reshuffling add cross-currents, but the dominant market inputs remain geopolitics and energy.
Market News Sentiment
Market News Articles: 46
- Neutral: 63.04%
- Negative: 19.57%
- Positive: 17.39%
Sentiment Summary: Across 46 market news articles, sentiment was mostly neutral at 63%, with negative at 20% and positive at 17%.
Conclusion: The news flow shows a neutral-heavy balance with limited directional sentiment.
GLD,Gold Articles: 14
- Negative: 50.00%
- Positive: 35.71%
- Neutral: 14.29%
Sentiment Summary: GLD/Gold articles are mixed with a slightly negative tone: 50% negative, 36% positive, and 14% neutral.
Conclusion: The sentiment profile is tilted negative, with negative coverage exceeding positive coverage by 14 percentage points.
USO,Oil Articles: 18
- Neutral: 38.89%
- Negative: 33.33%
- Positive: 27.78%
Sentiment Summary: Oil-related news is mixed, with neutral coverage at 39%, negative at 33%, and positive at 28% across 18 articles.
Conclusion: The news flow shows no clear directional bias, with neutral sentiment slightly leading and negative coverage above positive coverage.
Market Data Snapshot
ETF Snapshot of major stock market ETFs, Mag7, and others as of: July 13, 2026 05:00
Top Movers & Losers
- USO 117.79 Bullish 8.36% ▲
- MSFT 390.99 Bullish 1.53% ▲
- AMZN 247.31 Bullish 0.80% ▲
- IBIT 35.22 Bearish -2.79% ▼
- TSLA 394.76 Bearish -3.19% ▼
- NVDA 203.53 Bearish -3.52% ▼
Major Index ETFs: SPY, QQQ, DIA, IWM, IJH
- DIA 524.47 Bearish -0.25% ▼
- IJH 75.24 Bearish -0.57% ▼
- SPY 749.17 Bearish -0.77% ▼
- IWM 293.48 Bearish -0.85% ▼
- QQQ 711.74 Bearish -1.90% ▼
Mixed to Bearish across the index ETF complex, with all moves negative: DIA was the least negative mover at -0.25%, while QQQ was the most bearish mover at -1.90%. SPY declined -0.77%, IWM fell -0.85%, and IJH was down -0.57%.
Mag 7 Stocks: AAPL, MSFT, GOOG, AMZN, META, NVDA, TSLA
- MSFT 390.99 Bullish 1.53% ▲
- AMZN 247.31 Bullish 0.80% ▲
- AAPL 317.31 Bullish 0.63% ▲
- GOOG 350.67 Bearish -1.23% ▼
- META 656.73 Bearish -1.86% ▼
- TSLA 394.76 Bearish -3.19% ▼
- NVDA 203.53 Bearish -3.52% ▼
Mag7 snapshot is Mixed: MSFT led the group with +1.53%, followed by AMZN at +0.80% and AAPL at +0.63%, while GOOG slipped -1.23%, META -1.86%, TSLA -3.19%, and NVDA posted the most bearish move at -3.52%.
Cross-Market ETFs: TLT, GLD, USO, IBIT
- USO 117.79 Bullish 8.36% ▲
- TLT 83.97 Bearish -0.59% ▼
- GLD 367.13 Bearish -2.62% ▼
- IBIT 35.22 Bearish -2.79% ▼
Mixed cross-market tone: USO was the most bullish mover at +8.36%, while IBIT was the most bearish mover at -2.79%. GLD also fell -2.62%, and TLT was near-flat to mildly negative at -0.59%.
ETF, Mag7, and Cross-Market ETF Insights
Overall Tone
Mixed to Risk Off: equities were broadly under pressure while USO stood out with a strong gain of +8.36%, signaling selective strength rather than broad risk-on alignment.
Equity ETFs and Mag7:
Major index ETFs were mostly red, led by QQQ at -1.90% and IWM at -0.85%, while DIA was the least negative at -0.25%. Mag7 was selective: MSFT and AMZN held positive at +1.53% and +0.80%, but NVDA was the most bearish mover at -3.52% and TSLA also fell sharply at -3.19%. Overall, equities were not broadly aligned, with a narrow leadership gap between resilient large caps and weaker growth/semis.
Cross-Market ETFs:
Cross-market action was mixed, with USO surging to the strongest move in the snapshot at +8.36% while TLT eased to -0.59%. GLD and IBIT both moved lower at -2.62% and -2.79%, showing weakness in hedging and alternative risk proxies alongside equities. The overall cross-market read is divergence: energy strength against softer bonds, gold, and bitcoin.
Futures Indices – Higher Time Frame Analysis
Summary of the current state of US Indices Futures based on higher time-frame (HTF) technical analysis as of: 2026-07-13: 17:00 CT.
US Indices Futures
- ES YSFG/MSFG bullish above F0% and NTZ, WSFG below F0% with neutral short-term tone, benchmarks 20/55/100/200 rising, pivots hold UTrend, resistance 7689.50, pullback under recent high.
- NQ YSFG bullish, MSFG and WSFG below F0% with bearish short/intermediate tone, price under 5/10 day benchmarks but above 55/100/200, pivots in corrective phase, resistance 31090, supports 30376.25, 28909.75, 28510.00.
- YM YSFG/MSFG bullish, WSFG neutral, short-term pivot DTrend after pullback from 53656, benchmarks 20/55/100/200 rising and price above them, supports 52343, 50136, 48986, larger trend remains up.
- EMD YSFG bullish, MSFG still below F0% and bearish, WSFG bullish, benchmarks stacked higher across 5/10/20/55/100/200, pivots UTrend with fresh long signal, resistance at upper band, support around upper 3680s and mid-3600s.
- RTY YSFG bullish above F0%/NTZ, MSFG bearish below F0%, WSFG bullish, benchmarks 20/55/100/200 rising with 5/10 rolling lower, pivots UTrend at 3068.4, supports 2943.4 and 2829.4, recovery toward 3000 zone.
- FDAX YSFG/MSFG/WSFG bullish above midlines, benchmarks 55/100/200 rising with price above them, short-term DTrend after rejection from 26064, supports 24892, 24130, 23827, 22777, larger trend remains constructive.
Overall State
- Short-Term: Neutral
- Intermediate-Term: Neutral
- Long-Term: Bullish
Conclusion
US indices futures remain aligned with a bullish long-term HTF backdrop, led by YSFG structure that is constructive across ES, YM, EMD, RTY, and FDAX, while NQ remains the main short/intermediate lagging instrument. MSFG is broadly supportive in ES, YM, and FDAX, but remains bearish in NQ, EMD, and RTY, reflecting mixed intermediate rotation. WSFG is strongest in EMD, RTY, and FDAX, while ES is neutral and NQ is below F0%, keeping the short-term composite mixed. Benchmark moving averages are generally rising and stacked constructively across the complex, with repeated resistance tests at recent swing highs and nearby pivot zones defining the current HTF range structure.
Note: Intra-day counter-trend pullbacks or retracements may occur, HTF is context for informational usage and market structure. Glossary: Session Fib Grids periods of YSFG:’Yearly’, MSFG:’Monthly’, WSFG:’Weekly’
For full details visit: AlphaWebTrader Technicals
ES Daily View
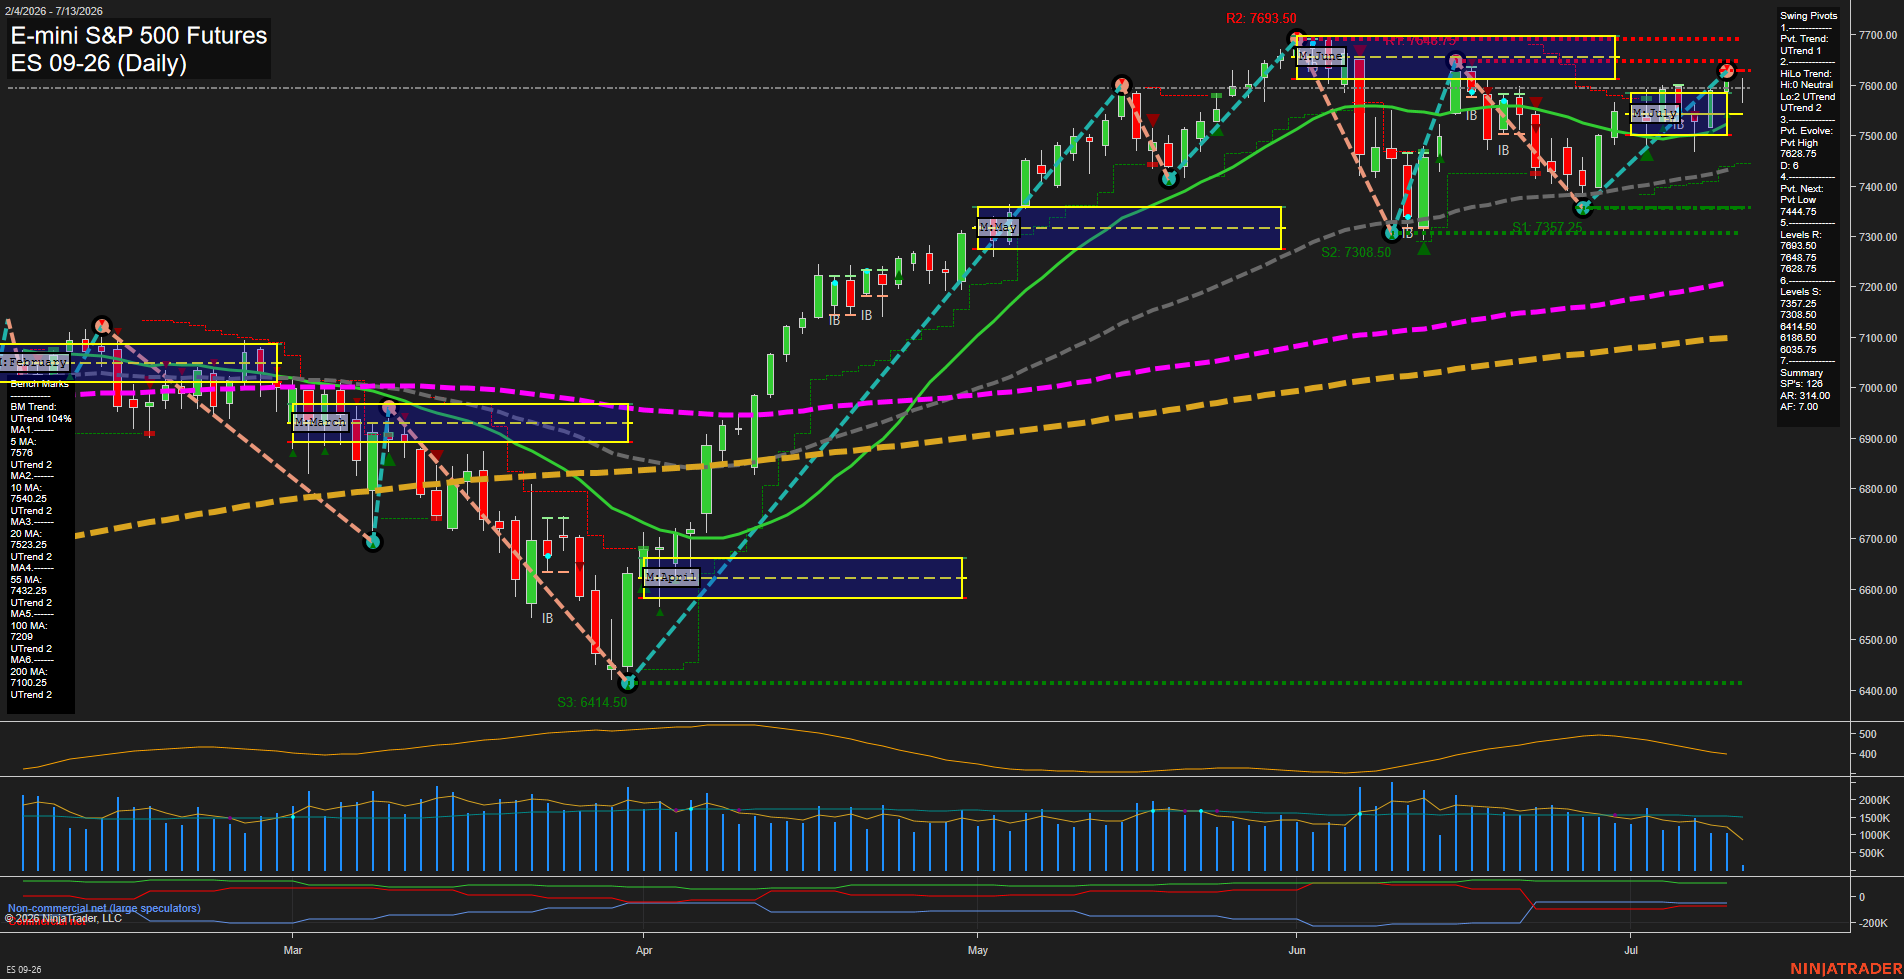
Overall Rating
- Short-Term: Neutral
- Intermediate-Term: Bullish
- Long-Term: Bullish.
Key Insights Summary
ES remains in a broader uptrend with all major benchmarks stacked positively and price still holding above the 20, 55, 100, and 200 day averages. The daily structure shows a recent push to fresh highs followed by a pullback from the upper pivot zone, leaving a more tactical two-way tone near the top of the range. Weekly fib structure is still below its F0%/NTZ centerline, which keeps the short-term backdrop mixed to neutral, while the monthly and yearly fib grids remain constructive and supportive of the larger bullish cycle. Swing pivot structure is still aligned upward, but the latest action reflects a test-and-rejection pattern near resistance, with price consolidating under the recent high and trading between nearby pivot resistance and the rising benchmark cluster.
View charts on: AlphaWebTrader HTF Charts
NQ Daily View
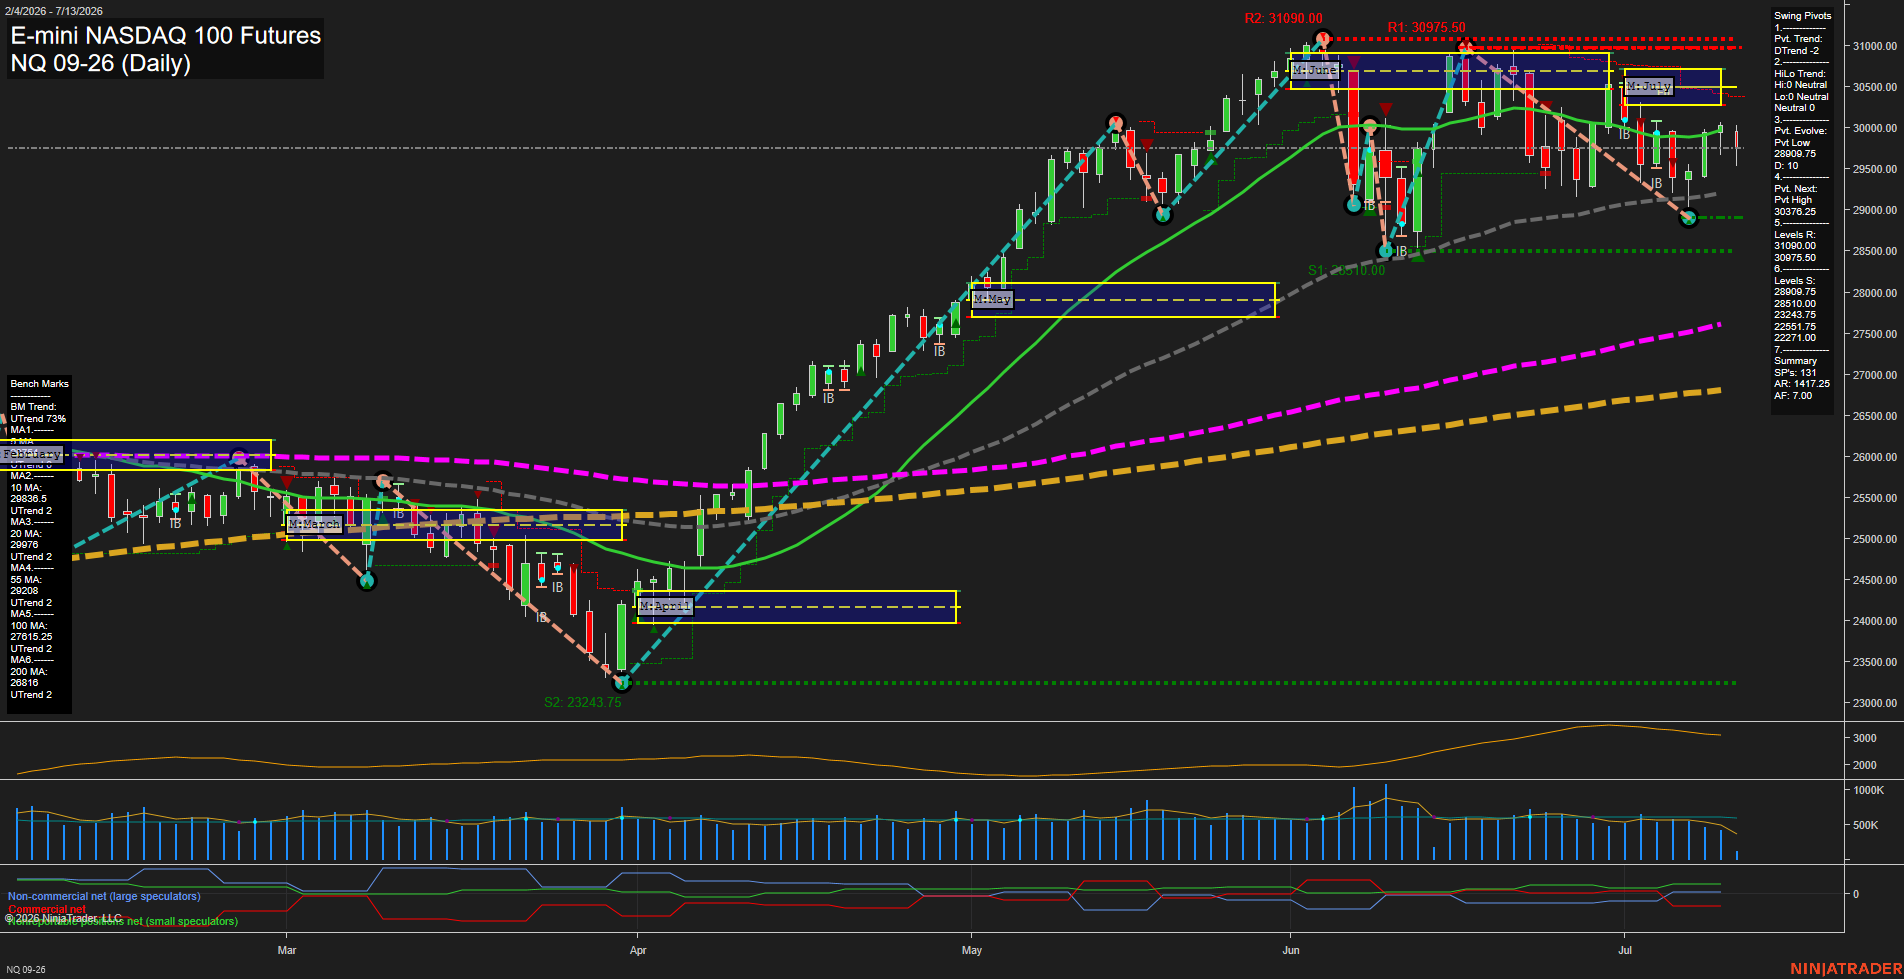
Overall Rating
- Short-Term: Bearish
- Intermediate-Term: Bearish
- Long-Term: Bullish.
Key Insights Summary
Price is trading below the weekly and monthly F0%/NTZ zones, keeping the short and intermediate structure under pressure even though the broader yearly frame remains constructive. The pivot state is in DTrend with the next reversal marker still higher at the prior pivot-high zone near 30376.25, while support layers remain clustered below at 28909.75 and 28510.00. Daily benchmarks are mixed but still lean trend-supportive on the higher-timeframe averages, with price holding above the 55-, 100-, and 200-day measures overall. Recent signals show the market has rotated from a long trigger into short bias again, reflecting a choppy but downward-leaning consolidation beneath the June high area and around the July box resistance.
View charts on: AlphaWebTrader HTF Charts
CL Daily View
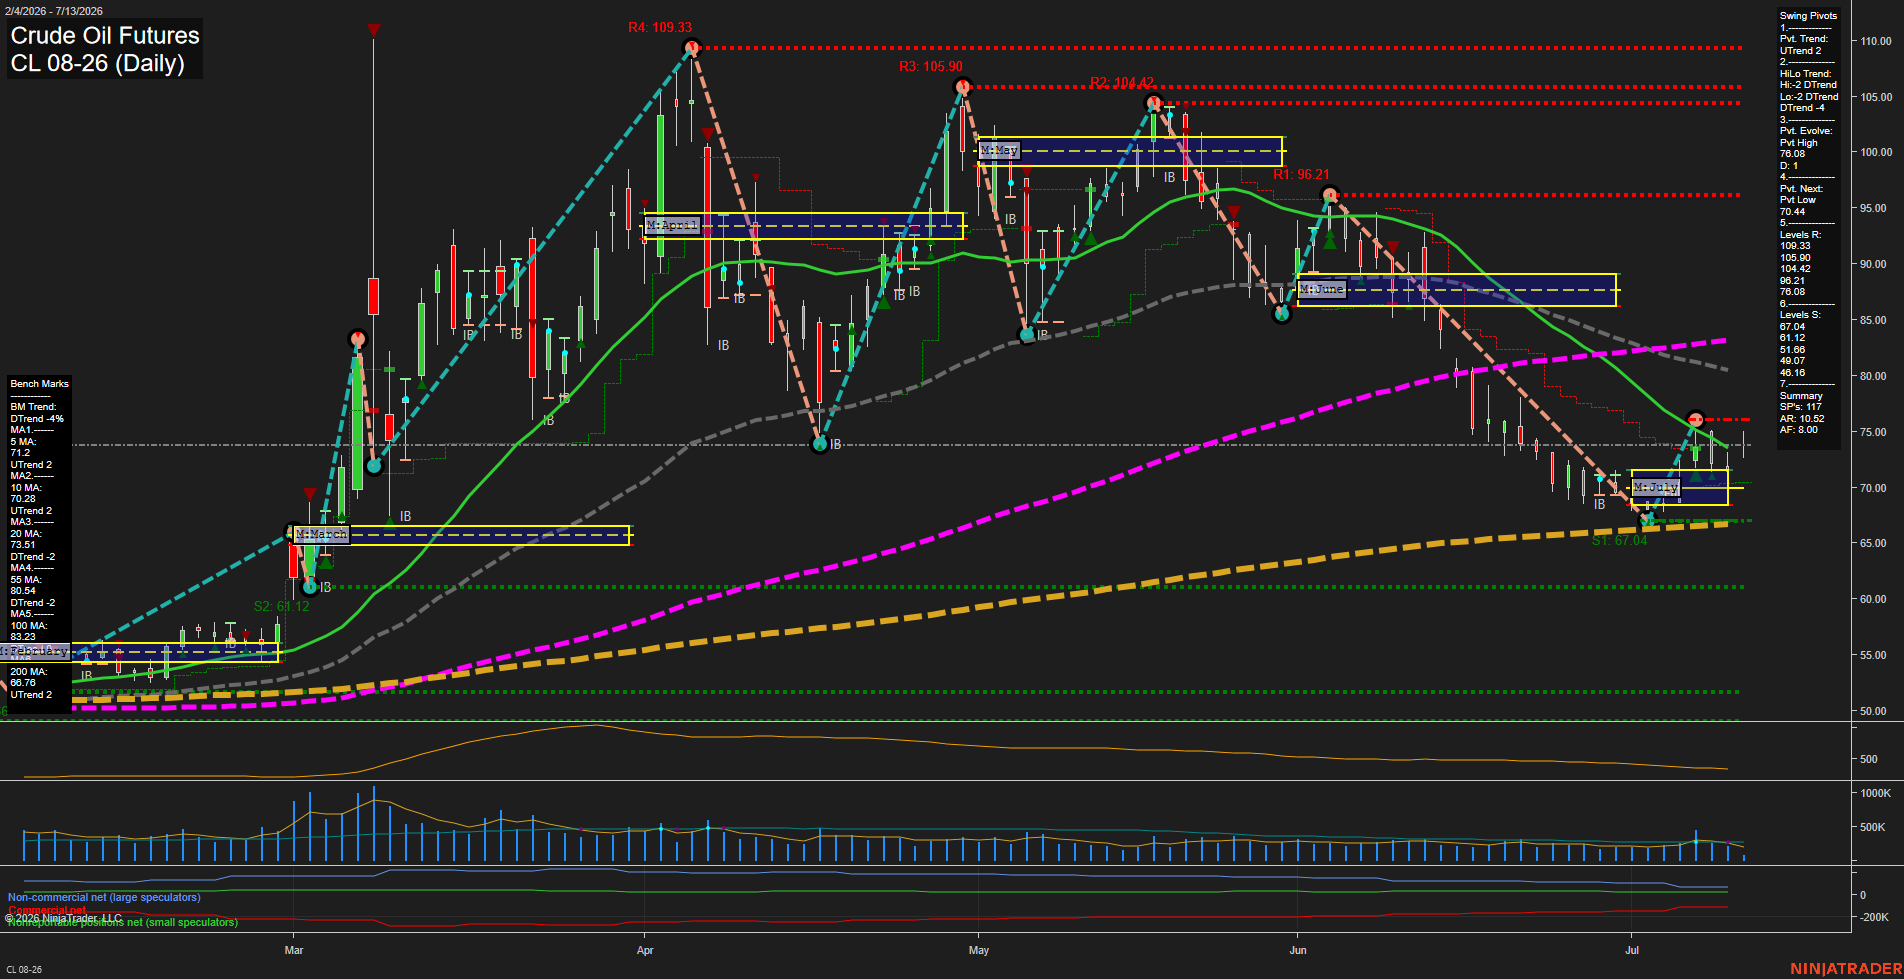
Overall Rating
- Short-Term: Bearish
- Intermediate-Term: Bearish
- Long-Term: Neutral.
Key Insights Summary
Crude oil is in a broad corrective phase after a major mid-spring peak near 109.33 and a sequence of lower highs into July. The daily structure shows price holding above the weekly and monthly session grid biases, but the benchmark moving averages are still stacked bearishly in the intermediate and long horizons, with price below the 20, 55, and 100 day averages. Swing pivot structure remains mixed to negative: the short-term pivot trend is still marked UTrend, while the HiLo trend is DTrend, reflecting a fading recovery against the dominant downslope. The most recent action has been a measured selloff with consolidation around the low-70s, leaving 76.08 as the latest pivot high and 70.44 as the next pivot low marker. Overall, the chart reads as a retracement-driven market with compressed volatility, repeated rejection from overhead resistance, and a near-term trade range centered around the low-70s after the prior breakdown from the mid-80s and 90s area.
View charts on: AlphaWebTrader HTF Charts
GC Daily View
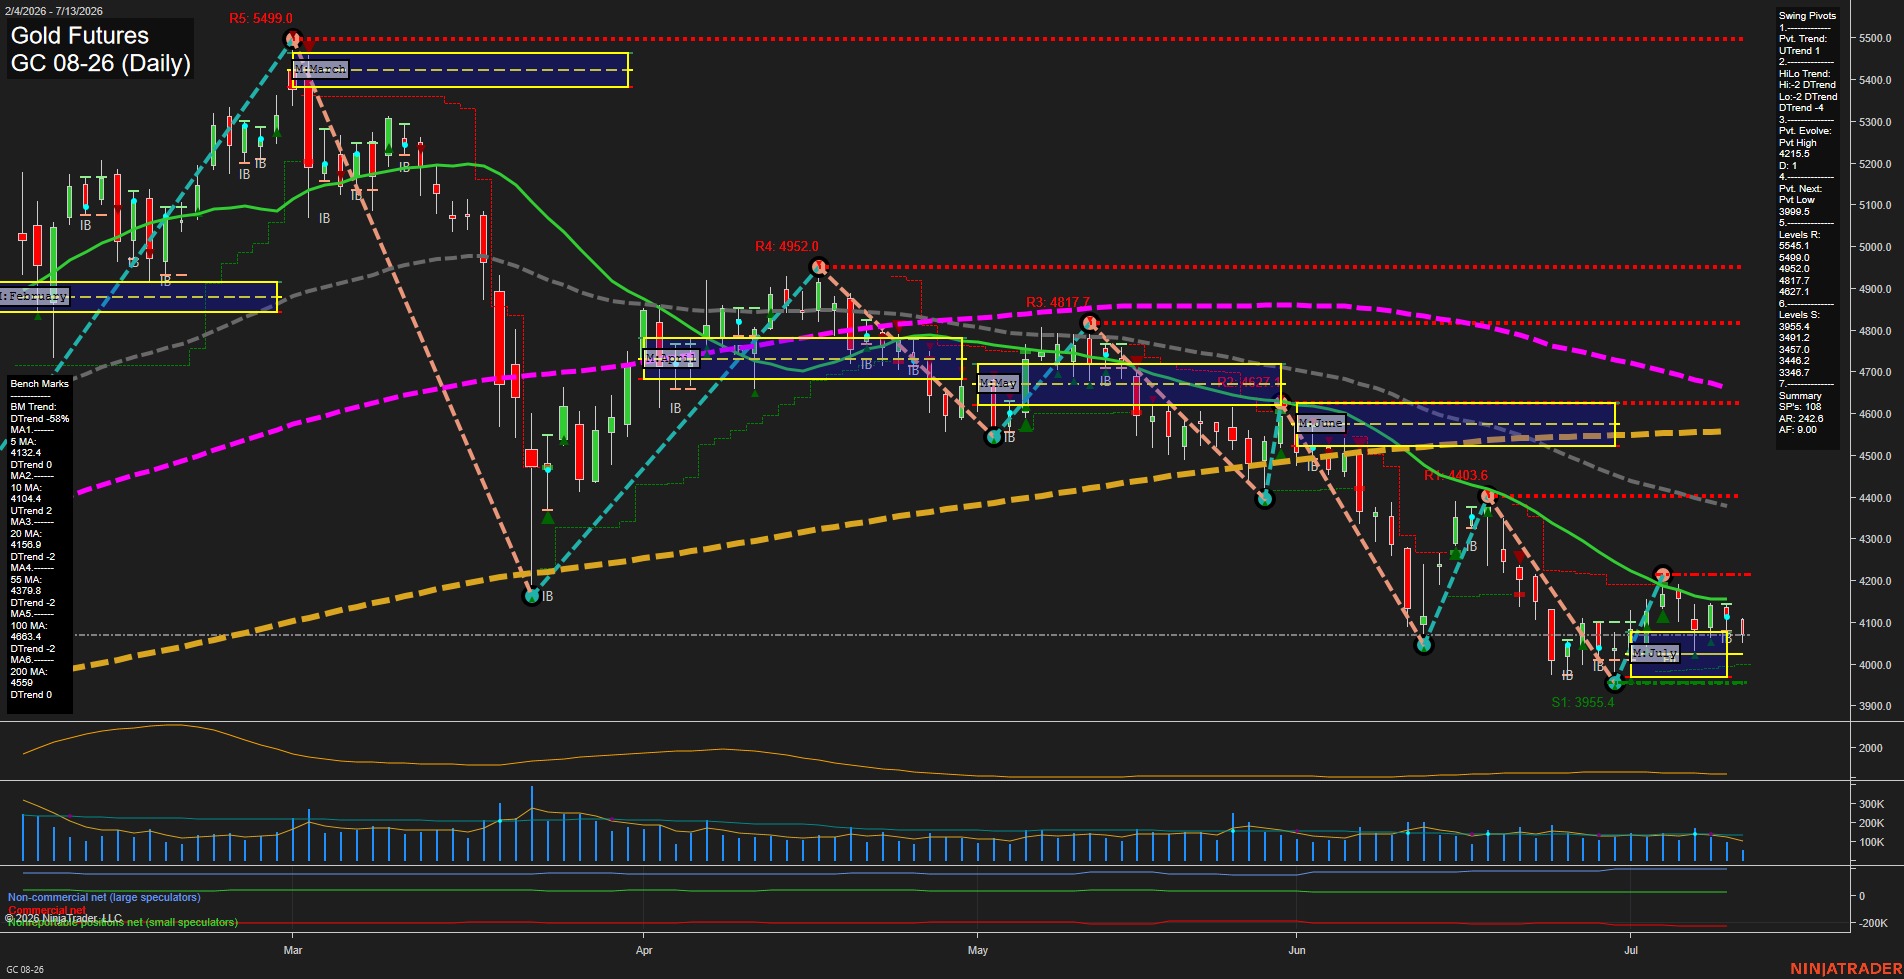
Overall Rating
- Short-Term: Bearish
- Intermediate-Term: Bearish
- Long-Term: Bearish.
Key Insights Summary
Gold futures are in a broad corrective phase with a strong June-to-July decline still defining the tape. The daily chart shows price trading below the key short- and intermediate-term benchmarks, with the swing pivot structure still in a downtrend and resistance stacked overhead near 4100-4150, then 4200-4400. The weekly fib grid remains bearish while the monthly grid still shows an offset bullish posture, creating a mixed higher-timeframe backdrop but with price action currently failing to reclaim the lost trend levels. The market is compressing near the 4000 area after a fast selloff, with visible test-and-rejection behavior and only limited recovery attempts, while the long-term year structure remains under pressure and below major moving average reference points.
View charts on: AlphaWebTrader HTF Charts