Sunday market radar covers S&P 500 and tech futures, ETF movers, index trend checks, and session notes as inflation and bank earnings shape trading.
Fundamentals: Markets start the week with inflation data, bank earnings, and Middle East shipping risks shaping index futures sentiment. The S&P 500 closed near a record high after strength in Nvidia and AMD, while early futures were softer. Traders are focused on CPI, Fed pricing, oil-driven inflation pressure, and ongoing uncertainty around the Strait of Hormuz.
Technicals: Futures and ETF data show a mixed but mostly constructive backdrop after a strong prior session in META and NVDA, while GOOG, IWM, and AMZN eased. The radar reviews weekly and daily structure for SP500, Nasdaq, Dow, Russell 2000, and key overseas indices, with bullish higher-timeframe trends in several markets and near-term pullbacks in others.
Market Week Ahead – Trading 360° view Market Radar for: holidays, earnings, eco-news, market-news summary, news sentiment, and major ETFs, MAG7, Higher Time Frame Analysis Indices Futures Summary, and ETF SPY S&P500, QQQ Tech, USO Oil, GLD Gold Weekly Chart analysis
As of: July 12, 2026 06:15 CT
Earnings Radar
Monitoring for earnings releases by the Magnificent 7, AI-tech-related firms, and major financial institutions.
- MS Release: 2026-07-15 T:BMO
- BAC Release: 2026-07-14 T:BMO
- C Release: 2026-07-14 T:BMO
- GS Release: 2026-07-14 T:BMO
- JPM Release: 2026-07-14 T:BMO
- WFC Release: 2026-07-14 T:BMO
Conclusion: The next index-relevant earnings cluster is concentrated in major banks on 2026-07-14 before the open, with JPM, GS, C, BAC, and WFC, followed by MS on 2026-07-15 before the open. This setup is a broad-market catalyst for financials and overall indices, with market momentum and volume slowing ahead of major earnings releases.
For full details visit: Yahoo Earnings Calendar
EcoNews Radar U.S. Events
| Day | Time | Impact | Event |
|---|---|---|---|
| Tue | 08:30 | High | Core CPI m/m |
| Tue | 08:30 | High | Core CPI y/y |
| Tue | 08:30 | High | CPI m/m |
| Tue | 08:30 | High | CPI y/y |
| Tue | 10:00 | High | Fed Chairman Warsh Testifies |
| Wed | 08:30 | High | Core PPI m/m |
| Wed | 08:30 | High | PPI m/m |
| Wed | 10:00 | High | Fed Chairman Warsh Testifies |
| Wed | 10:30 | Low | Crude Oil Inventories |
| Thu | 08:30 | Medium | Core Retail Sales m/m |
| Thu | 08:30 | Medium | Philly Fed Manufacturing Index |
| Thu | 08:30 | Medium | Retail Sales m/m |
| Thu | 08:30 | Medium | Unemployment Claims |
| Fri | 10:00 | Medium | Prelim UoM Consumer Sentiment |
| Fri | 10:00 | Medium | Prelim UoM Inflation Expectations |
EcoNews Summary
Tuesday carries the most market-sensitive releases, led by U.S. Core CPI and CPI data at 08:30, followed by Fed Chairman Warsh testimony at 10:00. Wednesday adds PPI data at 08:30, another Warsh testimony at 10:00, and crude oil inventories at 10:30, the only medium-impact energy-linked release in the list. Thursday and Friday bring medium-impact U.S. retail sales, unemployment claims, Philadelphia Fed manufacturing, and University of Michigan sentiment and inflation expectations, with the strongest indices reaction centered on inflation, Fed communication, and the crude inventory update.
Event Notes:
- Tuesday 08:30 – High USD Core CPI m/m: Measures monthly change in consumer prices excluding food and energy; a key inflation gauge that shapes Fed policy expectations and rate-sensitive index volatility.
- Tuesday 08:30 – High USD Core CPI y/y: Measures year-over-year core inflation; traders monitor it for the broader inflation trend and policy repricing.
- Tuesday 08:30 – High USD CPI m/m: Measures monthly change in headline consumer prices; important for inflation momentum and immediate index reactions.
- Tuesday 08:30 – High USD CPI y/y: Measures year-over-year headline inflation; closely watched for confirmation of price pressure persistence.
- Tuesday 10:00 – High USD Fed Chairman Warsh Testifies: Fed testimony introduces policy guidance and rate-path signals; remarks often move equities, yields, and the dollar.
- Wednesday 08:30 – High USD Core PPI m/m: Measures monthly change in producer prices excluding food and energy; traders use it as an upstream inflation indicator.
- Wednesday 08:30 – High USD PPI m/m: Measures monthly change in producer prices; important for inflation pipeline assessment.
- Wednesday 10:00 – High USD Fed Chairman Warsh Testifies: Another Fed communication event; testimony can reinforce or challenge market pricing after inflation data.
- Wednesday 10:30 – Low USD Crude Oil Inventories: Measures weekly change in U.S. crude stockpiles; monitored for petroleum supply balance, energy prices, and inflation-linked index sensitivity.
- Thursday 08:30 – Medium USD Core Retail Sales m/m: Measures consumer spending excluding autos; a demand gauge tied to growth momentum and inflation pressure.
- Thursday 08:30 – Medium USD Philly Fed Manufacturing Index: Surveys manufacturing activity in the Philadelphia region; used for regional growth and business-cycle tone.
- Thursday 08:30 – Medium USD Retail Sales m/m: Measures total consumer spending at retail; watched for growth strength and risk sentiment.
- Thursday 08:30 – Medium USD Unemployment Claims: Tracks new filings for jobless benefits; a weekly labor-market indicator that influences growth and policy expectations.
- Friday 10:00 – Medium USD Prelim UoM Consumer Sentiment: Measures consumer confidence; relevant for spending expectations and broader market tone.
- Friday 10:00 – Medium USD Prelim UoM Inflation Expectations: Measures consumer inflation outlook; important because expectations feed into pricing behavior and Fed sensitivity.
Conclusion:
The single most important event of the week is Tuesday 08:30 U.S. Core CPI and CPI, with Warsh testimony at 10:00 adding a secondary policy catalyst. Momentum and volume often slow ahead of major inflation and Fed events, then expand at release time; the 10:00 time cycle also acts as a frequent reversal or continuation trigger. Wednesday’s crude oil inventories matter for petroleum supply and energy-price context, which carries added significance when oil prices influence inflation concerns.
For full details visit: Forex Factory EcoNews
Market News Summary:
Markets enter the week with inflation data, bank earnings, and Middle East shipping risks shaping index futures sentiment.
Primary Drivers & Risks:
- Primary Driver: Inflation data and Fed pricing
- Primary Risk: Hormuz disruption and energy inflation
Tone:
Mixed, with a defensive bias from inflation and geopolitical pressure.
Stock Market / ETFs / Indices:
The S&P 500 ended the week near a record high, supported by a rebound in Nvidia and AMD. Perpetual futures on the index were lower in early trade, and traders are watching catalysts tied to tech, earnings, and inflation.
Geopolitical:
Strait of Hormuz headlines remain unsettled, with U.S. comments saying the route is open while Iran says it is closed. Ongoing U.S.-Iran exchanges keep shipping-route safety in focus.
Oil / Energy:
Oil-related inflation concerns lifted yields and the dollar. Separate commentary pointed to wider refining margins, elevated fuel prices, and growing non-Gulf supply limiting the longer-term crude impact of Gulf disruptions.
Gold / Metals:
Gold slipped as rising oil-driven inflation fears pushed up September Fed hike odds, Treasury yields, and the dollar. The metal faced pressure ahead of CPI data.
Fed / Financials:
Investors are focused on CPI, Fed testimony, and whether higher energy prices alter policy expectations. Bank earnings are also in view, with attention on consumer health, credit quality, margins, and trading strength.
Macro / Other:
Inflation data, retail sales, and producer prices headline the week’s macro calendar. Commentary on AI stocks and broader technology spending adds a separate equity cross-current.
Conclusion:
Inflation readings and Fed pricing remain the main drivers for index futures. Bank earnings and large-cap technology performance also shape the tone as the week begins.
Geopolitical risk around the Strait of Hormuz keeps energy and rates sensitive to headlines. Gold, equities, and futures all reflect the same cross-current: firmer inflation pressure against ongoing strength in large-cap stocks.
Market News Sentiment
Market News Articles: 11
- Neutral: 90.91%
- Negative: 9.09%
Sentiment Summary: Market news sentiment is predominantly neutral, with 91% neutral and 9% negative coverage across 11 articles.
Conclusion: The news flow shows limited directional bias and is mainly neutral in tone.
GLD,Gold Articles: 1
- Negative: 100.00%
Sentiment Summary: Gold-related news sentiment is fully negative, with 100% of the articles classified as negative.
Conclusion: The snapshot shows negative sentiment in gold coverage, which may be relevant context for indices futures day traders.
USO,Oil Articles: 3
- Neutral: 66.67%
- Negative: 33.33%
Sentiment Summary: USO oil articles are mostly neutral at 67%, with 33% negative sentiment across 3 articles.
Conclusion: The tone is neutral overall with a smaller negative component.
SPY Weekly View
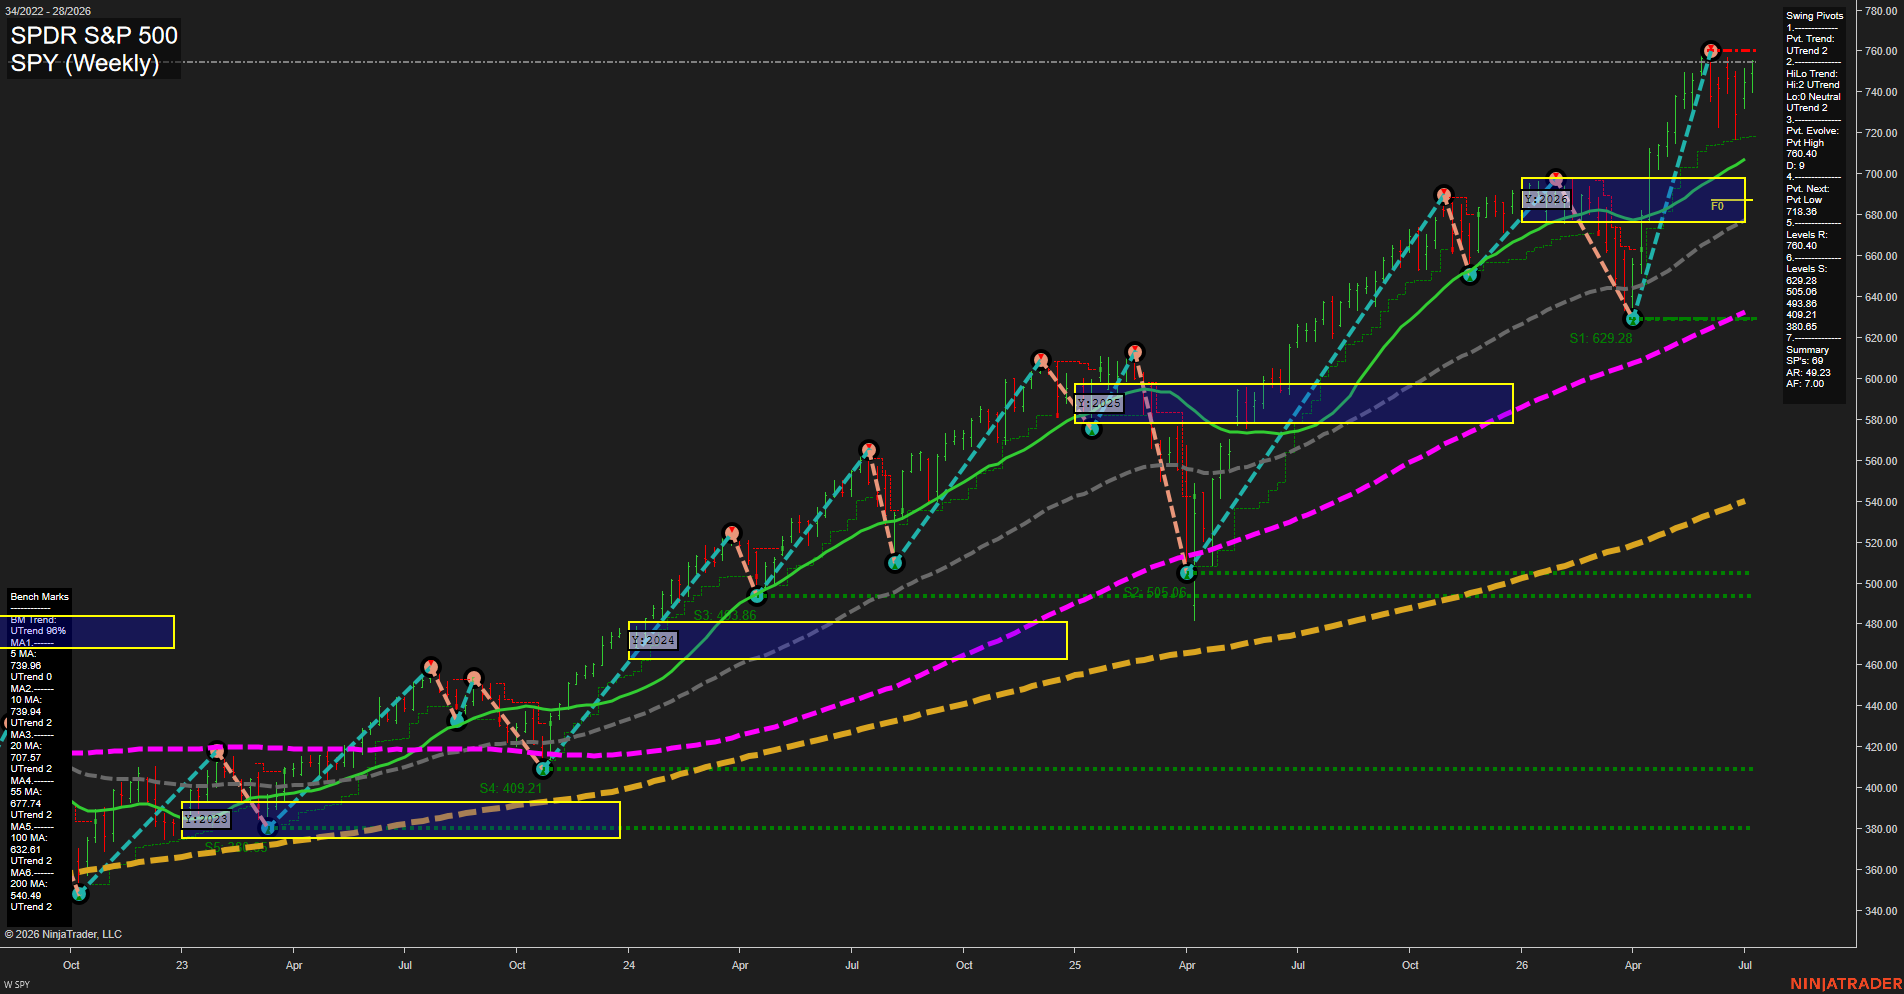
Overall Rating
- Short-Term: Bullish
- Intermediate-Term: Bullish
- Long-Term: Bullish.
Key Insights Summary
SPY remains in a dominant weekly uptrend with price pressing near the 760 area after a strong vertical expansion leg, showing fast upside momentum and large weekly bars. The pivot structure is still constructive with higher swing highs and higher swing lows, while the benchmark stack stays firmly bullish with price above all key moving averages. The current structure reflects trend continuation after a sharp rebound from the prior year’s NTZ lower band and a decisive breakout through the prior year’s range, leaving the market in a strong trend-extension phase rather than a consolidation phase. Resistance is defined by the current pivot high at 760.40, while the last meaningful swing support sits well below at 718.36, followed by deeper historical support zones near 629.28 and 505.06.
View charts on: AlphaWebTrader HTF Charts
QQQ Weekly View
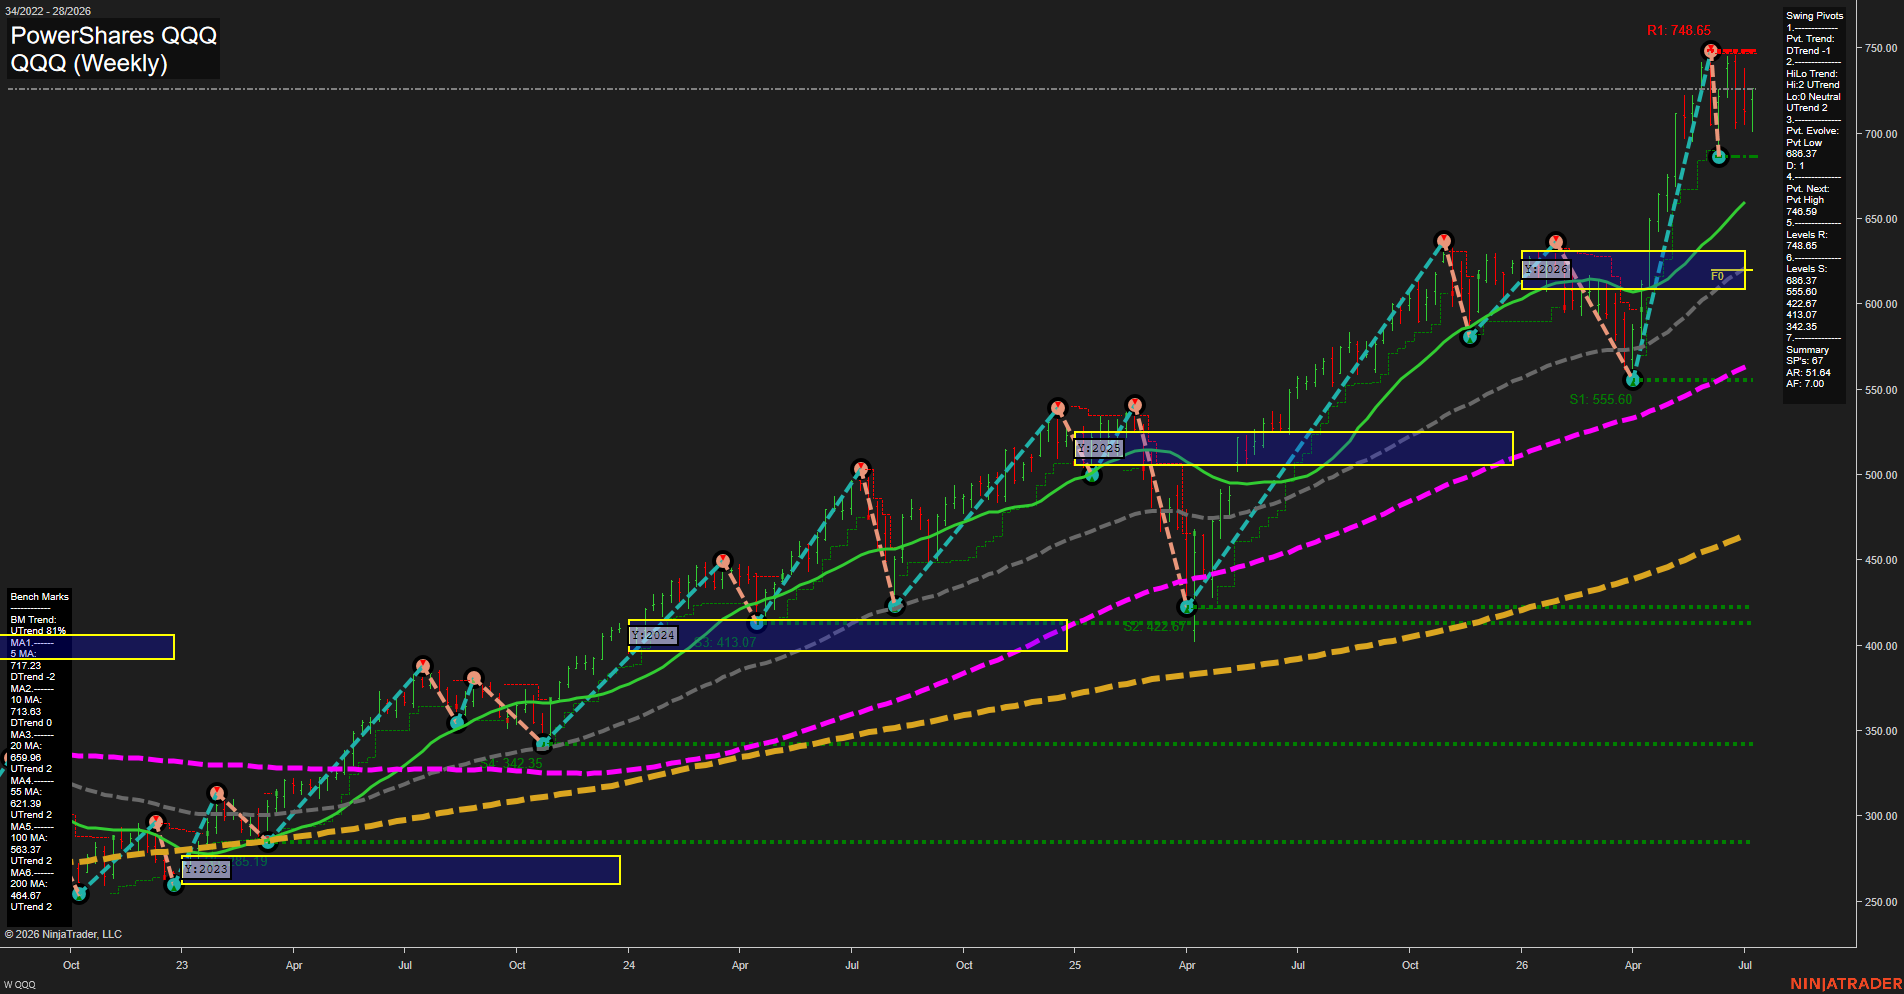
Overall Rating
- Short-Term: Neutral
- Intermediate-Term: Bullish
- Long-Term: Bullish.
Key Insights Summary
QQQ remains in a powerful weekly up-cycle with a fast momentum profile and a large-range bar structure, but the short-term pivot sequence has rolled into a DTrend after the latest push toward the highs. The broader intermediate and long-term structure stays constructive, with the 20, 55, 100, and 200 day benchmarks all trending higher and price holding well above them. The 2026 yearly session shows price operating near the upper portion of the NTZ, reflecting a strong trending regime with repeated expansion and retracement phases rather than a broad reversal. Recent action shows a sharp advance into resistance near the prior swing high area, with pivot support layered below at 686.37, then deeper historical levels at 555.60, 422.67, 413.07, and 342.35. Overall, the chart reflects a mature bullish trend with short-term swing compression near the highs and intermediate-to-long-term trend alignment still firmly positive.
View charts on: AlphaWebTrader HTF Charts
USO Weekly View
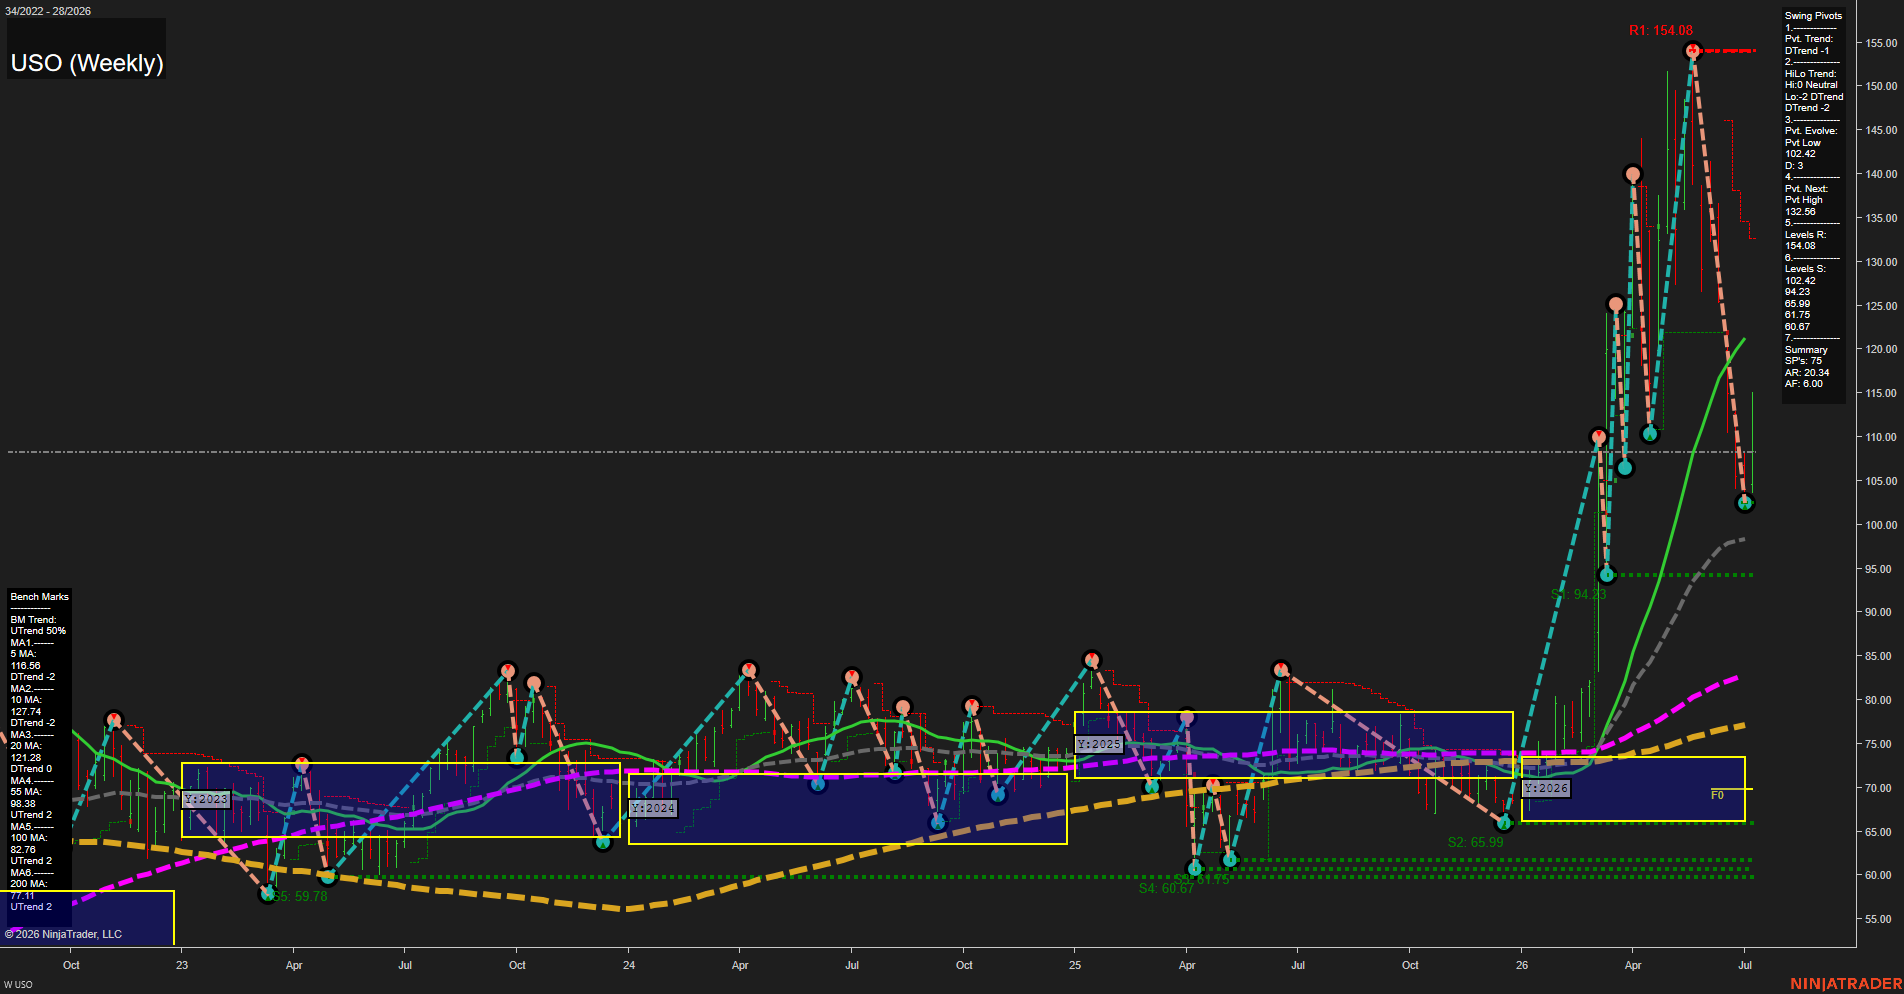
Overall Rating
- Short-Term: Bearish
- Intermediate-Term: Bearish
- Long-Term: Bullish.
Key Insights Summary
USO has moved from a strong multi-month advance into a sharp weekly retracement from the 154.08 pivot high, with the latest swing pressing into the 102.42 pivot low area. The short-term structure is DTrend and the faster benchmarks are rolling over, which fits a fast downside momentum phase after a vertical rally. The intermediate view is still repairing: price is below the 5, 10, and 20-week benchmarks, while the 55-, 100-, and 200-week averages remain positively aligned and rising, preserving the broader long-term uptrend. The chart is showing a momentum reset after the prior breakout sequence, with price now working back through the lower portion of the 2026 yearly grid and re-engaging the prior support band around the low-100s.
View charts on: AlphaWebTrader HTF Charts
GLD Weekly View
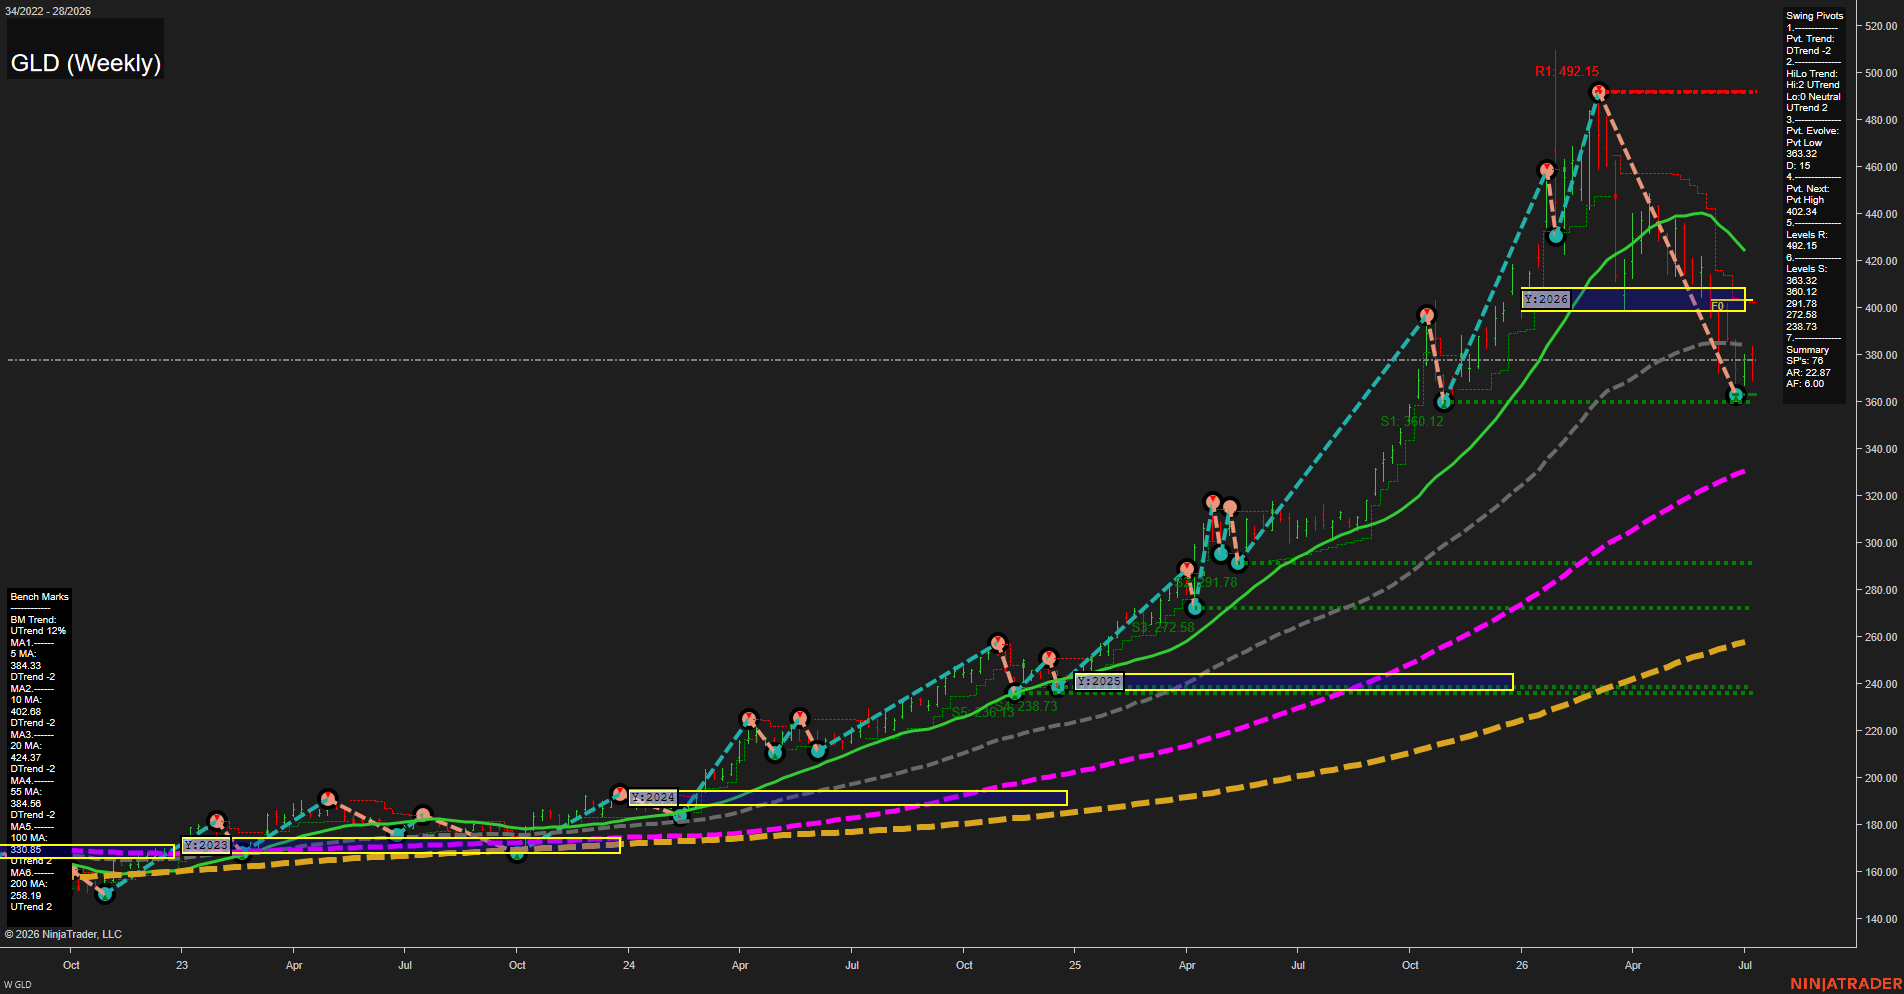
Overall Rating
- Short-Term: Bearish
- Intermediate-Term: Bearish
- Long-Term: Neutral.
Key Insights Summary
GLD is in a sharp weekly correction after a powerful multi-year advance and a 2026 spike to the 492.15 resistance zone. Price has fallen back under the 20, 55, and 100 week benchmarks, with the short-term pivot structure in DTrend and the next downside pivot centered around the 363.32 low. The move lower looks like a fast retracement from an extended rally, with the 360.12 support level now a key weekly reference and 383.32 acting as nearby overhead resistance. Intermediate structure remains constructive only in the broader pivot sequence, but the current weekly tape is negative and momentum has shifted from breakout to retracement. Long-term trend is still mixed-to-neutral because price remains well above the 200-day benchmark, even though the recent decline has damaged the medium-term trend profile.
View charts on: AlphaWebTrader HTF Charts