U.S. stocks closed higher as AI and chip strength offset Middle East tensions, while gold stayed weak and oil remained volatile on supply headlines.
Fundamentals: U.S. equities held firm into the close, with the S&P 500 near record levels as AI and semiconductor shares supported the tape. Commodity markets were more mixed: gold remained pressured by a stronger dollar and higher yields, while oil stayed volatile amid renewed Iran-related tensions and supply news. Inflation data, bank earnings, and valuation concerns remained in focus.
Technicals: U.S. equities closed with a bullish tone, led by gains in META, NVDA, and IBIT, while GOOG, IWM, and AMZN finished lower. Futures and index charts showed mixed short-term conditions, but the broader structure for ES, YM, EMD, and RTY remained trend-supported, with several markets holding constructive intermediate and long-term setups despite recent rotations.
After Market Close daily snapshot: market news summary and sentiment, major ETFs, Magnificent 7 analysis, Indices Futures Higher Time Frame Analysis, and E-mini S&P500, Nasdaq 100, NYMEX Crude, Gold Futures Daily Chart analysis.
As of: July 10, 2026 05:00 CT
Market News Summary:
Equities held firm into the close, while gold stayed pressured by a strong dollar and oil stayed volatile on Iran-related tensions and supply headlines.
Primary Drivers & Risks:
- Primary Driver: AI-led equity strength
- Primary Risk: Inflation and geopolitical shocks
Tone:
Mixed, with equity support and commodity-related caution.
Stock Market / ETFs / Indices:
U.S. stocks finished higher, with the S&P 500 near a record as enthusiasm around artificial intelligence and semiconductor names offset renewed Middle East tensions. Nasdaq-linked products and chip stocks drew attention, while several headlines flagged elevated valuations and limited margin for error if AI earnings weaken. Bank earnings, passive flows, and deal activity also remained in focus.
Geopolitical:
Renewed U.S.-Iran fighting and tensions around the Strait of Hormuz added to market volatility. The week also included heightened geopolitical tensions tied to energy and semiconductor trading.
Oil / Energy:
WTI and Brent remained trapped in noisy range trade as markets searched for a bottom. Renewed Iran-related conflict lifted crude and gasoline prices, while other commentary pointed to broader oil production growth and supply adjustments.
Gold / Metals:
Gold stayed pressured by a strong U.S. dollar and rising Treasury yields, with repeated tests around the $4,000 area. Silver and platinum also moved lower, while aluminium fell after a refinery restart in the UAE.
Fed / Financials:
U.S. inflation data remained the key macro release ahead, with investors watching the Federal Reserve’s tightening bias. Bank earnings approached with financial valuations discussed as relatively cheaper than in 2024, while Treasury rate risk and bond duration choice stayed in focus.
Macro / Other:
Market commentary pointed to elevated valuations, sustainability concerns in parts of the AI complex, and a large federal budget deficit driven by interest and entitlement spending. A carry trade rebound and strong recent equity returns also featured in the broader backdrop.
Conclusion:
Primary drivers were AI-led equity resilience, inflation sensitivity, and renewed geopolitical pressure on commodities. Gold faced dollar and yield headwinds, while oil stayed reactive to Iran-related developments and supply headlines.
Secondary drivers included earnings season positioning, high valuation concerns, and Treasury rate risk. Cross-currents remained visible across banks, semiconductors, and metals, keeping index futures sensitive to macro data and headline shocks.
Market News Sentiment
Market News Articles: 31
- Neutral: 54.84%
- Negative: 25.81%
- Positive: 19.35%
Sentiment Summary: Market news is predominantly neutral at 55%, with negative sentiment at 26% and positive sentiment at 19% across 31 articles, indicating a mixed but low-conviction tone for indices futures.
Conclusion: The overall sentiment profile is balanced toward neutrality, with no dominant directional bias in the news flow.
GLD,Gold Articles: 12
- Positive: 41.67%
- Negative: 33.33%
- Neutral: 25.00%
Sentiment Summary: Gold-related coverage is mixed, with 42% positive, 33% negative, and 25% neutral articles across 12 items.
Conclusion: Overall sentiment is slightly positive but still balanced by a meaningful negative share, indicating no clear directional consensus in the news flow.
USO,Oil Articles: 11
- Neutral: 45.45%
- Negative: 36.36%
- Positive: 18.18%
Sentiment Summary: Oil-related coverage is mostly neutral at 45%, with negative sentiment at 36% and positive sentiment at 18% across 11 articles.
Conclusion: The article mix shows a neutral-to-negative tone overall, with limited positive sentiment.
Market Data Snapshot
ETF Snapshot of major stock market ETFs, Mag7, and others as of: July 10, 2026 05:00
Top Movers & Losers
- META 669.21 Bullish 5.97% ▲
- NVDA 210.96 Bullish 4.03% ▲
- IBIT 36.23 Bullish 1.17% ▲
- GOOG 355.03 Bearish -0.34% ▼
- IWM 295.99 Bearish -0.42% ▼
- AMZN 245.34 Bearish -0.69% ▼
Major Index ETFs: SPY, QQQ, DIA, IWM, IJH
- SPY 754.95 Bullish 0.43% ▲
- QQQ 725.51 Bullish 0.31% ▲
- DIA 525.78 Bullish 0.30% ▲
- IJH 75.67 Bearish -0.04% ▼
- IWM 295.99 Bearish -0.42% ▼
Mixed tone across the major index ETFs: SPY led the upside with +0.43%, followed by QQQ at +0.31% and DIA at +0.30%. On the downside, IWM was the most bearish mover at -0.42%, while IJH was near-flat at -0.04%.
Mag 7 Stocks: AAPL, MSFT, GOOG, AMZN, META, NVDA, TSLA
- META 669.21 Bullish 5.97% ▲
- NVDA 210.96 Bullish 4.03% ▲
- TSLA 407.76 Bullish 0.30% ▲
- MSFT 385.10 Bullish 0.19% ▲
- AAPL 315.32 Bearish -0.28% ▼
- GOOG 355.03 Bearish -0.34% ▼
- AMZN 245.34 Bearish -0.69% ▼
Mixed Mag7 tone: META led the group with a Bullish +5.97%, followed by NVDA at +4.03%; TSLA +0.30% and MSFT +0.19% were near-flat, while AAPL -0.28%, GOOG -0.34%, and AMZN posted the most bearish move at -0.69%.
Cross-Market ETFs: TLT, GLD, USO, IBIT
- IBIT 36.23 Bullish 1.17% ▲
- TLT 84.47 Bearish -0.02% ▼
- USO 108.70 Bearish -0.28% ▼
- GLD 377.01 Bearish -0.31% ▼
Mixed: IBIT was the most bullish mover at +1.17%, while GLD was the most bearish mover at -0.31%; USO followed at -0.28% and TLT was near-flat at -0.02%.
ETF, Mag7, and Cross-Market ETF Insights
Overall Tone
Risk on: major equity ETFs and several Mag7 names are holding positive territory, while defensive cross-market positioning is mostly muted to softer.
Equity ETFs and Mag7:
Major index ETFs are broadly aligned in a modestly +0.30% to +0.43% band for SPY, QQQ, and DIA, while IWM -0.42% and IJH -0.04% show a more selective small-cap to mid-cap split. Mag7 leadership is concentrated in META at +5.97% and NVDA at +4.03%, with MSFT +0.19% and TSLA +0.30% near-flat, while AMZN at -0.69% is the most bearish mover and AAPL -0.28% and GOOG -0.34% are also softer.
Cross-Market ETFs:
Cross-market ETFs are mixed to slightly defensive: IBIT is the clear leader at +1.17%, while TLT is essentially flat at -0.02%, showing little haven bid. GLD -0.31% and USO -0.28% are both lower, so the commodity tape is softer even as equities remain constructive.
Futures Indices – Higher Time Frame Analysis
Summary of the current state of US Indices Futures based on higher time-frame (HTF) technical analysis as of: 2026-07-10: 17:00 CT.
US Indices Futures
- ES YSFG above F0%, MSFG/WSFG bullish, benchmarks stacked higher, pivots UTrend, resistance 7693.50, supports 7415.50, 6400s, 5300s, 4700s.
- NQ YSFG bullish, MSFG/WSFG below center and corrective, benchmarks mixed with 20-day lagging, pivots pullback phase, resistance 30975.50-31090.00, support 28909.75-28510.00.
- YM YSFG/MSFG/WSFG bullish, benchmarks aligned higher, pivots UTrend, resistance 53586, support 50898, deeper supports 45430, 39709, 36525, 36386, 33854.
- EMD YSFG bullish, MSFG/WSFG constructive, benchmarks all rising, pivots UTrend, resistance 3778-3782 and fresh highs near 3892.4, support 3686 then 3634.6.
- RTY YSFG bullish, MSFG/WSFG below midlines, benchmarks bullish except near-term lag, pivots UTrend on weekly, daily DTrend with HiLo UTrend, resistance 3047.4-3068.4, support around 3000.
- FDAX YSFG/MSFG bullish, WSFG mixed, benchmarks upward and aligned, pivots higher on weekly, daily short-term decline, resistance 26064, supports 22210, 19810, 18535, 16767.
Overall State
- Short-Term: Neutral
- Intermediate-Term: Bullish
- Long-Term: Bullish
Conclusion
ES, YM, and EMD remain aligned with bullish YSFG, MSFG, and WSFG structures, supported by upward benchmark stacks and higher swing pivots. NQ and RTY show short-term corrective rotation, with MSFG/WSFG softness and nearby pivot resistance after sharp prior advances. FDAX is also in a broader bullish HTF structure, though its weekly and daily swing phases remain more mixed. Across the complex, yearly grids stay constructive, long-term trend alignment remains higher, and the main differentiation is short-term rotation versus the larger bullish benchmark and pivot framework.
Note: Intra-day counter-trend pullbacks or retracements may occur, HTF is context for informational usage and market structure. Glossary: Session Fib Grids periods of YSFG:’Yearly’, MSFG:’Monthly’, WSFG:’Weekly’
For full details visit: AlphaWebTrader Technicals
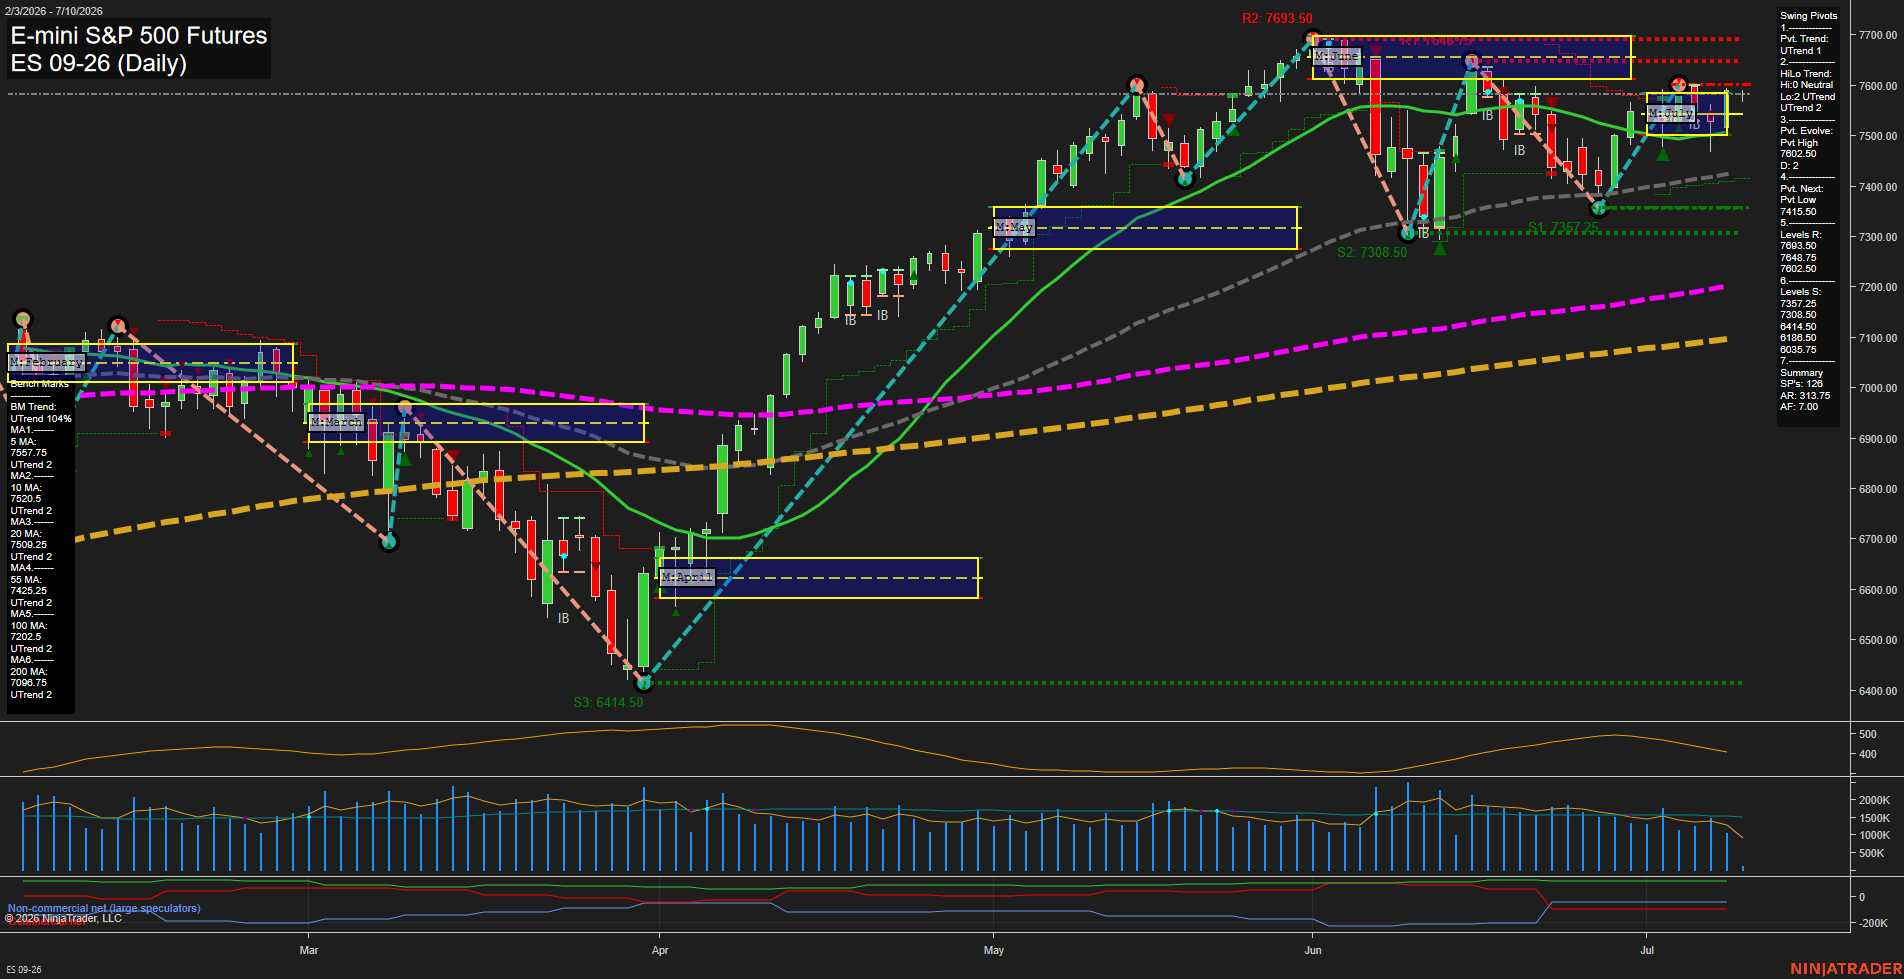
ES Daily View
Overall Rating
- Short-Term: Bullish
- Intermediate-Term: Bullish
- Long-Term: Bullish.
Key Insights Summary
The daily structure remains firmly constructive, with price holding above the weekly, monthly, and yearly fib grid center zones and staying well above all benchmark moving averages. The swing pivot framework remains in an active uptrend, with the last confirmed high at 7602.50 and the next meaningful pivot reference down at 7415.50, showing an elevated but still orderly bullish structure after the June rally. Recent action is characterized by a strong advance, a brief pullback from the upper pivot zone, and a rebound back into the upper range, which reflects ongoing trend rotation rather than a breakdown. The benchmark stack is fully bullish from 5-day through 200-day, supporting a broad trend alignment across short, intermediate, and long horizons. Recent long signals on WSFG, MSFG, and TR120 reinforce the upside trend profile, while the yearly fib position near mid-range suggests the larger 2026 trend still has room to extend within its current upward cycle.
View charts on: AlphaWebTrader HTF Charts
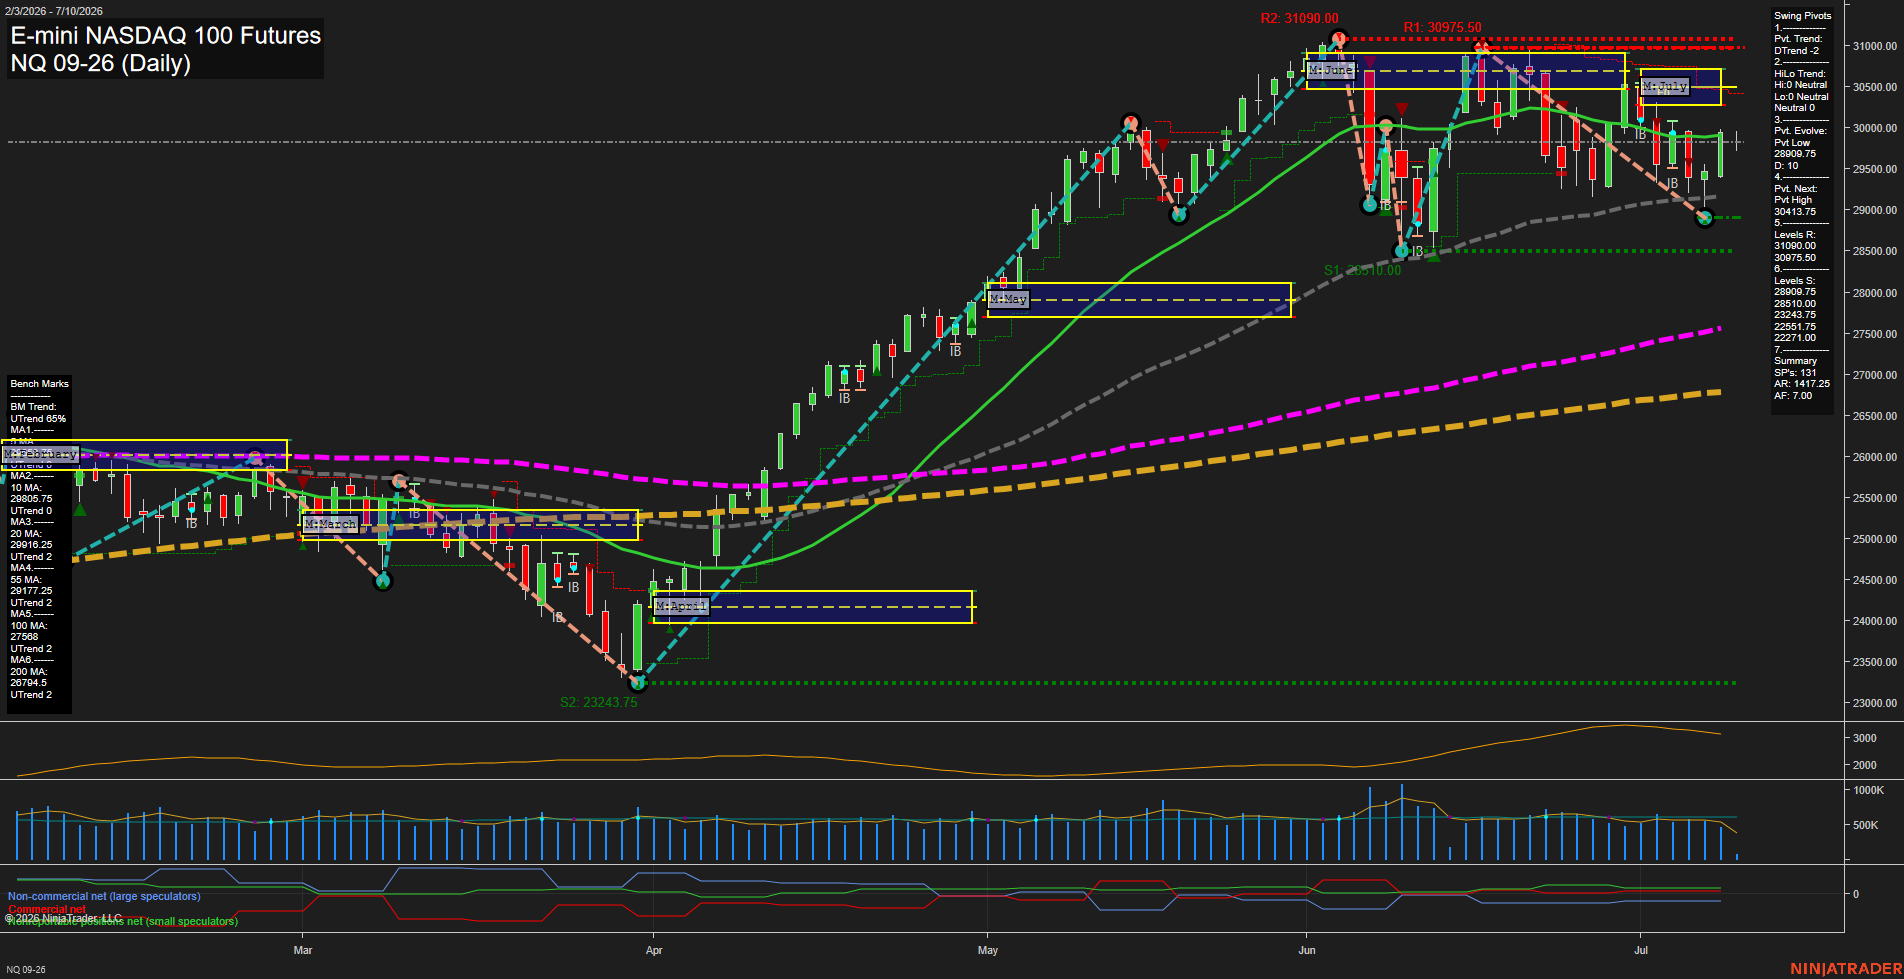
NQ Daily View
Overall Rating
- Short-Term: Bearish
- Intermediate-Term: Bearish
- Long-Term: Bullish.
Key Insights Summary
The daily structure shows a large-range, fast-momentum market that remains under weekly and monthly session fib grid control, keeping the short and intermediate swing posture negative. Price is trading below the 20-day benchmark but still above the 55-day, 100-day, and 200-day benchmarks, reflecting a broader uptrend that has been interrupted by a sharp pullback and consolidation beneath recent highs. Swing pivots remain in a short-term downtrend with the next upside pivot above at 30413.75 and layered resistance near 30975.50 to 31090.00, while nearby support is anchored around 28909.75 and 28510.00. The tape shows a recovery attempt after a volatile June decline and rebound sequence, with recent sessions forming a choppy range after the selloff from the upper 30K area. From a futures swing trader perspective, the chart is still working through a corrective phase inside a longer-term bullish year framework.
View charts on: AlphaWebTrader HTF Charts
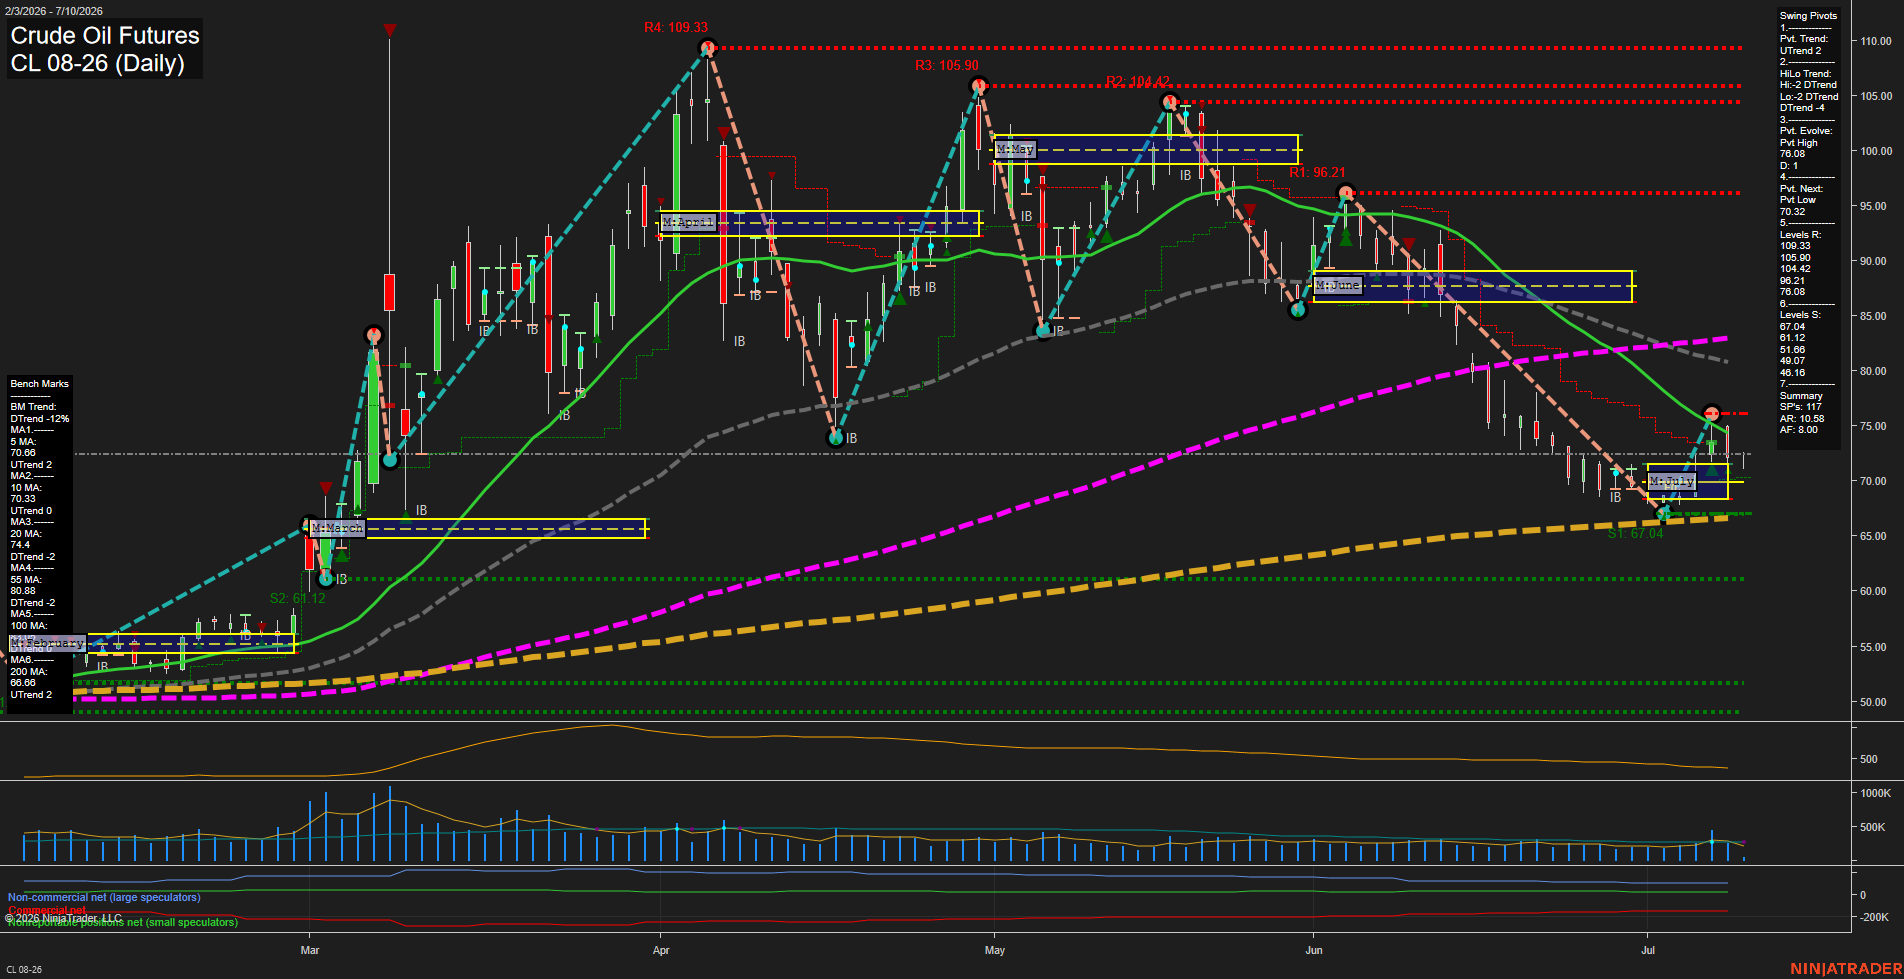
CL Daily View
Overall Rating
- Short-Term: Neutral
- Intermediate-Term: Bearish
- Long-Term: Neutral.
Key Insights Summary
Crude oil is in a volatile downtrend with a sharp selloff into the low 70s followed by a fast bounce, leaving price below the 20/55/100-day benchmarks but still above the 200-day average. The short-term pivot structure has flipped to UTrend while the broader HiLo pivot profile remains DTrend, showing a countertrend recovery inside a larger corrective sequence. Weekly and monthly fib grids both show price above the NTZ midpoint bias, yet the monthly session remains very compressed at 11%, reflecting an extended move that has recently rotated lower and then stabilized. The recent signal sequence shows alternating long and short triggers, consistent with a choppy transition phase rather than a clean trend continuation. Longer-term structure is still anchored by the rising 200-day and the positive yearly fib bias, while the intermediate moving averages continue to lean lower, keeping the broader profile mixed to bearish.
View charts on: AlphaWebTrader HTF Charts
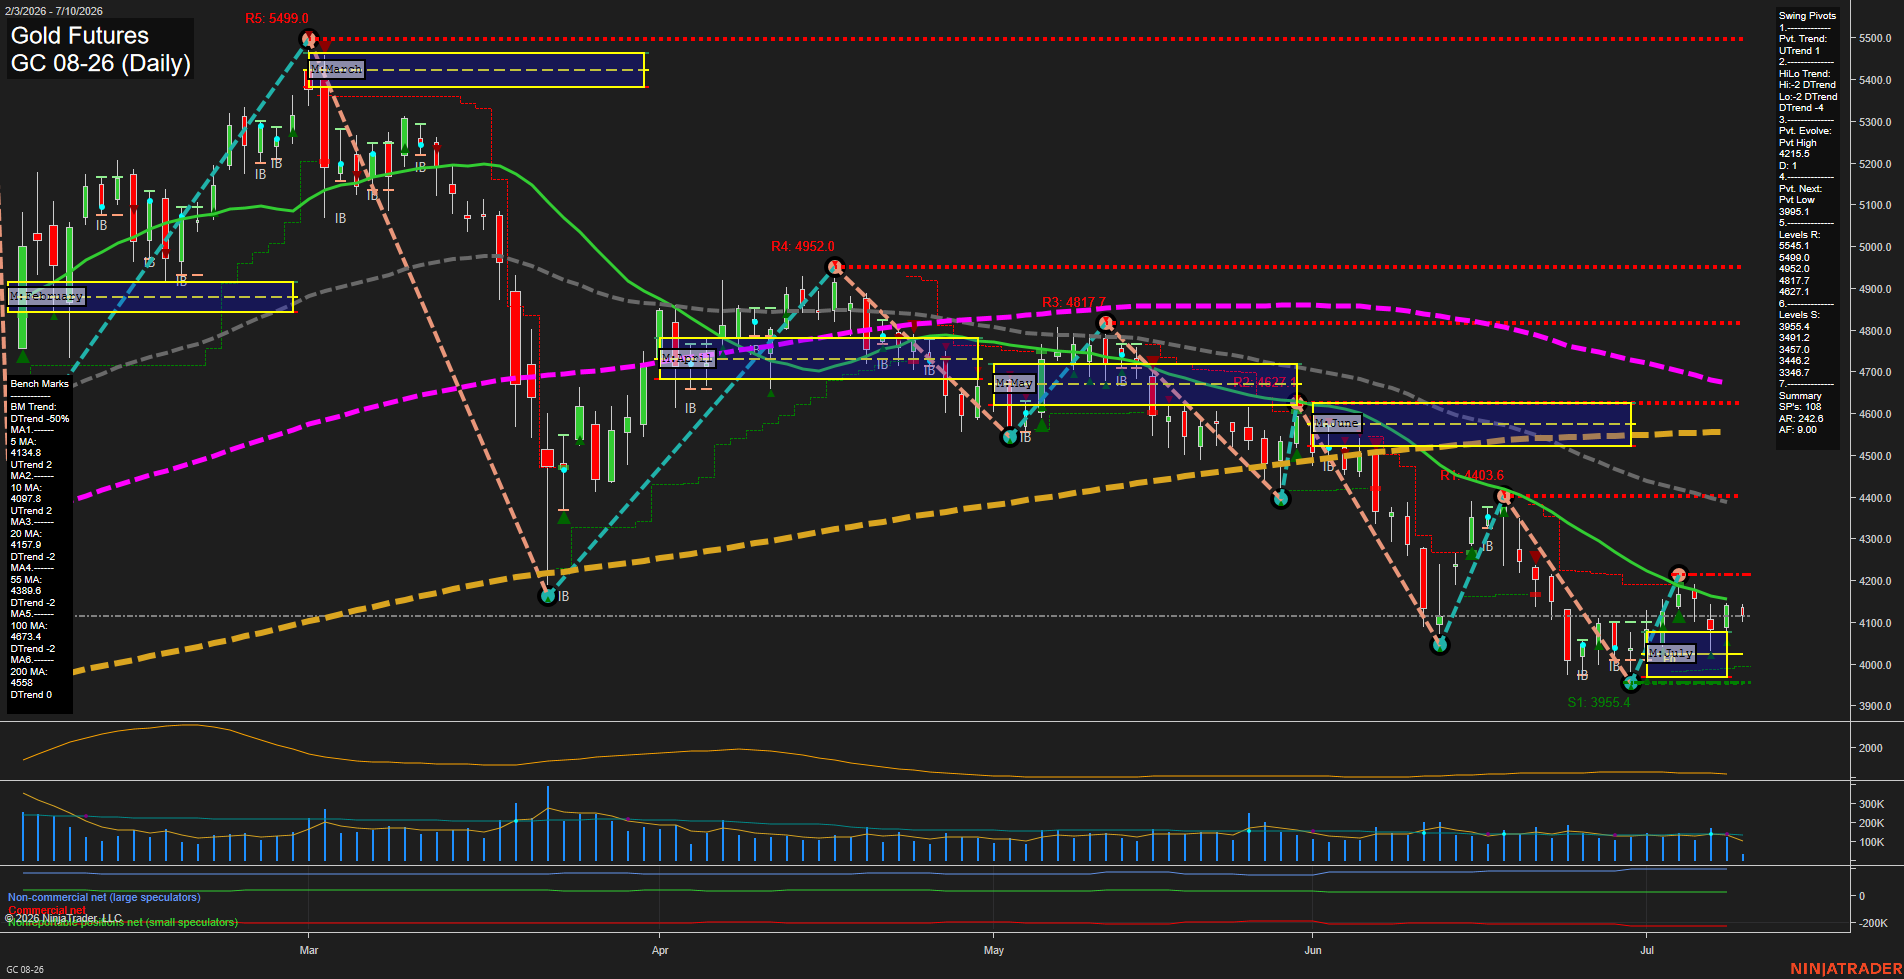
GC Daily View
Overall Rating
- Short-Term: Bearish
- Intermediate-Term: Bearish
- Long-Term: Bearish.
Key Insights Summary
Gold futures remain in a broad corrective downtrend with price pressed near the lower end of the recent range after a series of lower highs and lower lows. The weekly session fib structure stays bearish with price below the NTZ, while the monthly session still shows a constructive but fading intermediate recovery attempt above the monthly F0% area. Swing pivots are aligned bearish on both the short and intermediate horizon, and price remains under the 5, 10, 20, 55, 100, and 200 day benchmarks, reinforcing downside control across timeframes. The recent action shows a sharp selloff, a partial bounce, and then renewed weakness into early July, leaving the chart in a choppy, trend-retest phase rather than a clean bullish reversal. The current structure emphasizes rejection behavior around prior rally zones and continued pressure toward lower support references near the mid-3900s.
View charts on: AlphaWebTrader HTF Charts