Pre-market traders track ETF movers, mixed futures structure, and sector rotation as metals, oil, yields, and the dollar shape session tone.
Fundamentals: Wall Street opened with broad gains, but futures softened as semiconductors retreated and investors rotated from technology into healthcare, industrials, biotech, insurance and utilities. Middle East tensions, slower tanker traffic in the Strait of Hormuz, and oil’s recent rebound kept energy risk elevated, while gold and silver recovered on a weaker dollar and easing Treasury yields.
Technicals: The pre-market session opens with ETF momentum led by META, TSLA, and QQQ, while NVDA, GOOG, and USO finished lower. Futures index analysis shows a broadly bullish backdrop in ES, YM, EMD, and RTY on higher timeframes, contrasted with corrective pressure in NQ and a short-term pullback in FDAX. Price structure, pivot levels, and moving average alignment remain the focus across sessions.
Pre-Market Trading 360° view Market Radar of: holidays, earnings, eco-news, market-news summary, news sentiment, prior session major ETFs, MAG7, Higher Time Frame Analysis Indices Futures Summary, and E-mini S&P500, Nasdaq 100, NYMEX Crude, Gold Futures Daily Chart analysis.
As of: July 10, 2026 07:16 CT
Earnings Radar
Monitoring for earnings releases by the Magnificent 7, AI-tech-related firms, and major financial institutions.
- MS Release: 2026-07-15 T:BMO
- BAC Release: 2026-07-14 T:BMO
- C Release: 2026-07-14 T:BMO
- GS Release: 2026-07-14 T:BMO
- JPM Release: 2026-07-14 T:BMO
- WFC Release: 2026-07-14 T:BMO
Conclusion: The 2026-07-14 BMO releases from JPM, GS, C, BAC, and WFC, followed by MS on 2026-07-15 BMO, place major banks at the center of near-term index-futures sensitivity; broad-market direction will reflect financial-sector headline flow and pre-release positioning. Market momentum and volume can slow ahead of major earnings releases.
For full details visit: Yahoo Earnings Calendar
Market News Summary:
US equity futures, commodities, and rate-sensitive assets reflected a mix of rotation, Middle East risk, and a rebound in metals.
Primary Drivers & Risks:
- Primary Driver: Tech-led stock rotation
- Primary Risk: Iran-related supply disruption
Tone:
Mixed, with broad equity strength offset by heightened energy and volatility risks.
Stock Market / ETFs / Indices:
Wall Street posted gains in a broad rally, with the chip trade helping offset renewed Middle East tensions. At the same time, Nasdaq and S&P 500 futures softened as semiconductor stocks retreated, and rotation out of technology into healthcare, industrials, biotech, insurance, and utilities remained in focus.
Geopolitical:
Fresh US-Iran hostilities continued to shape sentiment, with tanker traffic in the Strait of Hormuz slowing and LNG and other vessels still transiting the waterway under strain. Market coverage also highlighted renewed fighting in the Middle East alongside efforts to frame the tensions as contained.
Oil / Energy:
Crude prices moved lower on signs that US-Iran tensions were contained, then remained on track for weekly gains as supply risks persisted. Separate reports cited WTI defending support near $72.08, Brent holding $76.13, and elevated refinery runs supporting demand, while the IEA warned that escalation could alter its surplus outlook and noted a first annual decline in world oil demand since 2020.
Gold / Metals:
Gold and silver rebounded as the dollar weakened, Treasury yields eased, and oil prices pulled back. Headlines also pointed to gold testing key resistance, central bank buying, and industrial metals such as silver and copper drawing more attention than gold in parts of the commodity trade.
Fed / Financials:
Fed-related headlines focused on Chairman Kevin Warsh and new AI task force members, adding a policy-reform backdrop without a direct rate signal. Treasury yield easing and the weaker dollar supported metals, while JGBs tracked higher with gains in US Treasurys.
Macro / Other:
Market commentary emphasized AI as a dominant investment theme, with several reports contrasting AI-linked assets with the rest of the economy. Rotation across regions and sectors also stood out, including strength in Hong Kong relative to weakness in Korea and a broader shift away from tech leadership.
Conclusion:
Primary drivers are the tech-led equity rotation, the rebound in chip-related sentiment, and shifting risk appetite around the Middle East and oil. Gold and silver gained support from a weaker dollar and softer yields, while crude remained sensitive to shipping disruption and US-Iran headlines.
Secondary drivers include Fed institutional changes, cross-asset rotation into nontech sectors, and regional equity divergence. The main risk remains a renewed escalation in the Strait of Hormuz, which keeps energy volatility and headline-driven index swings elevated.
Market News Sentiment
Market News Articles: 27
- Neutral: 62.96%
- Negative: 25.93%
- Positive: 11.11%
Sentiment Summary: News flow is predominantly neutral at 63%, with 26% negative and 11% positive across 27 articles.
Conclusion: The overall tone is mixed to neutral, with negative coverage outweighing positive coverage.
GLD,Gold Articles: 14
- Positive: 50.00%
- Neutral: 35.71%
- Negative: 14.29%
Sentiment Summary: Gold-related coverage was mixed, with 50% positive, 36% neutral, and 14% negative articles across 14 reports.
Conclusion: The overall tone was mildly positive but still balanced by a meaningful neutral share.
USO,Oil Articles: 11
- Negative: 54.55%
- Neutral: 27.27%
- Positive: 18.18%
Sentiment Summary: USO/oil news is predominantly negative, with 11 articles showing 55% negative, 27% neutral, and 18% positive sentiment.
Conclusion: The overall tone in the oil-related news flow is weak, with negative articles outnumbering neutral and positive coverage.
Market Data Snapshot
ETF Snapshot of major stock market ETFs, Mag7, and others as of: July 10, 2026 07:16
Top Movers & Losers
- META 631.48 Bullish 4.70% ▲
- TSLA 406.55 Bullish 3.17% ▲
- QQQ 723.28 Bullish 1.66% ▲
- NVDA 202.78 Bearish -0.66% ▼
- GOOG 356.24 Bearish -0.69% ▼
- USO 109.01 Bearish -2.85% ▼
Major Index ETFs: SPY, QQQ, DIA, IWM, IJH
- QQQ 723.28 Bullish 1.66% ▲
- IJH 75.70 Bullish 1.30% ▲
- IWM 297.24 Bullish 1.28% ▲
- SPY 751.71 Bullish 0.85% ▲
- DIA 524.19 Bullish 0.27% ▲
Major index ETFs are broadly Bullish, led by QQQ at +1.66% as the most bullish mover, followed by IJH at +1.30% and IWM at +1.28%; SPY is also firm at +0.85%, while DIA is the least positive mover at +0.27%.
Mag 7 Stocks: AAPL, MSFT, GOOG, AMZN, META, NVDA, TSLA
- META 631.48 Bullish 4.70% ▲
- TSLA 406.55 Bullish 3.17% ▲
- AMZN 247.04 Bullish 1.40% ▲
- AAPL 316.22 Bullish 0.90% ▲
- MSFT 384.36 Bullish 0.27% ▲
- NVDA 202.78 Bearish -0.66% ▼
- GOOG 356.24 Bearish -0.69% ▼
Mag7 is Mixed, led by the most bullish mover META +4.70% and the most bearish mover GOOG -0.69%. TSLA +3.17% and AMZN +1.40% were also firm, while AAPL +0.90% and MSFT +0.27% were near-flat to mildly higher. NVDA was slightly lower at -0.66%.
Cross-Market ETFs: TLT, GLD, USO, IBIT
- IBIT 35.81 Bullish 1.65% ▲
- GLD 378.18 Bullish 1.00% ▲
- TLT 84.49 Bullish 0.15% ▲
- USO 109.01 Bearish -2.85% ▼
Mixed: IBIT led as the most bullish mover at +1.65%, followed by GLD at +1.00% and TLT near-flat at +0.15%, while USO was the most bearish mover at -2.85%.
ETF, Mag7, and Cross-Market ETF Insights
Overall Tone
Risk on, with equities broadly firm and leadership concentrated in a few growth names while cross-market signals stay mixed but not defensive.
Equity ETFs and Mag7:
Major index ETFs are aligned higher, led by QQQ at +1.66%, with SPY at +0.85%, IWM at +1.28%, IJH at +1.30%, and DIA lagging at +0.27%. Mag7 participation is selective but strong: META is the standout most bullish mover at +4.70%, followed by TSLA at +3.17%, while GOOG is the most bearish mover at -0.69% and NVDA is also negative at -0.66%. Overall, equities are constructive, but the advance is more growth-led than uniform across the group.
Cross-Market ETFs:
Cross-market ETFs are mixed to firmer, with IBIT at +1.65% and GLD at +1.00% signaling appetite for both digital assets and hedging exposure, while TLT is nearly flat at +0.15%. USO is the clear outlier and most bearish mover in the cross-market set at -2.85%, pointing to weakness in energy versus the broader risk-on tone. Compared with equities, these moves suggest the session is not driven by broad defensive demand.
Futures Indices – Higher Time Frame Analysis
Summary of the current state of US Indices Futures based on higher time-frame (HTF) technical analysis as of: 2026-07-10: 07:16 CT.
US Indices Futures
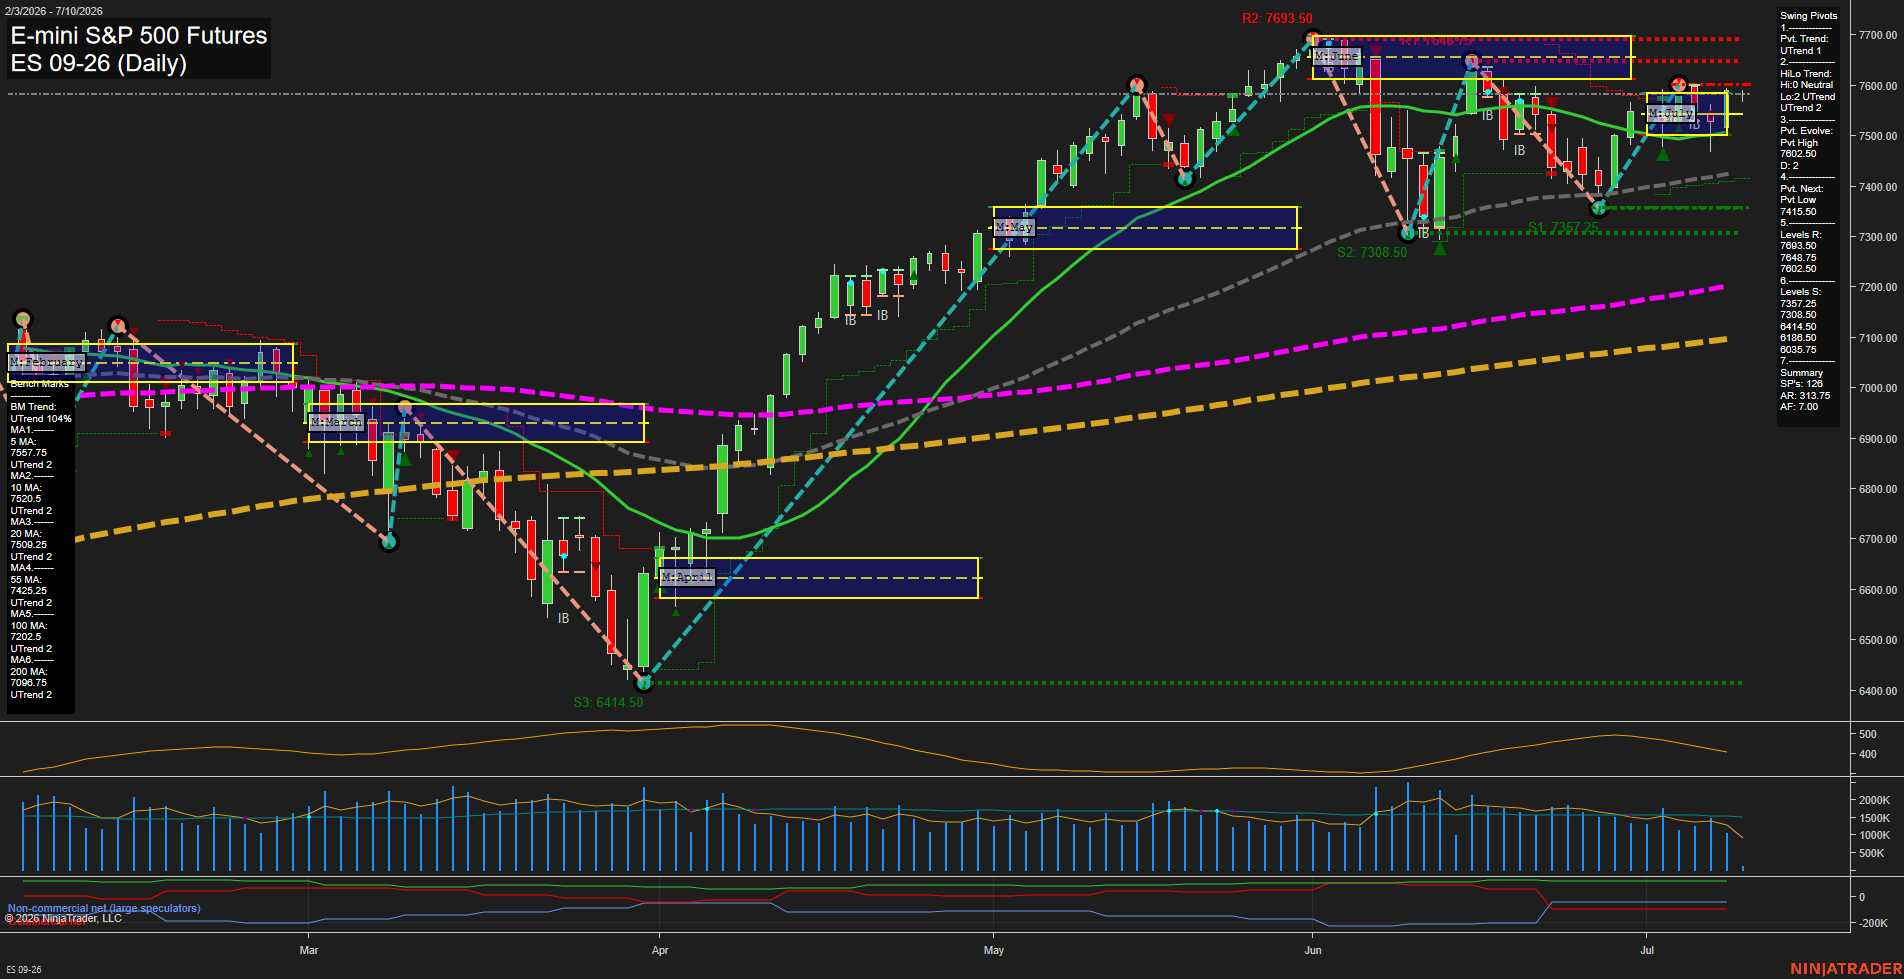
- ES YSFG/MSFG/WSFG bullish, price above all MA benchmarks, pivots trend higher, resistance 7693.50, support 7415.50 then 6400s.
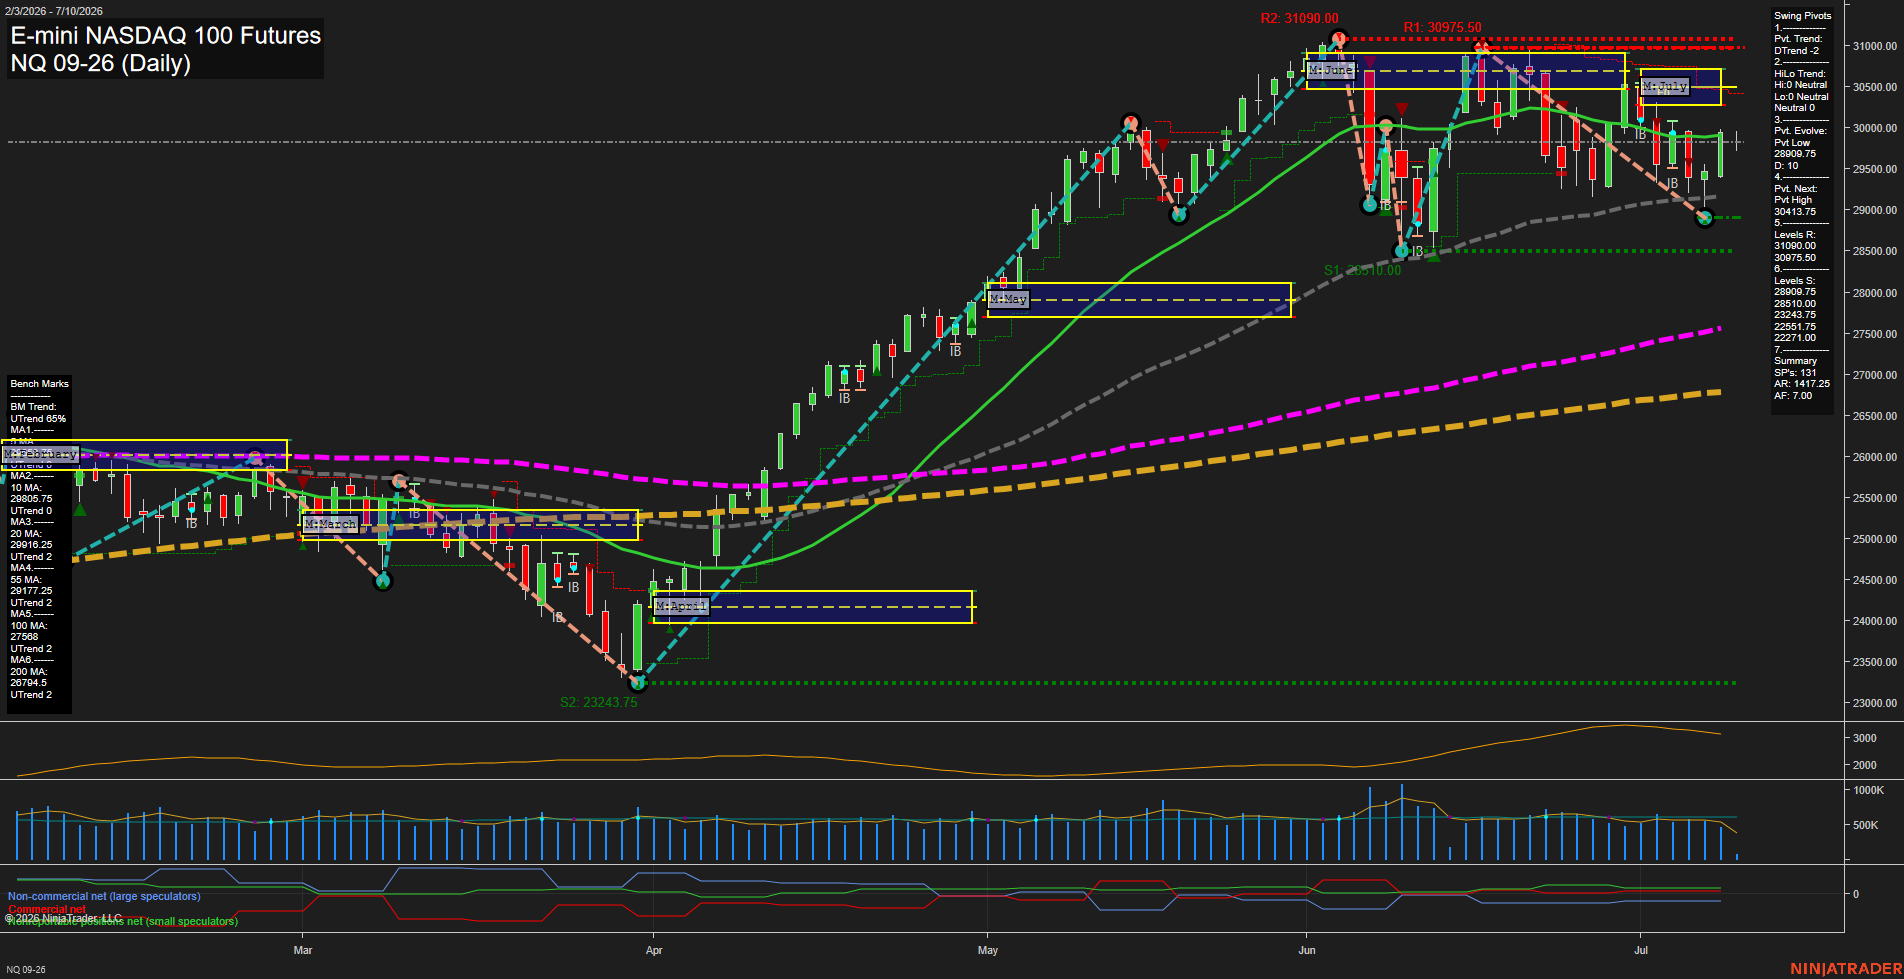
- NQ YSFG bullish, WSFG/MSFG bearish, below 20-day but above 55/100/200-day, pivot pullback from 31090, support 28909.75 and 28510.00.
- YM YSFG/MSFG/WSFG bullish, price above all MA benchmarks, pivot structure higher, resistance 53586, support 50898 then 45430.
- EMD YSFG/MSFG/WSFG bullish, price above all MA benchmarks, UTrend pivots intact, resistance 3892.4 area, support 3778 to 3686.
- RTY YSFG bullish, WSFG/MSFG below F0% and short-term soft, below 5/10-day but above 20/55/100/200-day, pivot resistance 3068.4.
- FDAX YSFG/MSFG bullish, WSFG down, above 20/55/100/200-day, pivots higher but short-term retracement, resistance 26064, support 22210 then 19810.
Overall State
- Short-Term: Neutral
- Intermediate-Term: Bullish
- Long-Term: Bullish
Conclusion
HTF structure remains broadly bullish across the major indices, led by ES, YM, and EMD, where YSFG, MSFG, and WSFG remain aligned with rising benchmark stacks and higher pivot progression. NQ, RTY, and FDAX show shorter-term rotation or retracement, with WSFG weakness and local pivot rejection, while their higher-timeframe yearly and longer MA structures remain constructive. Across the group, price is generally above the 55/100/200-day benchmarks, with ES, YM, and EMD closest to trend continuation, and NQ, RTY, and FDAX showing corrective conditions inside larger uptrends. Key reference levels remain the listed pivot resistances and layered support zones.
Note: Intra-day counter-trend pullbacks or retracements may occur, HTF is context for informational usage and market structure. Glossary: Session Fib Grids periods of YSFG:’Yearly’, MSFG:’Monthly’, WSFG:’Weekly’
For full details visit: AlphaWebTrader Technicals
ES Daily View
Overall Rating
- Short-Term: Bullish
- Intermediate-Term: Bullish
- Long-Term: Bullish.
Key Insights Summary
The daily structure remains firmly constructive, with price holding above the weekly, monthly, and yearly fib grid center zones and staying well above all benchmark moving averages. The swing pivot framework remains in an active uptrend, with the last confirmed high at 7602.50 and the next meaningful pivot reference down at 7415.50, showing an elevated but still orderly bullish structure after the June rally. Recent action is characterized by a strong advance, a brief pullback from the upper pivot zone, and a rebound back into the upper range, which reflects ongoing trend rotation rather than a breakdown. The benchmark stack is fully bullish from 5-day through 200-day, supporting a broad trend alignment across short, intermediate, and long horizons. Recent long signals on WSFG, MSFG, and TR120 reinforce the upside trend profile, while the yearly fib position near mid-range suggests the larger 2026 trend still has room to extend within its current upward cycle.
View charts on: AlphaWebTrader HTF Charts
NQ Daily View
Overall Rating
- Short-Term: Bearish
- Intermediate-Term: Bearish
- Long-Term: Bullish.
Key Insights Summary
The daily structure shows a large-range, fast-momentum market that remains under weekly and monthly session fib grid control, keeping the short and intermediate swing posture negative. Price is trading below the 20-day benchmark but still above the 55-day, 100-day, and 200-day benchmarks, reflecting a broader uptrend that has been interrupted by a sharp pullback and consolidation beneath recent highs. Swing pivots remain in a short-term downtrend with the next upside pivot above at 30413.75 and layered resistance near 30975.50 to 31090.00, while nearby support is anchored around 28909.75 and 28510.00. The tape shows a recovery attempt after a volatile June decline and rebound sequence, with recent sessions forming a choppy range after the selloff from the upper 30K area. From a futures swing trader perspective, the chart is still working through a corrective phase inside a longer-term bullish year framework.
View charts on: AlphaWebTrader HTF Charts
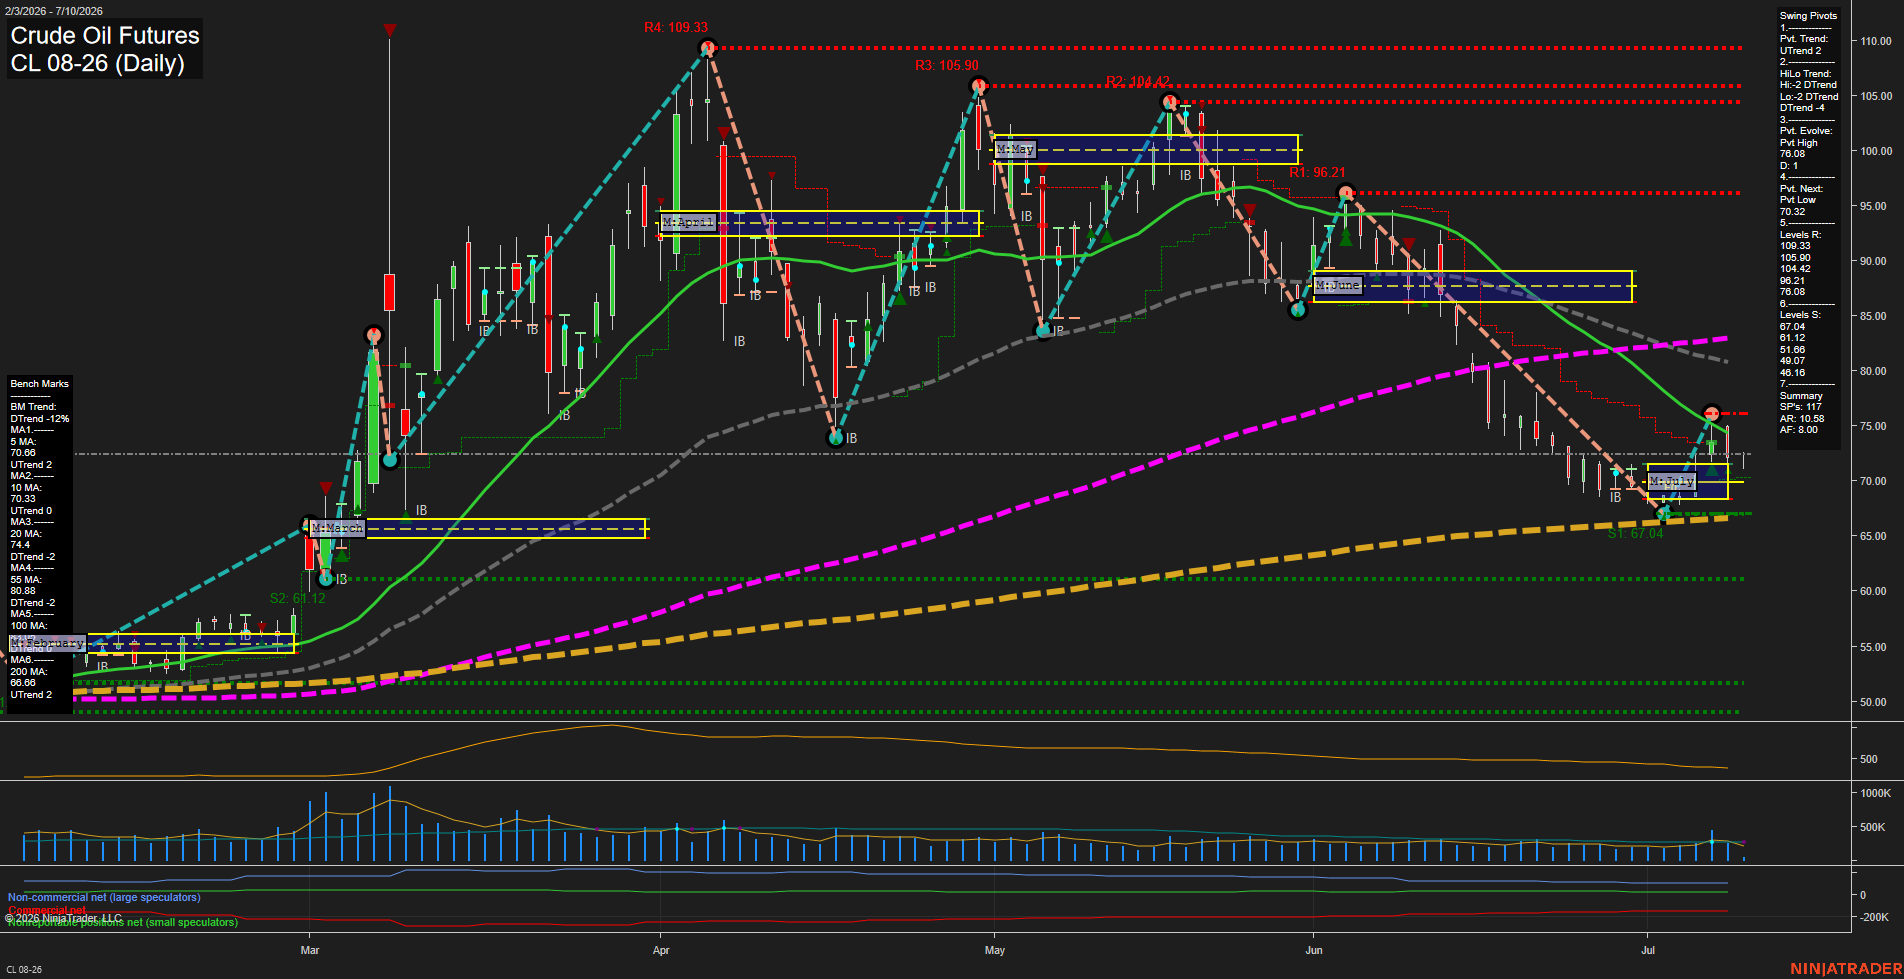
CL Daily View
Overall Rating
- Short-Term: Neutral
- Intermediate-Term: Bearish
- Long-Term: Neutral.
Key Insights Summary
Crude oil is in a volatile downtrend with a sharp selloff into the low 70s followed by a fast bounce, leaving price below the 20/55/100-day benchmarks but still above the 200-day average. The short-term pivot structure has flipped to UTrend while the broader HiLo pivot profile remains DTrend, showing a countertrend recovery inside a larger corrective sequence. Weekly and monthly fib grids both show price above the NTZ midpoint bias, yet the monthly session remains very compressed at 11%, reflecting an extended move that has recently rotated lower and then stabilized. The recent signal sequence shows alternating long and short triggers, consistent with a choppy transition phase rather than a clean trend continuation. Longer-term structure is still anchored by the rising 200-day and the positive yearly fib bias, while the intermediate moving averages continue to lean lower, keeping the broader profile mixed to bearish.
View charts on: AlphaWebTrader HTF Charts
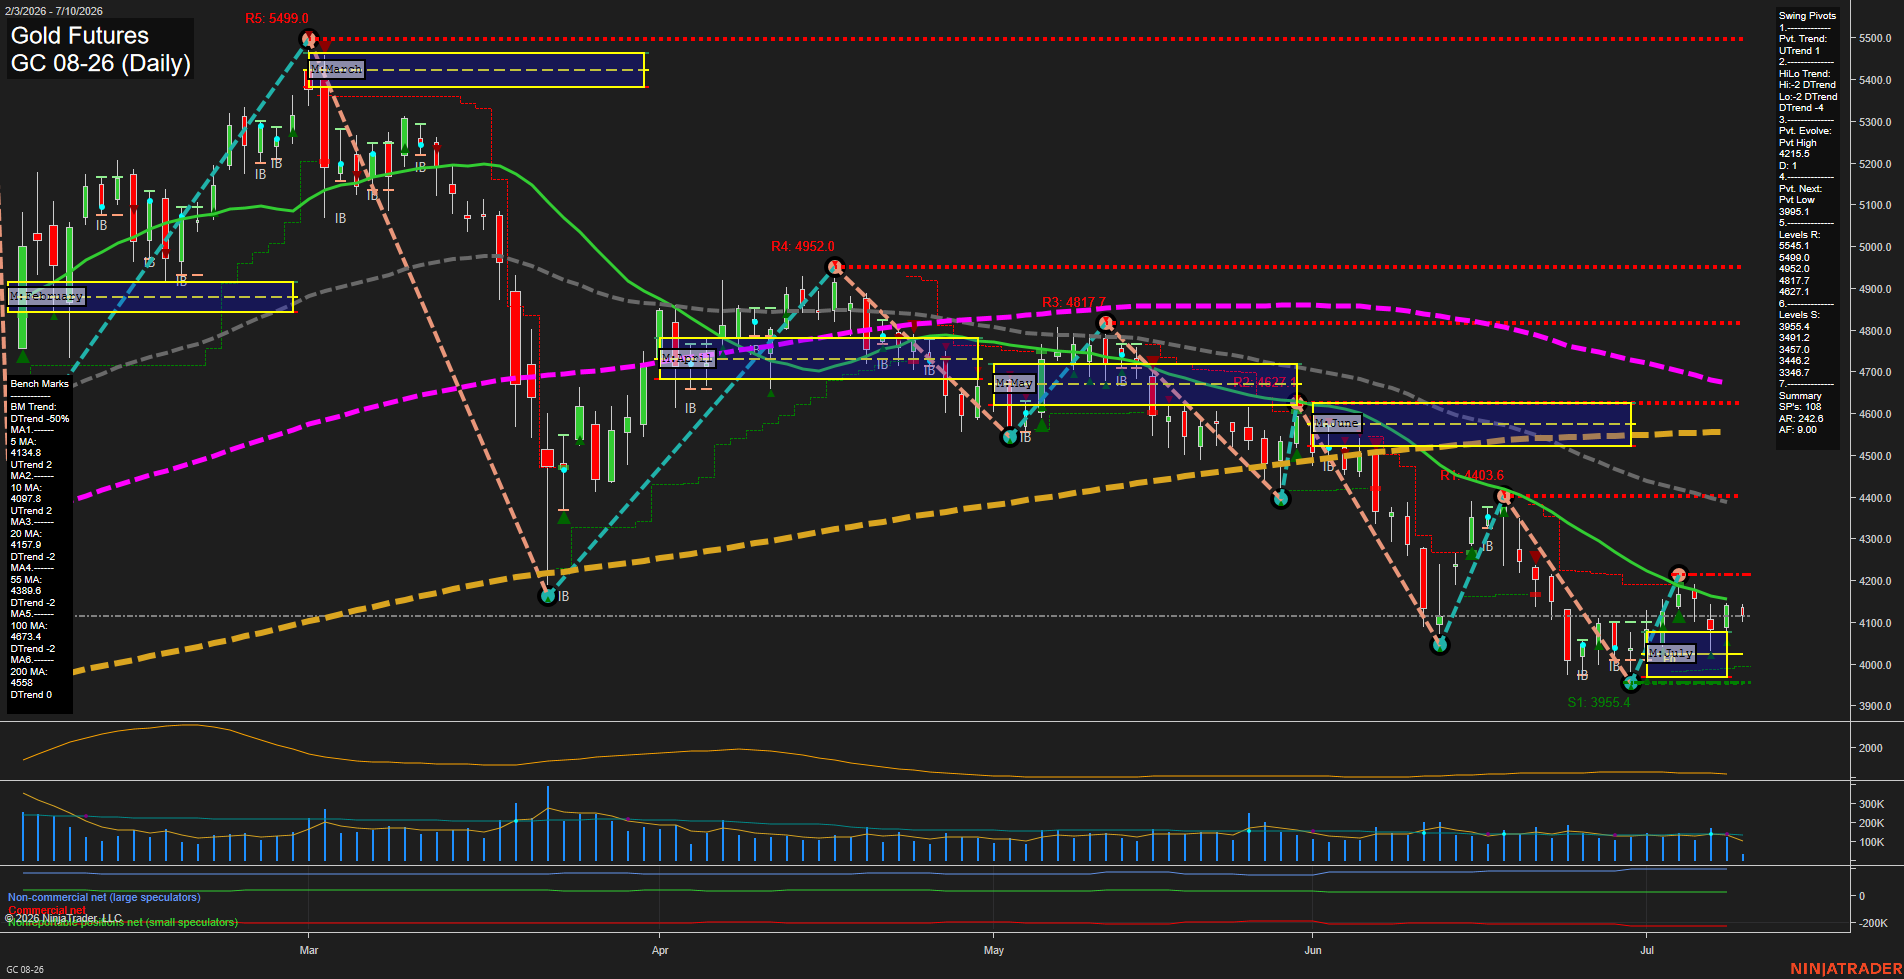
GC Daily View
Overall Rating
- Short-Term: Bearish
- Intermediate-Term: Bearish
- Long-Term: Bearish.
Key Insights Summary
Gold futures remain in a broad corrective downtrend with price pressed near the lower end of the recent range after a series of lower highs and lower lows. The weekly session fib structure stays bearish with price below the NTZ, while the monthly session still shows a constructive but fading intermediate recovery attempt above the monthly F0% area. Swing pivots are aligned bearish on both the short and intermediate horizon, and price remains under the 5, 10, 20, 55, 100, and 200 day benchmarks, reinforcing downside control across timeframes. The recent action shows a sharp selloff, a partial bounce, and then renewed weakness into early July, leaving the chart in a choppy, trend-retest phase rather than a clean bullish reversal. The current structure emphasizes rejection behavior around prior rally zones and continued pressure toward lower support references near the mid-3900s.
View charts on: AlphaWebTrader HTF Charts