NYSE pre-market futures are mixed as NVDA and USO gain while META, TSLA and IBIT slip, with Middle East tensions supporting crude and pressuring bonds.
Fundamentals: Middle East supply disruption risk remained the main market driver, with renewed U.S.-Iran hostilities and Strait of Hormuz concerns supporting crude prices. The move fed inflation worries, softer bond prices, and cautious currency action. Hawkish Fed minutes, higher Treasury yields, and mixed macro data from China, Germany, and U.S. consumers added to the risk-sensitive tone.
Technicals: The pre-market session shows a mixed setup across equities, ETFs, and index futures. NVDA and USO led prior-session gains, while META, TSLA, and IBIT finished lower. Futures analysis points to a broad long-term bullish backdrop in ES, NQ, YM, EMD, RTY, and FDAX, but near-term charts are mostly choppy, with several markets showing pullbacks, resistance tests, and short-term bearish rotation.
Pre-Market Trading 360° view Market Radar of: holidays, earnings, eco-news, market-news summary, news sentiment, prior session major ETFs, MAG7, Higher Time Frame Analysis Indices Futures Summary, and E-mini S&P500, Nasdaq 100, NYMEX Crude, Gold Futures Daily Chart analysis.
As of: July 9, 2026 07:16 CT
EcoNews Radar U.S. Events
| Day | Time | Impact | Event |
|---|---|---|---|
| Thu | 08:30 | Medium | Unemployment Claims |
EcoNews Summary
No qualifying high-impact EcoNews events are listed. The only item in the data is a medium-impact U.S. Unemployment Claims release on Thursday at 08:30, and it is not directly related to oil, crude inventories, energy prices, or petroleum supply, so it is excluded from the market-moving summary for indices futures day traders.
Event Notes:
- Thursday 08:30 – Medium USD Unemployment Claims: Weekly jobless claims measure the number of people filing for unemployment benefits for the first time. Traders monitor it for labor-market tone and broad risk sentiment.
Conclusion:
No qualifying high-impact EcoNews event is listed for the week. The single listed event is Thursday 08:30 USD Unemployment Claims, which sits in the medium-impact category and is not tied to energy or petroleum supply.
For full details visit: Forex Factory EcoNews
Market News Summary:
Middle East tensions drove the session narrative, lifting crude, pressuring bonds and currencies, and keeping inflation-sensitive assets in focus.
Primary Drivers & Risks:
- Primary Driver: Middle East supply disruption risk
- Primary Risk: Higher inflation and risk aversion
Tone:
Risk-sensitive and inflation-aware.
Stock Market / ETFs / Indices:
U.S. equity sentiment weakened as the S&P 500 target was cut on stalled momentum and a lower valuation ceiling, while tech-focused ETF commentary stayed constructive. Asian equities were not directly highlighted, but currency and bond moves pointed to broader caution.
Geopolitical:
Renewed U.S.-Iran hostilities, fresh strikes, and tensions around the Strait of Hormuz dominated the tape. Headlines centered on ceasefire fallout and shipping disruption concerns tied to the Middle East conflict.
Oil / Energy:
Crude prices rose repeatedly on fears of supply disruption, with reports of disrupted shipments and renewed strikes on Iran. WTI and Brent moved toward key resistance levels as shipping risks and inflation concerns remained elevated.
Gold / Metals:
Gold was steady to mixed amid renewed fighting and central bank purchases, while later price action faced pressure from hawkish Fed minutes and higher Treasury yields. Mining stocks gained support from firmer metals prices.
Fed / Financials:
Fed minutes and rising Treasury yields kept pressure on gold and broader financial conditions. Government bond prices fell across Asia-Pacific as crude-driven inflation concerns intensified.
Macro / Other:
Asian currencies consolidated but faced pressure from Middle East tensions. China data showed weaker consumer inflation and firmer producer inflation, while Germany’s exports rose despite war-related uncertainty. U.S. back-to-school spending forecasts fell, pointing to softer consumer sentiment.
Conclusion:
Crude oil strength from Middle East supply disruption risk is the main market driver. That theme fed directly into inflation concerns, weaker bonds, and softer risk appetite across indices, currencies, and rates.
Secondary drivers included hawkish Fed minutes, higher Treasury yields, and mixed macro data from China, Germany, and U.S. consumers. Gold and miners found support from stronger metals prices, but rate pressure and broad uncertainty limited the defensive bid.
Market News Sentiment
Market News Articles: 34
- Neutral: 44.12%
- Negative: 32.35%
- Positive: 23.53%
Sentiment Summary: Across 34 market news articles, sentiment is mostly neutral, with 44% neutral, 32% negative, and 24% positive coverage.
Conclusion: The overall tone is mixed to neutral, with neutral articles leading and negative coverage exceeding positive coverage.
GLD,Gold Articles: 12
- Negative: 50.00%
- Positive: 25.00%
- Neutral: 25.00%
Sentiment Summary: Gold-related coverage is mixed but tilted negative, with 50% negative, 25% positive, and 25% neutral articles across 12 reports.
Conclusion: The headline tone around GLD and gold is negative overall, with negative articles exceeding positive ones.
USO,Oil Articles: 14
- Positive: 57.14%
- Neutral: 35.71%
- Negative: 7.14%
Sentiment Summary: USO/oil coverage is mostly positive, with 57% positive, 36% neutral, and 7% negative articles across 14 items.
Conclusion: The oil news flow is biased toward positive sentiment, with neutral coverage still a significant share and limited negative tone.
Market Data Snapshot
ETF Snapshot of major stock market ETFs, Mag7, and others as of: July 9, 2026 07:16
Top Movers & Losers
- NVDA 204.12 Bullish 3.65% ▲
- USO 112.21 Bullish 3.02% ▲
- AAPL 313.39 Bullish 0.88% ▲
- META 603.12 Bearish -2.02% ▼
- TSLA 394.06 Bearish -2.19% ▼
- IBIT 35.23 Bearish -2.54% ▼
Major Index ETFs: SPY, QQQ, DIA, IWM, IJH
- QQQ 711.44 Bullish 0.28% ▲
- SPY 745.40 Bearish -0.31% ▼
- IWM 293.48 Bearish -0.92% ▼
- IJH 74.73 Bearish -0.98% ▼
- DIA 522.77 Bearish -1.07% ▼
Mixed tone across index ETFs: QQQ was the most bullish mover at +0.28%, while DIA was the most bearish mover at -1.07%; SPY also slipped -0.31%, with IWM -0.92% and IJH -0.98% showing broader downside pressure.
Mag 7 Stocks: AAPL, MSFT, GOOG, AMZN, META, NVDA, TSLA
- NVDA 204.12 Bullish 3.65% ▲
- AAPL 313.39 Bullish 0.88% ▲
- AMZN 243.62 Bearish -0.96% ▼
- GOOG 358.71 Bearish -1.35% ▼
- MSFT 383.34 Bearish -1.41% ▼
- META 603.12 Bearish -2.02% ▼
- TSLA 394.06 Bearish -2.19% ▼
Mixed Mag7 tone: NVDA led as the most bullish mover at +3.65%, AAPL was also bullish at +0.88%, while TSLA was the most bearish mover at -2.19%; META -2.02%, MSFT -1.41%, GOOG -1.35%, and AMZN -0.96% were also bearish.
Cross-Market ETFs: TLT, GLD, USO, IBIT
- USO 112.21 Bullish 3.02% ▲
- TLT 84.36 Bearish -0.22% ▼
- GLD 374.45 Bearish -0.81% ▼
- IBIT 35.23 Bearish -2.54% ▼
Mixed: USO is the most bullish mover at +3.02%, while IBIT is the most bearish mover at -2.54%; GLD is also bearish at -0.81%, and TLT is near-flat to slightly bearish at -0.22%.
ETF, Mag7, and Cross-Market ETF Insights
Overall Tone
Mixed, with equities showing selective risk-on leadership from NVDA and QQQ while broader index ETFs and several large-cap names remain under pressure.
Equity ETFs and Mag7:
SPY -0.31%, QQQ +0.28%, IWM -0.92%, IJH -0.98%, and DIA -1.07% show a mixed-to-negative tape, with QQQ narrowly positive while the other major index ETFs are lower. Within Mag7, NVDA is the clear leader at +3.65%, while TSLA -2.19% and META -2.02% are the most bearish movers; MSFT -1.41%, GOOG -1.35%, and AMZN -0.96% also lean negative, with AAPL comparatively firm at +0.88%. The group is not broadly aligned, with leadership concentrated in NVDA and QQQ while most index ETFs and several megacaps remain under pressure.
Cross-Market ETFs:
USO is the strongest cross-market mover at +3.02%, contrasting with a softer tone in hedges and alternatives: TLT is near-flat to slightly lower at -0.22%, GLD is weaker at -0.81%, and IBIT is the most bearish mover in the group at -2.54%. The mix suggests commodity strength is diverging from equity softness, while gold, Treasuries, and bitcoin exposure are not confirming a broad defensive bid.
Futures Indices – Higher Time Frame Analysis
Summary of the current state of US Indices Futures based on higher time-frame (HTF) technical analysis as of: 2026-07-09: 07:16 CT.
US Indices Futures
- ES YSFG/MSFG bullish, WSFG bearish, above 20/55/100/200-day benchmarks, swing trend intact; key pivots 7265.50 support, 7693.50 resistance.
- NQ YSFG bullish, MSFG/WSFG below F0%, daily benchmarks mixed but broader stack supportive; swing trend up, key pivots 28909.75 support, 30450.25 resistance.
- YM YSFG/MSFG bullish, WSFG bearish, above rising benchmarks and new highs near 53586; swing structure up, pivot support 52343 area, resistance 53573+.
- EMD YSFG bullish, MSFG/WSFG below F0%, price above all major benchmarks; swing trend up, pivot high 3892.4, pivot low 3834.6.
- RTY YSFG bullish, MSFG/WSFG below F0%, below weekly/monthly NTZ bands, above major benchmarks; swing trend up, 2820.2 support, 3088.4 resistance.
- FDAX YSFG bullish, MSFG/WSFG bearish, above 20/55/100/200-day benchmarks; swing trend up, 24958 support, 26064 resistance/high.
Overall State
- Short-Term: Bearish
- Intermediate-Term: Bullish
- Long-Term: Bullish
Conclusion
HTF structure across US indices remains aligned to the long side at the yearly and monthly session fib grids, with price generally above the major benchmark stack and swing pivots still in uptrend formation. Weekly session fib grids are softer on ES, YM, RTY, and FDAX, while NQ, EMD, and RTY daily action show pullback or rotation beneath recent pivot zones. ES, YM, and EMD hold the clearest benchmark strength; NQ, RTY, and FDAX show deeper short-term retracements from recent highs. The dominant correlation remains a broader bullish long-term structure with short-term corrective weakness and resistance tests across the upper pivot ranges.
Note: Intra-day counter-trend pullbacks or retracements may occur, HTF is context for informational usage and market structure. Glossary: Session Fib Grids periods of YSFG:’Yearly’, MSFG:’Monthly’, WSFG:’Weekly’
For full details visit: AlphaWebTrader Technicals
ES Daily View
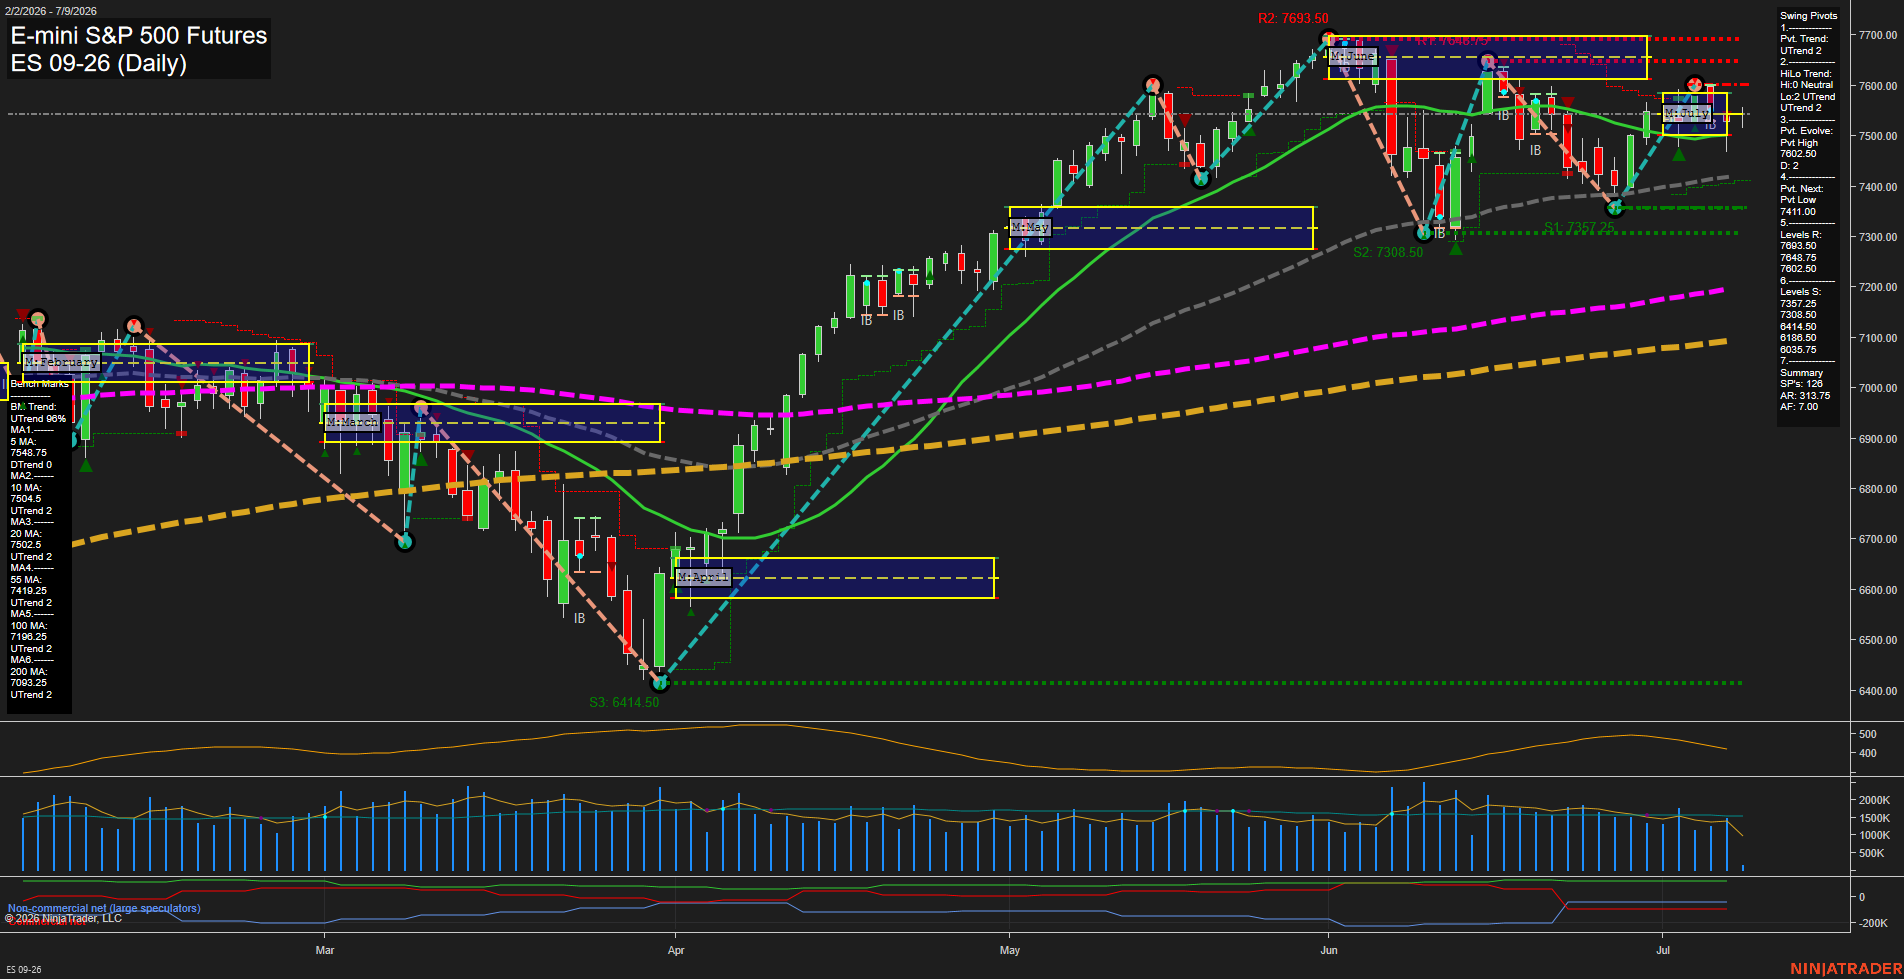
Overall Rating
- Short-Term: Bearish
- Intermediate-Term: Bullish
- Long-Term: Bullish.
Key Insights Summary
Price is trading in a mixed short-term structure with the weekly fib grid still below zero and the recent signal set leaning to the downside, while the broader monthly and yearly fib grids remain positive and aligned higher. The daily benchmark stack is constructive across the 10, 20, 55, 100, and 200 day measures, but the last price sits below the 5 day and under the prior pivot high zone, leaving the tape in a pullback-and-retest phase rather than a clean breakout. Swing pivots still show an upward short-term pivot trend, yet the intermediate hi/lo structure is neutral and the next pivot reference is a lower low, which reflects consolidation after the prior rally. Overall the chart presents a long-term uptrend with an intermediate bullish bias, but near-term price action is choppy and rotational around key resistance and support bands.
View charts on: AlphaWebTrader HTF Charts
NQ Daily View
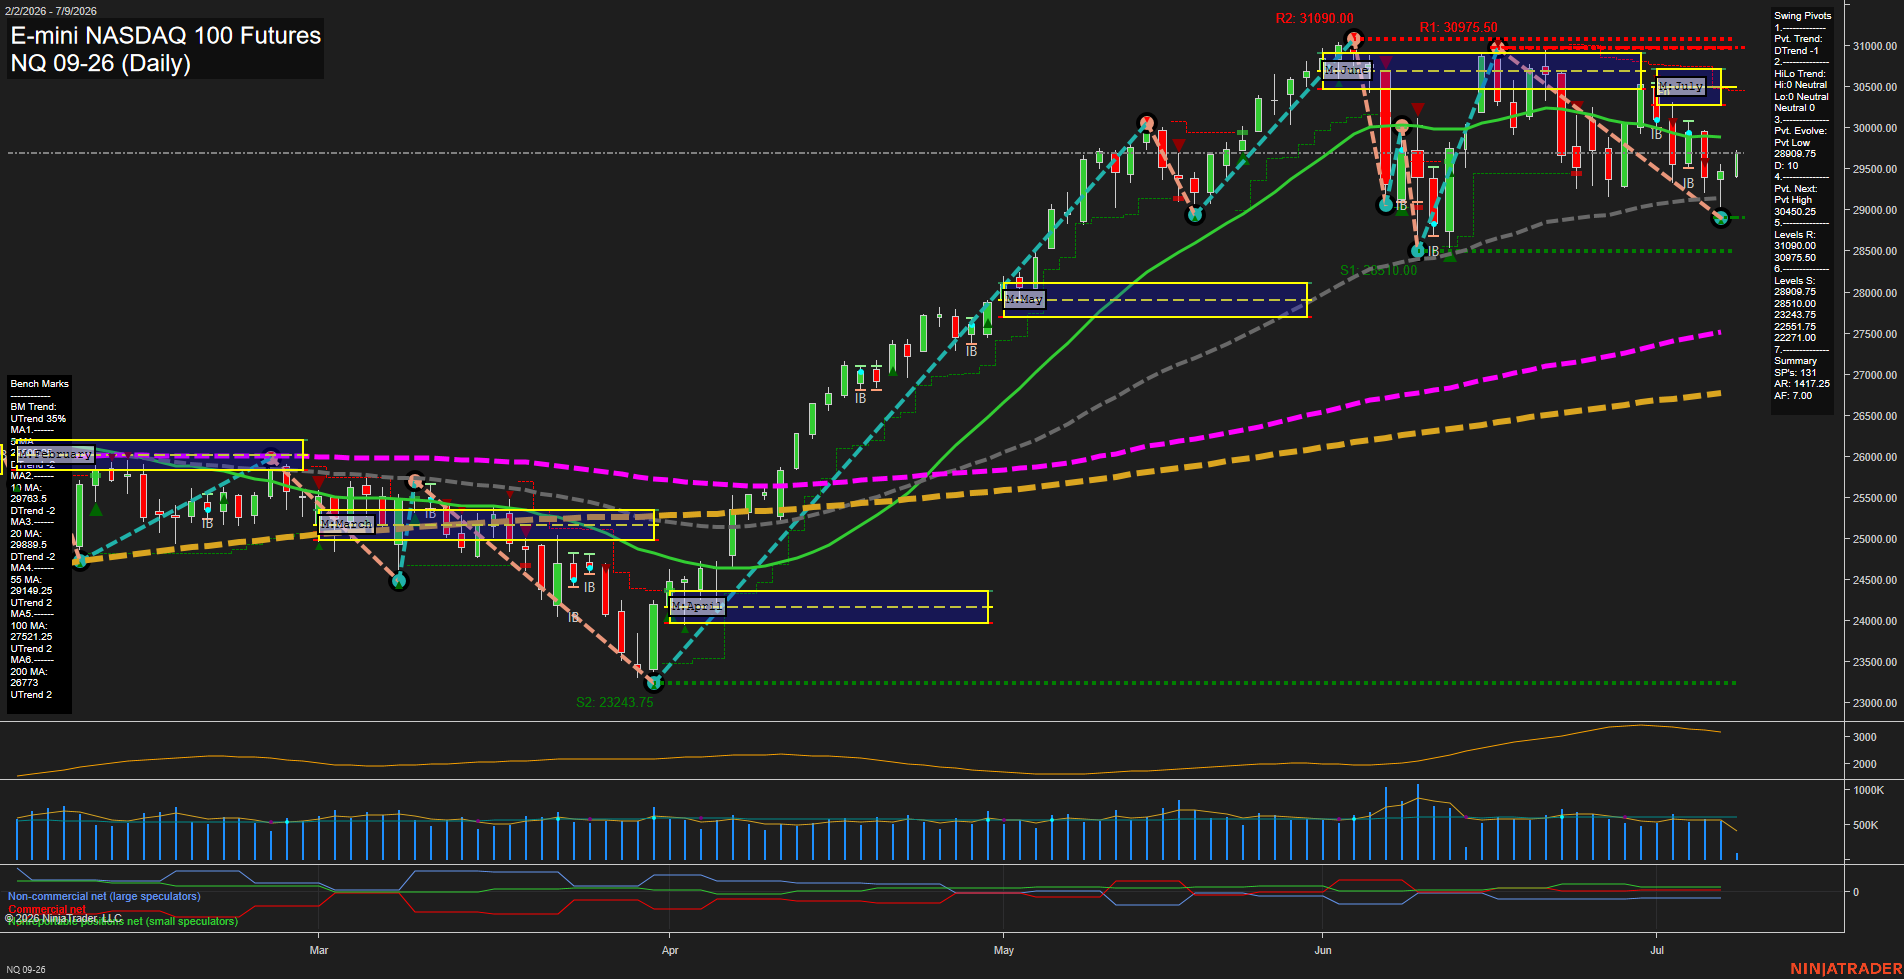
Overall Rating
- Short-Term: Bearish
- Intermediate-Term: Bearish
- Long-Term: Bullish.
Key Insights Summary
Price is trading below the weekly and monthly session fib grids, with the short-term pivot structure still in a DTrend and the active swing map pointing to a lower pivot low at 28909.75 before any pivot reversal confirmation to the 30450.25 area. Daily benchmarks are mixed but tilted weak in the near term, with the 5, 10, and 20 day averages still pressing below price and the 55/100/200 day averages holding a broader bullish backdrop. The tape reflects a pullback phase inside a larger year-to-date uptrend, with recent rejection from the 30975.50 to 31090.00 resistance band and price rotating back into the mid-29k zone. From a futures swing trader view, the dominant theme is a short-term corrective decline within a larger bullish long-term structure, showing consolidation, lower highs, and support tests around the prior swing pivot zone.
View charts on: AlphaWebTrader HTF Charts
CL Daily View
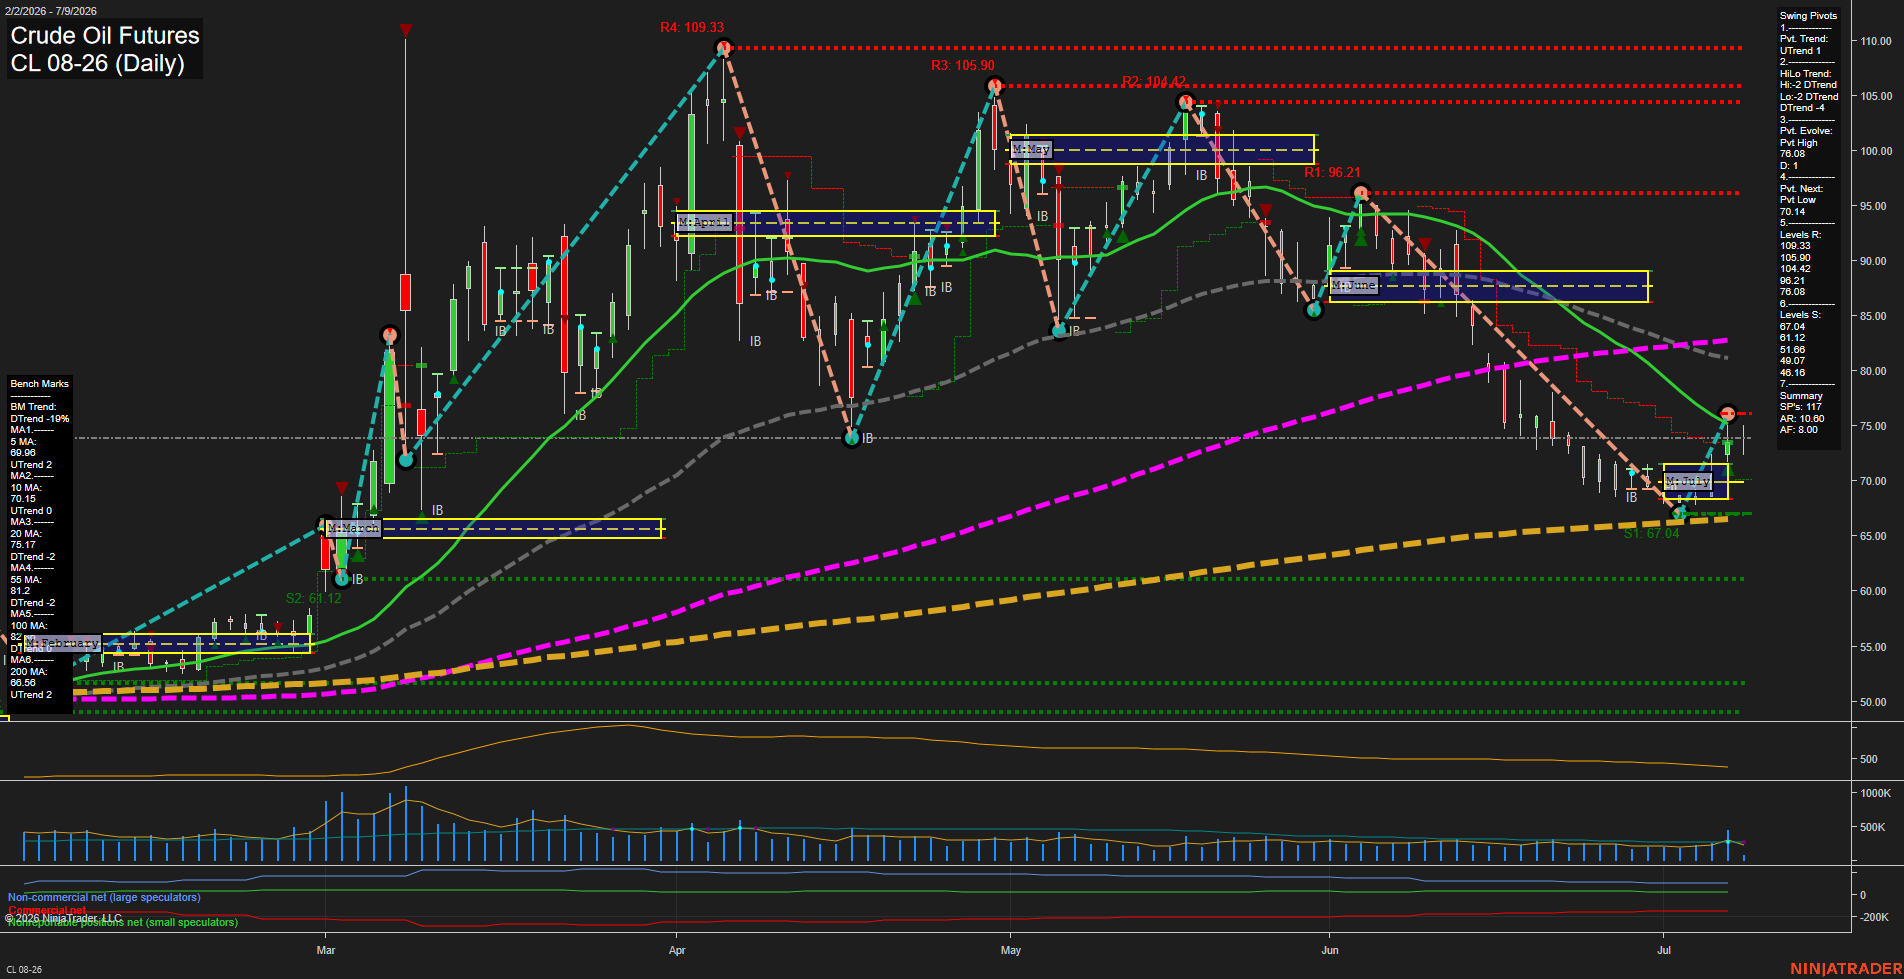
Overall Rating
- Short-Term: Bullish
- Intermediate-Term: Bearish
- Long-Term: Neutral.
Key Insights Summary
Crude oil is in a recovery phase after a sharp June decline, with price rebounding off the mid-to-upper 60s and now pressing back into the low-to-mid 70s. The short-term structure has turned constructive with the current pivot trend back to UTrend and recent long signals firing across TR120, WSFG, MSFG, and TR720. The weekly and monthly session fib grids both show price above their F0%/NTZ bias, which supports the rebound narrative. That said, the intermediate trend remains pressured because price is still trading below the 20, 55, and 100 day benchmarks, while the HiLo pivot trend is still DTrend, showing the broader swing structure has not fully repaired. The chart is transitioning from a selloff and lower-high sequence into a bounce and consolidation zone, with resistance layered near 76.08 and then 96.21, while support is clustered near 70.14 and 67.04. From a futures swing trader point of view, the tape is improving tactically, but the larger swing context is still working through the aftermath of the prior downtrend.
View charts on: AlphaWebTrader HTF Charts
GC Daily View
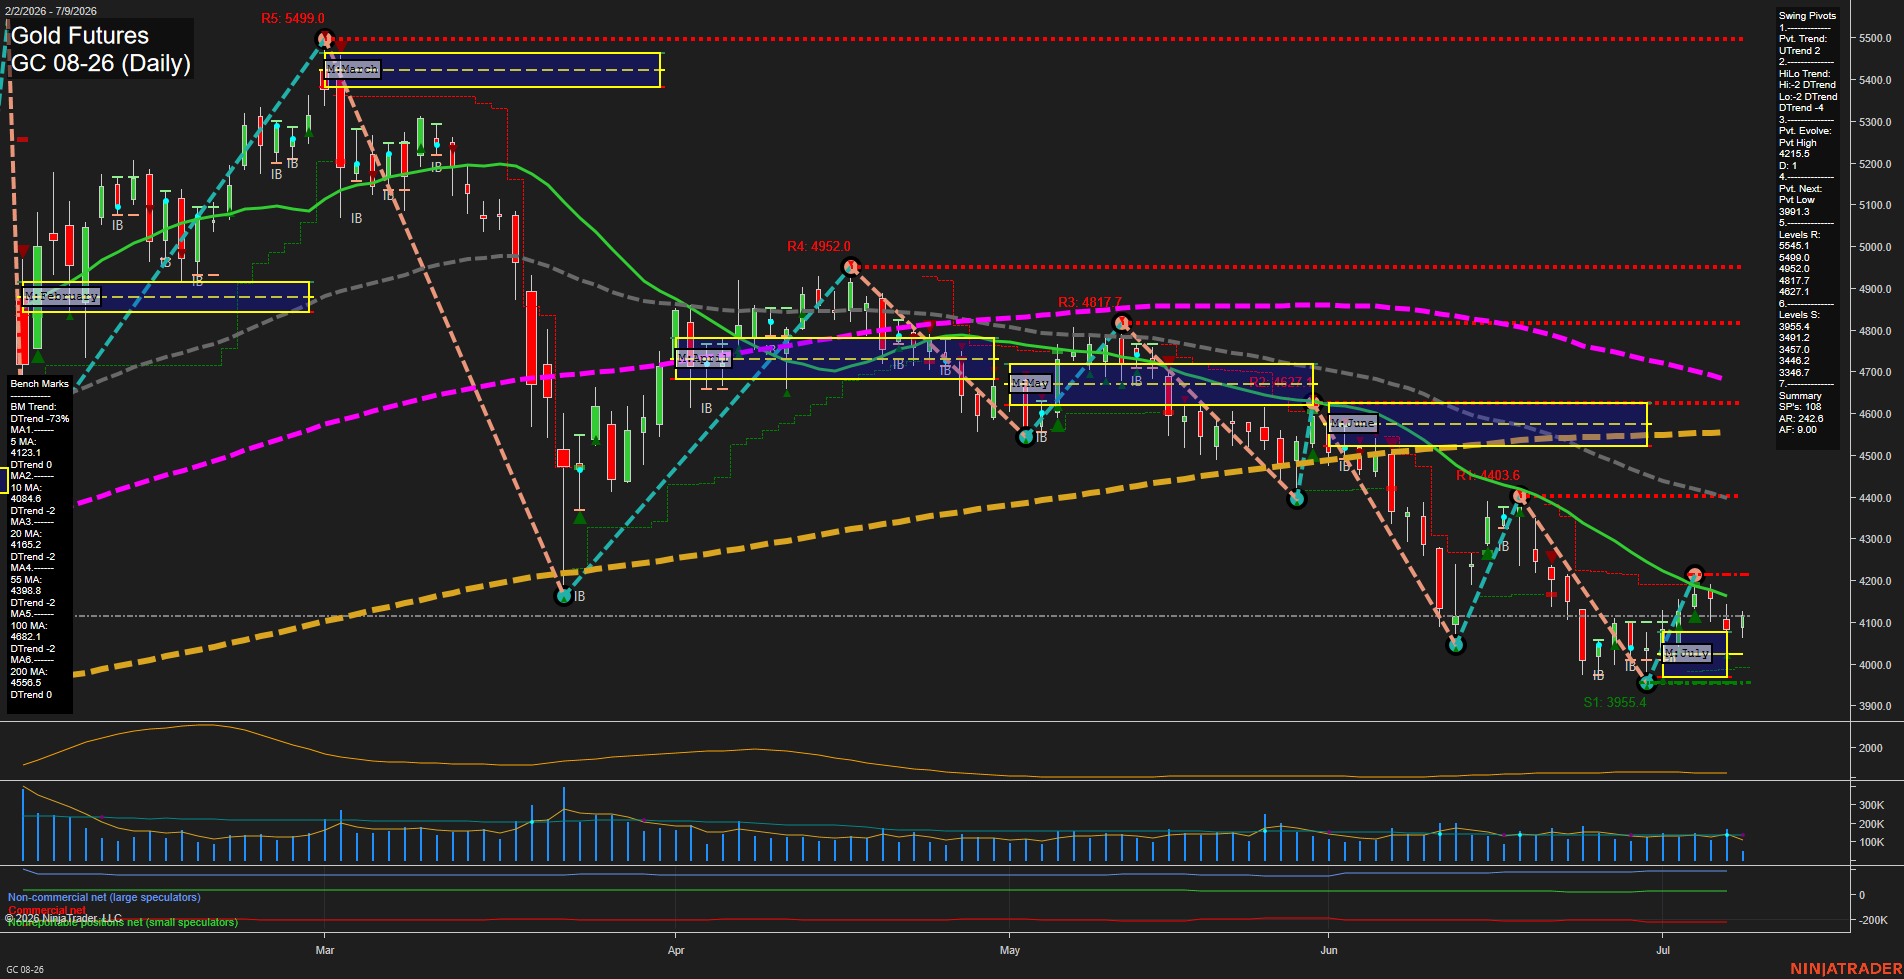
Overall Rating
- Short-Term: Bearish
- Intermediate-Term: Bearish
- Long-Term: Bearish.
Key Insights Summary
Gold futures are trading in a lower-high, lower-low sequence with price pressing below the short-term benchmark cluster and under the declining 20/55/100/200-day structure. The short-term pivot trend is still marked UTrend, but the broader HiLo pivot structure remains DTrend, reflecting a market that has been unable to reclaim prior resistance zones after repeated rejection from the 4,200 to 4,400 area. Weekly session fib remains below bias while the monthly session fib is still positive, creating a mixed but fragile medium-term backdrop. Recent trade signals show a shift from the July 7 long to the July 8 short, matching the latest swing failure and downside continuation into the July low box. Overall, the chart presents a bearish swing profile with rally attempts getting sold into overhead resistance and momentum still aligned with the downside trend.
View charts on: AlphaWebTrader HTF Charts