NYSE pre-market action turns cautious as U.S. futures ease on Middle East tensions, rising oil, mixed ETF moves, and focus on yields and Fed signals.
Fundamentals: Equity futures are lower after weekend escalation in the Middle East, with Nasdaq 100 contracts leading declines as oil prices rise and inflation concerns build. Markets are also tracking yields, Federal Reserve commentary, and a busy week of earnings and data, while gold, bonds, and energy stocks reflect the broader risk-off backdrop.
Technicals: The pre-market session shows mixed ETF action after the prior close, with META and NVDA leading gains while GOOG, IWM, and AMZN finished lower. Futures and index frameworks remain split across time horizons: ES and YM stay broadly constructive, NQ is weaker near resistance, while RTY and FDAX hold longer-term uptrends despite short-term pullbacks.
Pre-Market Trading 360° view Market Radar of: holidays, earnings, eco-news, market-news summary, news sentiment, prior session major ETFs, MAG7, Higher Time Frame Analysis Indices Futures Summary, and E-mini S&P500, Nasdaq 100, NYMEX Crude, Gold Futures Daily Chart analysis.
As of: July 13, 2026 07:16 CT
Earnings Radar
Monitoring for earnings releases by the Magnificent 7, AI-tech-related firms, and major financial institutions.
- MS Release: 2026-07-15 T:BMO
- BAC Release: 2026-07-14 T:BMO
- C Release: 2026-07-14 T:BMO
- GS Release: 2026-07-14 T:BMO
- JPM Release: 2026-07-14 T:BMO
- WFC Release: 2026-07-14 T:BMO
Conclusion: With JPM, BAC, C, GS, and WFC all reporting BMO on 2026-07-14, followed by MS on 2026-07-15, the next two sessions carry concentrated bank-sector and broad index sensitivity. Index futures can show tighter ranges, headline-driven moves, and heavier reaction to financials-related guidance and tone.
For full details visit: Yahoo Earnings Calendar
EcoNews Radar U.S. Events
| Day | Time | Impact | Event |
|---|---|---|---|
| Tue | 08:30 | High | Core CPI m/m |
| Tue | 08:30 | High | Core CPI y/y |
| Tue | 08:30 | High | CPI m/m |
| Tue | 08:30 | High | CPI y/y |
| Tue | 10:00 | High | Fed Chairman Warsh Testifies |
| Wed | 08:30 | High | Core PPI m/m |
| Wed | 08:30 | High | PPI m/m |
| Wed | 10:00 | High | Fed Chairman Warsh Testifies |
| Wed | 10:30 | Low | Crude Oil Inventories |
| Thu | 08:30 | Medium | Core Retail Sales m/m |
| Thu | 08:30 | Medium | Philly Fed Manufacturing Index |
| Thu | 08:30 | Medium | Retail Sales m/m |
| Thu | 08:30 | Medium | Unemployment Claims |
| Fri | 10:00 | Medium | Prelim UoM Consumer Sentiment |
| Fri | 10:00 | Medium | Prelim UoM Inflation Expectations |
EcoNews Summary
Tuesday carries the week’s main market catalyst set, led by U.S. inflation data and Fed Chairman Warsh testimony. Wednesday adds another inflation layer through PPI, plus crude oil inventories, which ties into energy-price sensitivity. Thursday and Friday include medium-impact U.S. data, but the main market-moving focus remains on Tuesday and Wednesday.
Event Notes:
- Tuesday 08:30 High USD Core CPI m/m: Measures monthly consumer prices excluding food and energy; a key inflation gauge watched for policy and rate expectations.
- Tuesday 08:30 High USD Core CPI y/y: Measures annual core inflation excluding food and energy; traders monitor it for broader inflation trend confirmation.
- Tuesday 08:30 High USD CPI m/m: Measures monthly change in overall consumer prices; important for inflation-sensitive rates and index volatility.
- Tuesday 08:30 High USD CPI y/y: Measures annual change in overall consumer prices; a central input for inflation outlook and Fed repricing.
- Tuesday 10:00 High USD Fed Chairman Warsh Testifies: Fed testimony is monitored for policy signals, inflation emphasis, and changes in tone that affect rate expectations.
- Wednesday 08:30 High USD Core PPI m/m: Measures monthly producer prices excluding food and energy; traders watch it for upstream inflation pressure.
- Wednesday 08:30 High USD PPI m/m: Measures monthly producer price changes; relevant as a pipeline indicator for consumer inflation.
- Wednesday 10:00 High USD Fed Chairman Warsh Testifies: Additional Fed testimony session that can add policy-related volatility and reinforce or offset prior messaging.
- Wednesday 10:30 Low USD Crude Oil Inventories: Measures weekly U.S. crude stock changes; monitored for petroleum supply conditions and energy-price impact.
Conclusion:
Tuesday is the most important day of the week, with the 08:30 USD CPI and Core CPI releases as the primary market-moving events, followed by Fed Chairman Warsh testimony at 10:00. Market momentum and volume often slow ahead of major events such as CPI, with increased volatility at release time. News events around the 10 AM time cycle act as catalysts for reversals or continuations. Wednesday adds another inflation check through PPI and a crude oil inventories update, which matters for energy pricing and inflation context.
For full details visit: Forex Factory EcoNews
Market News Summary:
Equity futures, commodities, and rate expectations are all reacting to Middle East escalation, with oil and inflation risks pressing on indices.
Primary Drivers & Risks:
- Primary Driver: US-Iran conflict and oil surge
- Primary Risk: Inflation, yields, and risk-off pressure
Tone:
Defensive, cautious, and event-driven.
Stock Market / ETFs / Indices:
Stock futures slipped after the weekend escalation around the Strait of Hormuz, while Nasdaq 100 futures led the decline. Prior coverage also pointed to the S&P 500 consolidating near a bullish breakout setup and to QQQ’s long-run strength versus the S&P 500.
Geopolitical:
US and Iranian strikes intensified across the Gulf, with conflicting statements over the Strait of Hormuz status. Reports described shipping traffic going dark and regional supply disruption risk rising.
Oil / Energy:
Oil prices jumped more than 3% on the strikes, with Brent crude quoted near $78.68 a barrel. Europe’s jet fuel stocks were described as very thin, and renewed attacks around the strait added supply disruption concerns.
Gold / Metals:
Gold and silver showed mixed moves, with one report noting gold and silver resilience on official accumulation and tight mine supply. Another report said gold fell in early Asian trade as higher oil prices revived inflation concerns and firmed the dollar.
Fed / Financials:
Warsh’s testimony and the rate outlook drew attention as stubborn inflation and a steadier economy put a rate increase in play. AI-related bond issuance also weighed on bond prices and added pressure to financial conditions.
Macro / Other:
Markets face a week of inflation data, Fed commentary, and earnings. Commentary also highlighted momentum remaining intact for stocks, while other items covered SpaceX’s Nasdaq-100 entry, Shein’s IPO move, and AI policy concerns.
Conclusion:
Primary pressure comes from the Middle East escalation, the oil spike, and the immediate impact on futures. That backdrop feeds inflation concerns and keeps attention on the Fed, yields, and sector rotation.
Secondary drivers include technical market resilience, index composition changes, and earnings-related cross-currents. Gold, bonds, and Europe’s fuel supply remain part of the broader risk set tied to the same geopolitical shock.
Market News Sentiment
Market News Articles: 26
- Neutral: 65.38%
- Negative: 19.23%
- Positive: 15.38%
Sentiment Summary: Market news on indices futures is predominantly neutral at 65%, with negative coverage at 19% and positive coverage at 15% across 26 articles.
Conclusion: The news flow is mixed but weighted toward neutral, with limited positive and negative bias in the current snapshot.
GLD,Gold Articles: 5
- Positive: 40.00%
- Negative: 40.00%
- Neutral: 20.00%
Sentiment Summary: GLD and gold news sentiment is mixed, with 40% positive, 40% negative, and 20% neutral coverage across 5 articles.
Conclusion: The overall tone is balanced and does not show a clear directional bias.
USO,Oil Articles: 8
- Neutral: 50.00%
- Positive: 37.50%
- Negative: 12.50%
Sentiment Summary: USO oil article sentiment is mixed and near-neutral, with 50% neutral, 38% positive, and 13% negative coverage across 8 articles.
Conclusion: The oil news flow is balanced overall, with neutral tone dominating and positive coverage exceeding negative coverage.
Market Data Snapshot
ETF Snapshot of major stock market ETFs, Mag7, and others as of: July 13, 2026 07:16
Top Movers & Losers
- META 669.21 Bullish 5.97% ▲
- NVDA 210.96 Bullish 4.03% ▲
- IBIT 36.23 Bullish 1.17% ▲
- GOOG 355.03 Bearish -0.34% ▼
- IWM 295.99 Bearish -0.42% ▼
- AMZN 245.34 Bearish -0.69% ▼
Major Index ETFs: SPY, QQQ, DIA, IWM, IJH
- SPY 754.95 Bullish 0.43% ▲
- QQQ 725.51 Bullish 0.31% ▲
- DIA 525.78 Bullish 0.30% ▲
- IJH 75.67 Bearish -0.04% ▼
- IWM 295.99 Bearish -0.42% ▼
Mixed breadth across the index ETF complex: SPY +0.43% and QQQ +0.31% led the upside, with DIA also Bullish at +0.30%; IJH was near-flat and Bearish at -0.04%, while IWM was the most bearish mover at -0.42%.
Mag 7 Stocks: AAPL, MSFT, GOOG, AMZN, META, NVDA, TSLA
- META 669.21 Bullish 5.97% ▲
- NVDA 210.96 Bullish 4.03% ▲
- TSLA 407.76 Bullish 0.30% ▲
- MSFT 385.10 Bullish 0.19% ▲
- AAPL 315.32 Bearish -0.28% ▼
- GOOG 355.03 Bearish -0.34% ▼
- AMZN 245.34 Bearish -0.69% ▼
Mixed Mag7 tone: META led as the most bullish mover at +5.97%, followed by NVDA at +4.03%; TSLA at +0.30% and MSFT at +0.19% were near-flat. On the downside, AMZN was the most bearish mover at -0.69%, with GOOG at -0.34% and AAPL at -0.28% also mildly lower.
Cross-Market ETFs: TLT, GLD, USO, IBIT
- IBIT 36.23 Bullish 1.17% ▲
- TLT 84.47 Bearish -0.02% ▼
- USO 108.70 Bearish -0.28% ▼
- GLD 377.01 Bearish -0.31% ▼
Mixed, with IBIT the most bullish mover at +1.17%, while GLD was the most bearish mover at -0.31%; USO followed at -0.28% and TLT was near-flat at -0.02%.
ETF, Mag7, and Cross-Market ETF Insights
Overall Tone
Mixed to Bullish overall, with equity leadership still positive while cross-market hedges and commodities are mostly near-flat to mildly softer, signaling a risk-on lean but not broad conviction.
Equity ETFs and Mag7:
Major index ETFs are broadly aligned to the upside, led by SPY +0.43% and QQQ +0.31%, while DIA +0.30% is steady and IWM -0.42% and IJH -0.04% lag. Mag7 leadership is selective and strong: META stands out as the most bullish mover at +5.97%, NVDA follows at +4.03%, while AMZN is the most bearish mover at -0.69% and GOOG is also softer at -0.34%.
Cross-Market ETFs:
Cross-market signals are mostly Mixed, with IBIT showing the clearest bullish move at +1.17% versus TLT at -0.02%, which is effectively flat. GLD -0.31% and USO -0.28% are modestly softer, so the group does not show broad hedging or commodity strength alongside equities.
Futures Indices – Higher Time Frame Analysis
Summary of the current state of US Indices Futures based on higher time-frame (HTF) technical analysis as of: 2026-07-13: 07:16 CT.
US Indices Futures
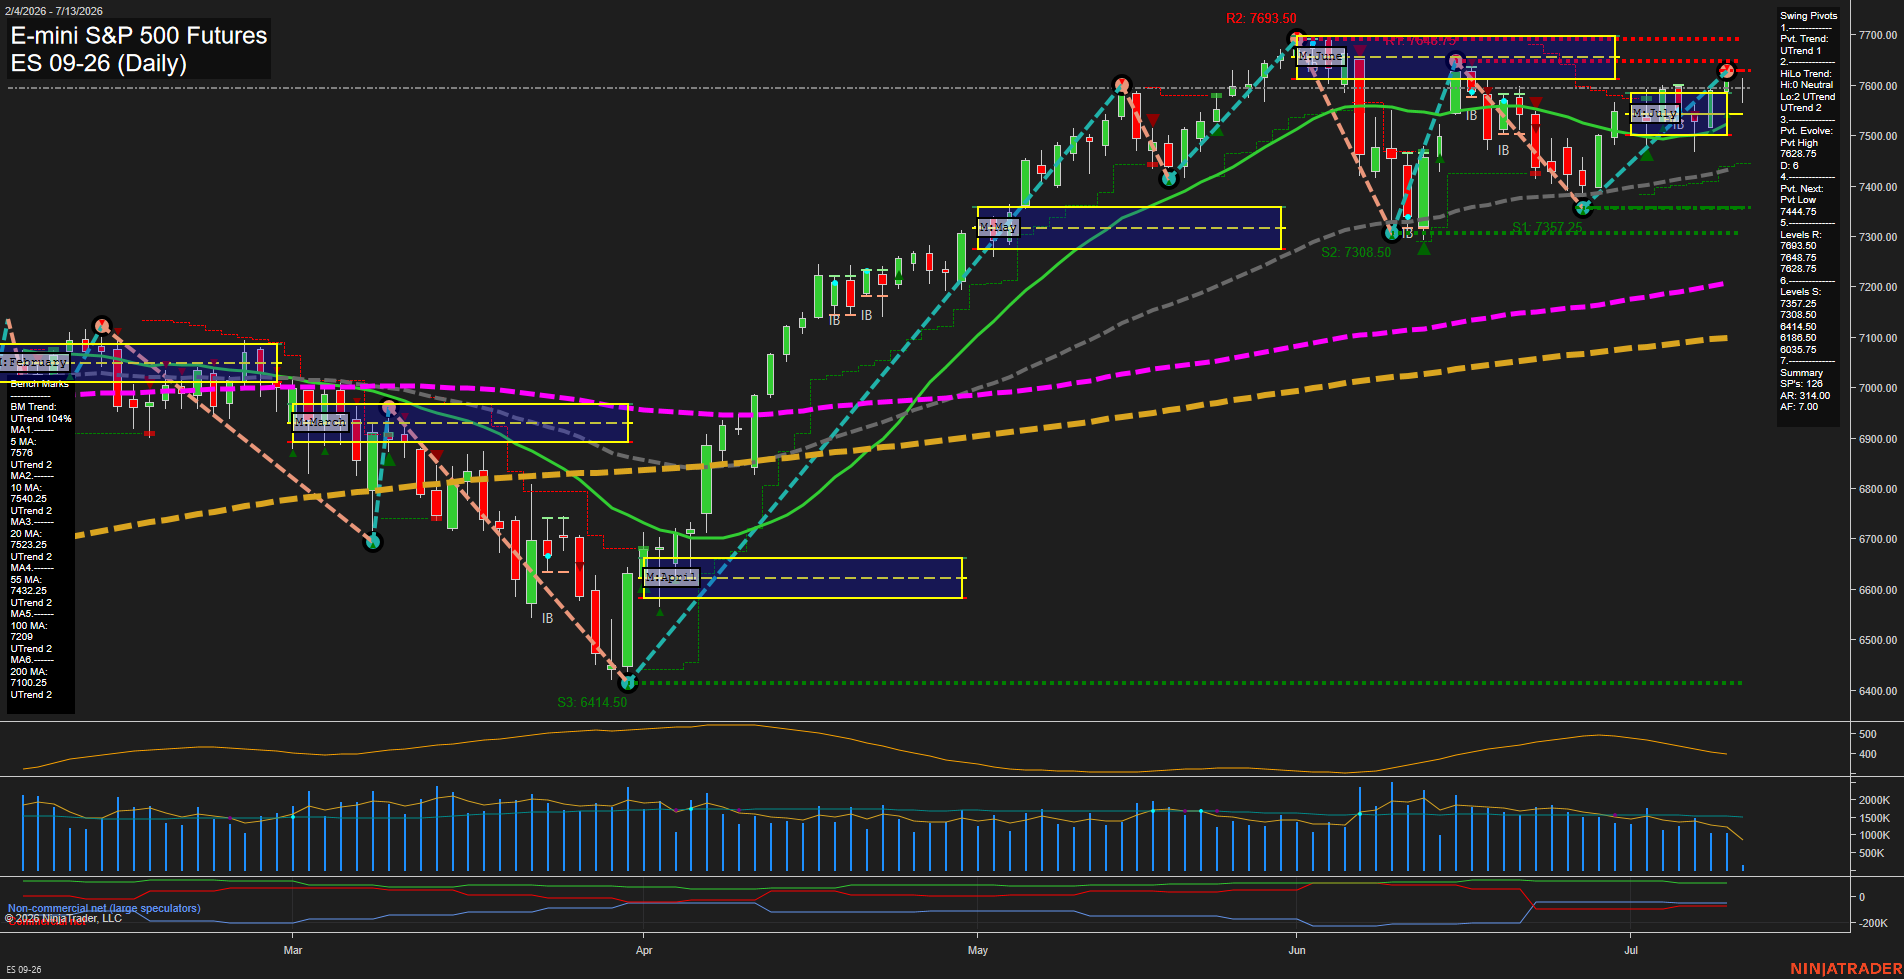
- ES YSFG and MSFG remain above F0%, WSFG below F0% with neutral short term, benchmarks rising above 20/55/100/200, swing trend up, resistance near 7689.50.
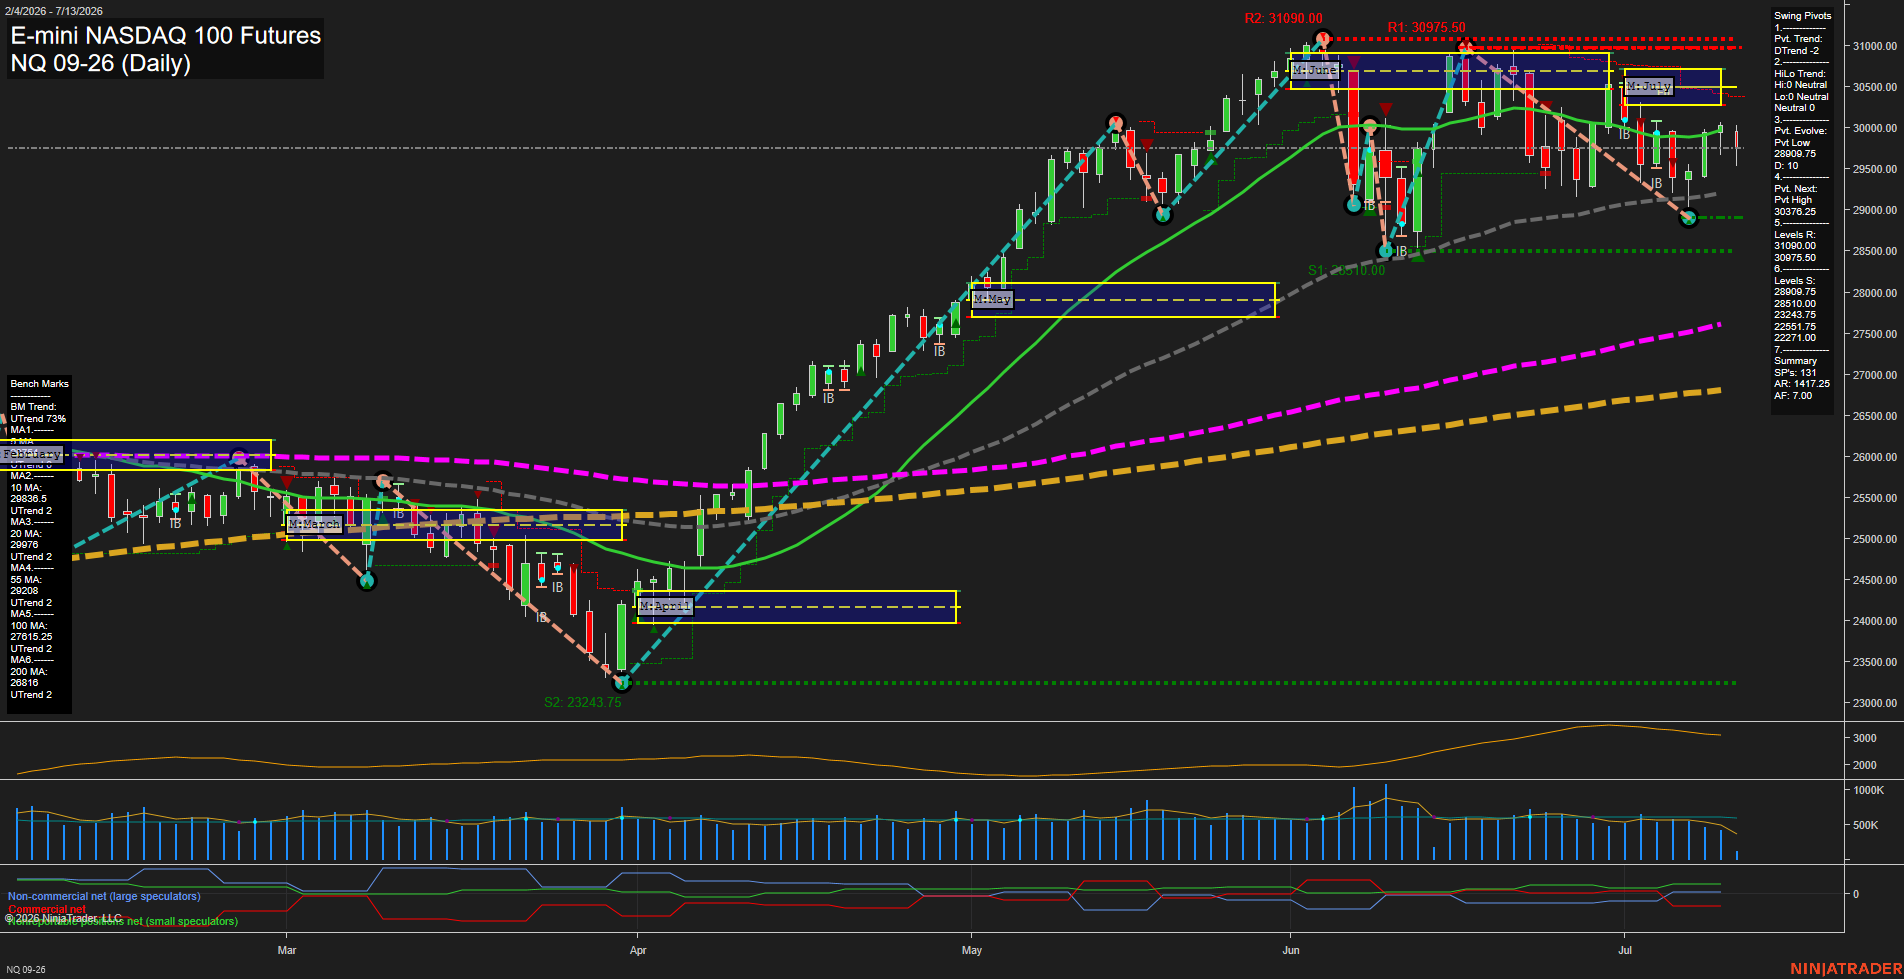
- NQ YSFG remains constructive, MSFG and WSFG below F0% with bearish short and intermediate tone, benchmarks still above 20/55/100/200, pivot high 30376.25, support 28909.75 and 28510.00.
- YM YSFG, MSFG, WSFG all above F0%, bullish across frames, benchmarks stacked higher, swing UTrend intact, resistance near 53656, supports at 52343, 51026, 50136, 48986.
- EMD YSFG bullish, MSFG below F0% with intermediate bearish tone, WSFG above F0%, benchmarks rising across horizons, pivot UTrend intact, resistance near upper range, support in upper 3680s and mid-3600s.
- RTY YSFG above F0% and WSFG bullish, MSFG below F0% with intermediate bearish tone, benchmarks rising, swing UTrend at 3068.4, support 2943.4, pivot reference 3047.0.
- FDAX YSFG, MSFG, WSFG aligned above F0%, benchmarks all rising, weekly UTrend intact, fresh high 26064, supports at 24892, 24130, 23827, 22777.
Overall State
- Short-Term: Neutral
- Intermediate-Term: Bullish
- Long-Term: Bullish
Conclusion
HTF structure remains broadly constructive across US indices, with YSFG and longer benchmark alignment firm in ES, YM, RTY, and FDAX. NQ shows the clearest short and intermediate weakness, with MSFG and WSFG below F0% and price under nearby pivot resistance. ES remains mixed near the upper range, while YM, EMD, RTY, and FDAX keep higher-timeframe uptrends intact despite short-term pullbacks or consolidation. Across the group, monthly and weekly session fib grids, rising benchmark stacks, and higher-high/higher-low swing structures continue to define the long-term backdrop.
Note: Intra-day counter-trend pullbacks or retracements may occur, HTF is context for informational usage and market structure. Glossary: Session Fib Grids periods of YSFG:’Yearly’, MSFG:’Monthly’, WSFG:’Weekly’
For full details visit: AlphaWebTrader Technicals
ES Daily View
Overall Rating
- Short-Term: Neutral
- Intermediate-Term: Bullish
- Long-Term: Bullish.
Key Insights Summary
ES remains in a broader uptrend with all major benchmarks stacked positively and price still holding above the 20, 55, 100, and 200 day averages. The daily structure shows a recent push to fresh highs followed by a pullback from the upper pivot zone, leaving a more tactical two-way tone near the top of the range. Weekly fib structure is still below its F0%/NTZ centerline, which keeps the short-term backdrop mixed to neutral, while the monthly and yearly fib grids remain constructive and supportive of the larger bullish cycle. Swing pivot structure is still aligned upward, but the latest action reflects a test-and-rejection pattern near resistance, with price consolidating under the recent high and trading between nearby pivot resistance and the rising benchmark cluster.
View charts on: AlphaWebTrader HTF Charts
NQ Daily View
Overall Rating
- Short-Term: Bearish
- Intermediate-Term: Bearish
- Long-Term: Bullish.
Key Insights Summary
Price is trading below the weekly and monthly F0%/NTZ zones, keeping the short and intermediate structure under pressure even though the broader yearly frame remains constructive. The pivot state is in DTrend with the next reversal marker still higher at the prior pivot-high zone near 30376.25, while support layers remain clustered below at 28909.75 and 28510.00. Daily benchmarks are mixed but still lean trend-supportive on the higher-timeframe averages, with price holding above the 55-, 100-, and 200-day measures overall. Recent signals show the market has rotated from a long trigger into short bias again, reflecting a choppy but downward-leaning consolidation beneath the June high area and around the July box resistance.
View charts on: AlphaWebTrader HTF Charts
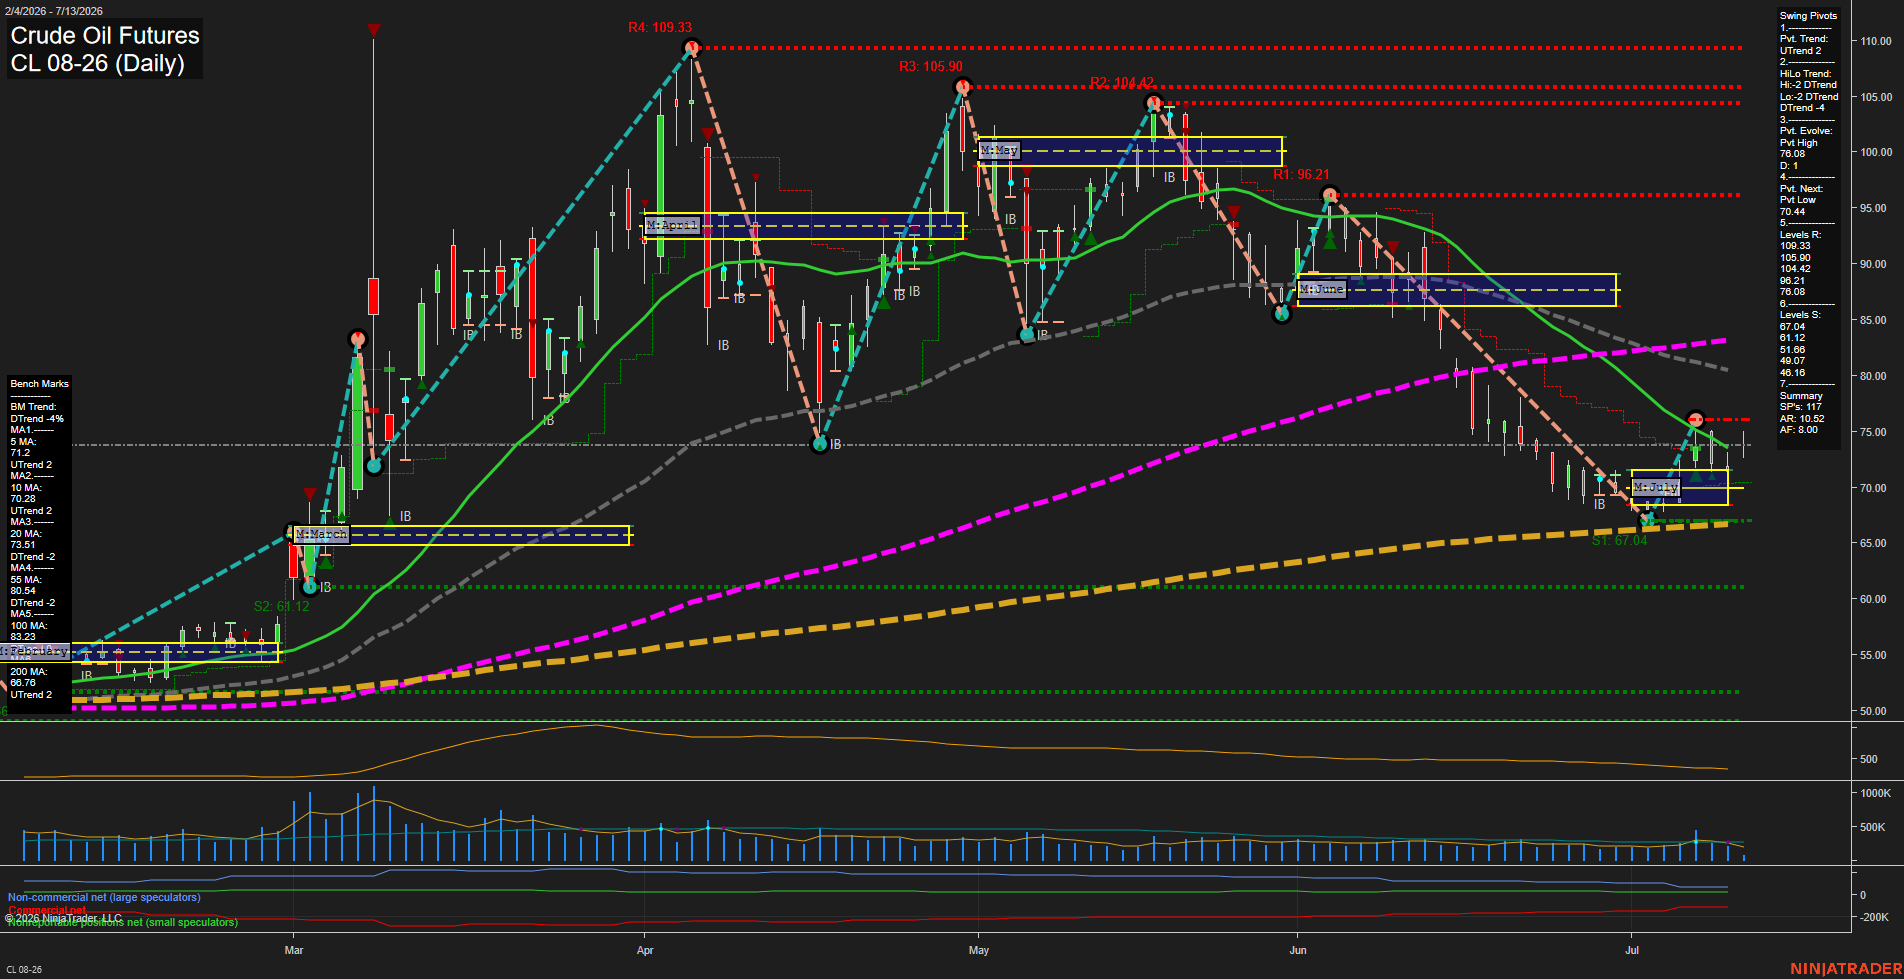
CL Daily View
Overall Rating
- Short-Term: Bearish
- Intermediate-Term: Bearish
- Long-Term: Neutral.
Key Insights Summary
Crude oil is in a broad corrective phase after a major mid-spring peak near 109.33 and a sequence of lower highs into July. The daily structure shows price holding above the weekly and monthly session grid biases, but the benchmark moving averages are still stacked bearishly in the intermediate and long horizons, with price below the 20, 55, and 100 day averages. Swing pivot structure remains mixed to negative: the short-term pivot trend is still marked UTrend, while the HiLo trend is DTrend, reflecting a fading recovery against the dominant downslope. The most recent action has been a measured selloff with consolidation around the low-70s, leaving 76.08 as the latest pivot high and 70.44 as the next pivot low marker. Overall, the chart reads as a retracement-driven market with compressed volatility, repeated rejection from overhead resistance, and a near-term trade range centered around the low-70s after the prior breakdown from the mid-80s and 90s area.
View charts on: AlphaWebTrader HTF Charts
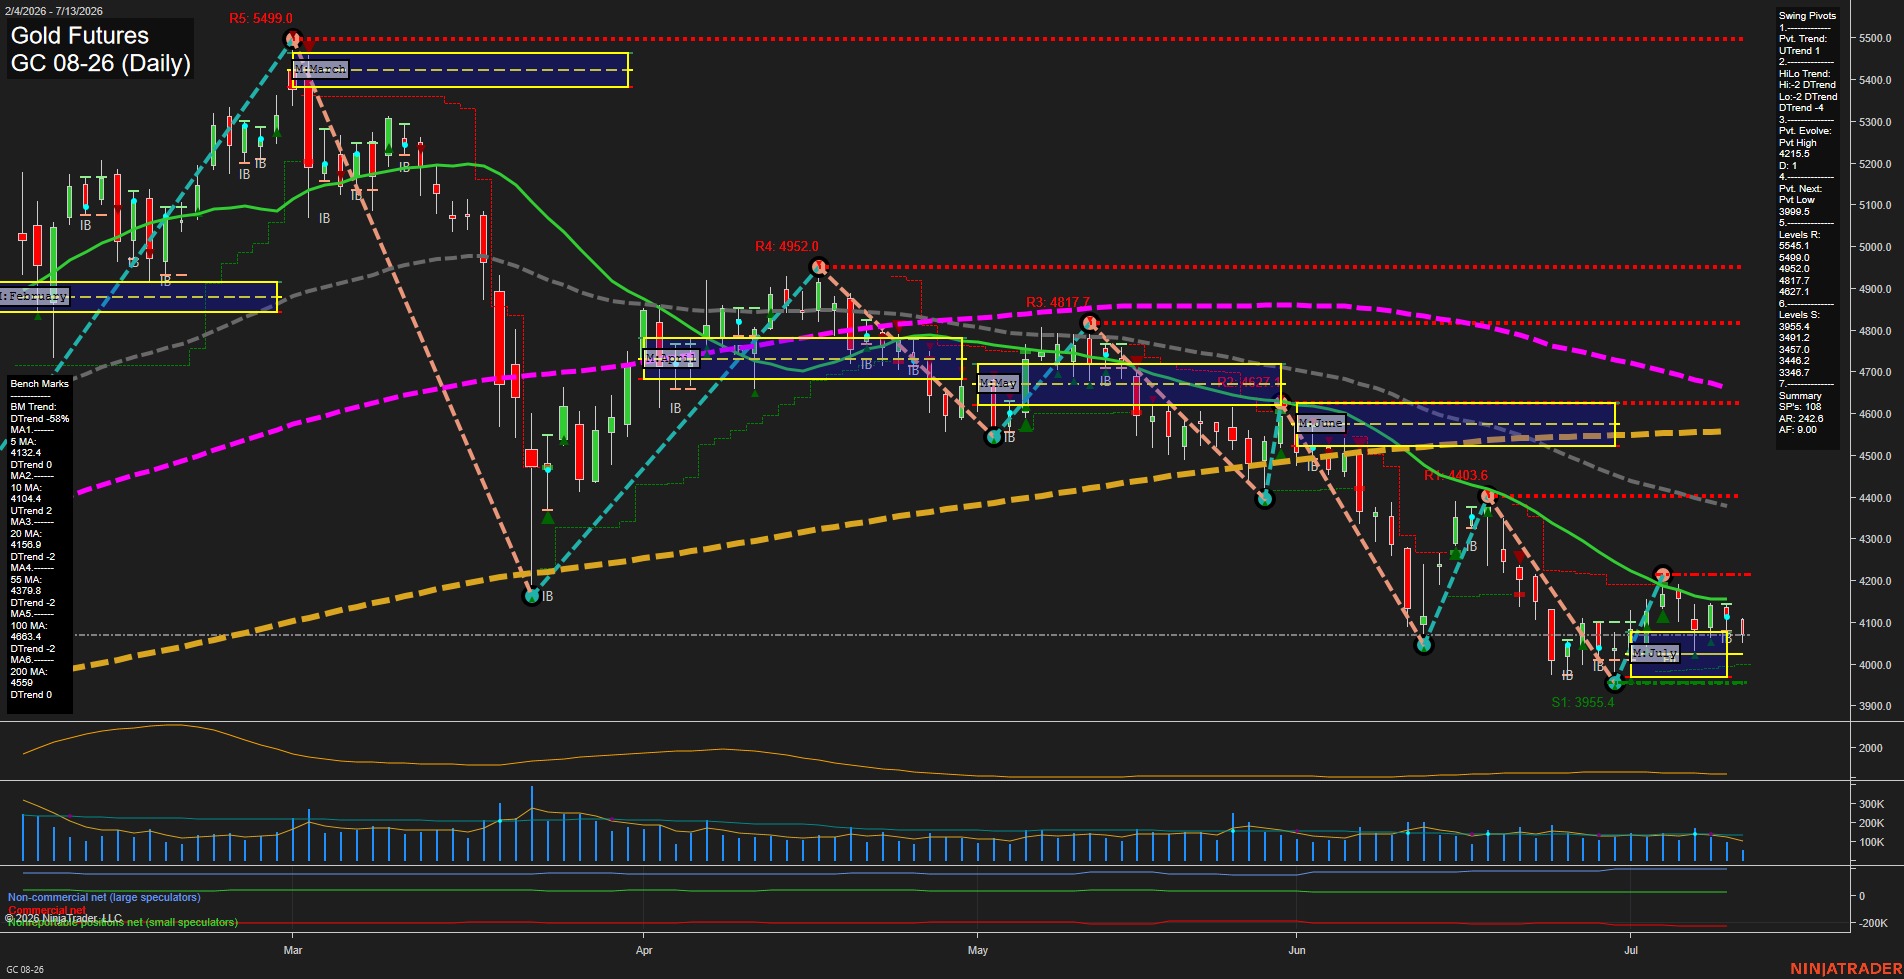
GC Daily View
Overall Rating
- Short-Term: Bearish
- Intermediate-Term: Bearish
- Long-Term: Bearish.
Key Insights Summary
Gold futures are in a broad corrective phase with a strong June-to-July decline still defining the tape. The daily chart shows price trading below the key short- and intermediate-term benchmarks, with the swing pivot structure still in a downtrend and resistance stacked overhead near 4100-4150, then 4200-4400. The weekly fib grid remains bearish while the monthly grid still shows an offset bullish posture, creating a mixed higher-timeframe backdrop but with price action currently failing to reclaim the lost trend levels. The market is compressing near the 4000 area after a fast selloff, with visible test-and-rejection behavior and only limited recovery attempts, while the long-term year structure remains under pressure and below major moving average reference points.
View charts on: AlphaWebTrader HTF Charts