NYSE pre-market action shows mixed ETF movers, weaker short-term futures in NQ, YM, RTY and FDAX, and attention on CPI, banks, oil and yields.
Fundamentals: U.S. futures were mixed as Middle East conflict and disruption risk in the Strait of Hormuz kept crude prices elevated. Energy stocks outperformed while travel names lagged, and higher bond yields pressured metals and broader sentiment. Traders also watched pre-market earnings from major banks alongside U.S. CPI releases and Fed testimony.
Technicals: The pre-market session shows a mixed setup, with prior ETF movers leaning split and futures analysis pointing to short-term weakness in NQ, YM, RTY, and FDAX even as longer-term trend structure remains constructive in several markets. ES and EMD show firmer higher-timeframe support, while multiple indices are consolidating near recent highs after strong rallies and pullbacks.
Pre-Market Trading 360° view Market Radar of: holidays, earnings, eco-news, market-news summary, news sentiment, prior session major ETFs, MAG7, Higher Time Frame Analysis Indices Futures Summary, and E-mini S&P500, Nasdaq 100, NYMEX Crude, Gold Futures Daily Chart analysis.
As of: July 14, 2026 07:16 CT
Earnings Radar
Monitoring for earnings releases by the Magnificent 7, AI-tech-related firms, and major financial institutions.
- MS Release: 2026-07-15 T:BMO
- BAC Release: 2026-07-14 T:BMO
- C Release: 2026-07-14 T:BMO
- GS Release: 2026-07-14 T:BMO
- JPM Release: 2026-07-14 T:BMO
- WFC Release: 2026-07-14 T:BMO
Conclusion: With BAC, C, GS, JPM, and WFC reporting before the open today, and MS scheduled for tomorrow before the open, index futures face a finance-heavy earnings window with broad market relevance. The session centers on bank results and subsequent follow-through from Morgan Stanley, with attention on headline reactions, sector rotation, and intraday volatility around the releases.
For full details visit: Yahoo Earnings Calendar
EcoNews Radar U.S. Events
| Day | Time | Impact | Event |
|---|---|---|---|
| Tue | 08:30 | High | Core CPI m/m |
| Tue | 08:30 | High | Core CPI y/y |
| Tue | 08:30 | High | CPI m/m |
| Tue | 08:30 | High | CPI y/y |
| Tue | 10:00 | High | Fed Chairman Warsh Testifies |
| Wed | 08:30 | High | Core PPI m/m |
| Wed | 08:30 | High | PPI m/m |
| Wed | 10:00 | High | Fed Chairman Warsh Testifies |
| Wed | 10:30 | Low | Crude Oil Inventories |
| Thu | 08:30 | Medium | Core Retail Sales m/m |
| Thu | 08:30 | Medium | Philly Fed Manufacturing Index |
| Thu | 08:30 | Medium | Retail Sales m/m |
| Thu | 08:30 | Medium | Unemployment Claims |
| Fri | 10:00 | Medium | Prelim UoM Consumer Sentiment |
| Fri | 10:00 | Medium | Prelim UoM Inflation Expectations |
EcoNews Summary
Tuesday carries the week’s most important macro catalyst with U.S. CPI releases, a major input for inflation expectations, Treasury yields, and index futures repricing. Fed Chairman Warsh testimony adds a second high-impact policy event on Tuesday and Wednesday, reinforcing sensitivity around rates and growth expectations. Wednesday also includes PPI and crude oil inventories, with inventories relevant for energy-price spillover into inflation and sentiment. Market momentum and volume often slow ahead of CPI, with increased volatility at release time. News events around the 10 AM cycle act as catalysts for reversals or continuations.
Event Notes:
- Tuesday 08:30 – High USD Core CPI m/m: Measures monthly consumer price changes excluding food and energy. Traders monitor it for underlying inflation pressure and Federal Reserve policy implications.
- Tuesday 08:30 – High USD Core CPI y/y: Measures year-over-year consumer price changes excluding food and energy. Traders watch it for the broader inflation trend and rate-sensitive market repricing.
- Tuesday 08:30 – High USD CPI m/m: Measures monthly headline consumer inflation across the basket of goods and services. It moves rates, dollar flow, and index futures through inflation expectations.
- Tuesday 08:30 – High USD CPI y/y: Measures year-over-year headline consumer inflation. Traders monitor it for confirmation of inflation momentum and policy pressure.
- Tuesday 10:00 – High USD Fed Chairman Warsh Testifies: A policy appearance that can shift rate expectations through comments on inflation, labor conditions, and the economic outlook.
- Wednesday 08:30 – High USD Core PPI m/m: Measures monthly producer price inflation excluding food and energy. Traders watch it for pipeline inflation pressure that can feed into consumer prices.
- Wednesday 08:30 – High USD PPI m/m: Measures monthly producer inflation at the wholesale level. It offers a read on cost pressures across the supply chain.
- Wednesday 10:00 – High USD Fed Chairman Warsh Testifies: A second policy testimony session that can reprice rates and equities if the tone differs from earlier remarks.
- Wednesday 10:30 – Low USD Crude Oil Inventories: Measures the weekly change in U.S. crude stockpiles. Traders monitor it for supply-demand balance, energy-price movement, and inflation spillover.
Conclusion:
Tuesday is the most important day of the week, led by the 08:30 U.S. CPI and Core CPI releases. Among the listed events, Tuesday’s CPI data is the single most important event, with the strongest potential to drive index futures volatility through inflation and rate expectations. Wednesday adds PPI, Fed testimony, and crude inventories, keeping the market sensitive to inflation and energy-price signals.
For full details visit: Forex Factory EcoNews
Market News Summary:
Middle East conflict and Strait of Hormuz disruption dominate risk sentiment, while energy prices strengthen and yields weigh on metals and broader markets.
Primary Drivers & Risks:
- Primary Driver: Hormuz conflict lifts oil
- Primary Risk: Higher yields pressure assets
Tone:
Risk-sensitive, with energy strength offset by yield and inflation pressure.
Stock Market / ETFs / Indices:
U.S. stock futures were mixed, the S&P 500 edged higher, and the Nasdaq 100 and small caps declined. Energy stocks outperformed as crude prices surged, while travel names weakened in response to higher oil.
Geopolitical:
Escalating U.S.-Iran conflict and renewed action in the Strait of Hormuz drove attention. The U.S. launched strikes on Iran and reimposed a naval blockade, while shipping fee plans for Hormuz added to disruption concerns.
Oil / Energy:
Oil rose more than 2% to a four-week high and Brent moved back above $85 a barrel. Headlines pointed to supply disruption risk, tighter energy flows, and stronger crude-linked equities; natural gas also held an upward trend.
Gold / Metals:
Gold declined in early Asian trade as global bond yields rose. Later coverage showed gold holding support near $4,021 and silver firm on constrained supply and strong industrial demand.
Fed / Financials:
Broadly higher bond yields weighed on gold and put Treasury markets on edge. Market commentary also highlighted inflation and policy testimony as focus points for fixed income.
Macro / Other:
Inflation moved higher after the Iran conflict lifted energy prices, then eased as energy prices fell. China reported a near 10-year low in June crude imports and weaker smartphone shipments, adding a softer demand backdrop.
Conclusion:
Oil and geopolitical disruption remain the main drivers, with the Strait of Hormuz and U.S.-Iran conflict keeping energy supply risk in focus. Higher crude prices supported energy shares and pressured travel stocks, while mixed equity breadth kept overall index tone uneven.
Secondary pressures came from rising bond yields, inflation sensitivity, and weakness in gold and parts of tech. China demand data and mixed JGB/Treasury moves added cross-currents, but they sat behind the dominant oil and conflict narrative.
Market News Sentiment
Market News Articles: 46
- Neutral: 56.52%
- Negative: 23.91%
- Positive: 19.57%
Sentiment Summary: Market news is predominantly neutral at 57%, with negative articles at 24% and positive articles at 20% across 46 articles.
Conclusion: The news flow is mixed and slightly neutral-weighted, with no clear directional tone from the article set.
GLD,Gold Articles: 11
- Negative: 54.55%
- Positive: 36.36%
- Neutral: 9.09%
Sentiment Summary: Gold-related news sentiment is mostly negative, with 55% negative, 36% positive, and 9% neutral coverage across 11 articles.
Conclusion: The article mix shows a negative bias in Gold news sentiment, with negative coverage outweighing positive coverage.
USO,Oil Articles: 23
- Positive: 34.78%
- Neutral: 34.78%
- Negative: 30.43%
Sentiment Summary: USO oil coverage is evenly balanced, with 35% positive, 35% neutral, and 30% negative articles across 23 reports.
Conclusion: The news flow shows no strong directional bias, with sentiment distributed nearly evenly between positive, neutral, and negative tone.
Market Data Snapshot
ETF Snapshot of major stock market ETFs, Mag7, and others as of: July 14, 2026 07:16
Top Movers & Losers
- USO 117.79 Bullish 8.36% ▲
- MSFT 390.99 Bullish 1.53% ▲
- AMZN 247.31 Bullish 0.80% ▲
- IBIT 35.22 Bearish -2.79% ▼
- TSLA 394.76 Bearish -3.19% ▼
- NVDA 203.53 Bearish -3.52% ▼
Major Index ETFs: SPY, QQQ, DIA, IWM, IJH
- DIA 524.47 Bearish -0.25% ▼
- IJH 75.24 Bearish -0.57% ▼
- SPY 749.17 Bearish -0.77% ▼
- IWM 293.48 Bearish -0.85% ▼
- QQQ 711.74 Bearish -1.90% ▼
Bearish across the board: DIA was the least negative mover at -0.25%, followed by IJH at -0.57%, SPY at -0.77%, and IWM at -0.85%, while QQQ was the most bearish at -1.90%.
Mag 7 Stocks: AAPL, MSFT, GOOG, AMZN, META, NVDA, TSLA
- MSFT 390.99 Bullish 1.53% ▲
- AMZN 247.31 Bullish 0.80% ▲
- AAPL 317.31 Bullish 0.63% ▲
- GOOG 350.67 Bearish -1.23% ▼
- META 656.73 Bearish -1.86% ▼
- TSLA 394.76 Bearish -3.19% ▼
- NVDA 203.53 Bearish -3.52% ▼
Mixed Mag7 tone: MSFT led the group with +1.53%, followed by AMZN at +0.80% and AAPL at +0.63%, while GOOG slipped -1.23%, META fell -1.86%, TSLA dropped -3.19%, and NVDA posted the most bearish move at -3.52%.
Cross-Market ETFs: TLT, GLD, USO, IBIT
- USO 117.79 Bullish 8.36% ▲
- TLT 83.97 Bearish -0.59% ▼
- GLD 367.13 Bearish -2.62% ▼
- IBIT 35.22 Bearish -2.79% ▼
Mixed cross-market tone: USO is the most bullish mover at +8.36%, while IBIT is the most bearish mover at -2.79%; GLD is also bearish at -2.62%, and TLT is near-flat bearish at -0.59%.
ETF, Mag7, and Cross-Market ETF Insights
Overall Tone
Mixed and risk-off leaning, as the major equity ETFs are mostly lower while only a few large-cap names remain positive; the stronger move in USO adds a separate commodity bid, but broad index participation is soft.
Equity ETFs and Mag7:
Major Index ETFs were broadly lower, led by QQQ at -1.90% and IWM at -0.85%, while SPY eased -0.77%, IJH fell -0.57%, and DIA was the least negative at -0.25%. Mag7 leadership was selective, with MSFT the most bullish mover at +1.53%, followed by AMZN at +0.80% and AAPL at +0.63%. Downside was concentrated in NVDA at -3.52% and TSLA at -3.19%, with META at -1.86% and GOOG at -1.23%, showing a mixed tape rather than broad equity alignment.
Cross-Market ETFs:
Cross-market action was also mixed, with USO the clear standout at +8.36% versus defensive assets and digital gold proxies under pressure. GLD fell -2.62%, IBIT declined -2.79%, and TLT slipped -0.59%, which points to hedging weakness alongside the equity softness. The most bullish mover was USO at +8.36%, while the most bearish mover was IBIT at -2.79%.
Futures Indices – Higher Time Frame Analysis
Summary of the current state of US Indices Futures based on higher time-frame (HTF) technical analysis as of: 2026-07-14: 07:16 CT.
US Indices Futures
- ES Weekly WSFG bearish, MSFG/YSFG bullish; daily above 20/55/100/200MAs; pivots 7628.75, 7648.75-7693.50 resistance, support below prior highs.
- NQ Weekly WSFG/MSFG bearish, YSFG bullish; daily below weekly/monthly NTZ, below 5/10/20MAs but above 55/100/200MAs; pivots 30975.50-31090 resistance, 28909.75/28510 support.
- YM Weekly WSFG/MSFG bearish, YSFG bullish; daily below weekly/monthly F0%/NTZ and 5/10MAs, above 55/100/200MAs; pivots 53656 resistance, 52255 then lower supports.
- EMD Weekly WSFG/MSFG below center, YSFG bullish; daily below weekly/monthly NTZ/F0%, 10/20/55/100/200MAs stacked higher; pivots 3892.4 resistance, 3724.0/3692.9 support.
- RTY Weekly WSFG/MSFG bearish, YSFG bullish; daily below weekly/monthly midlines, 5/10/20MAs lower, above 55/100/200MAs; pivots 3068.4 resistance, 2943.4/2828.1 support.
- FDAX Weekly WSFG/MSFG below F0%, YSFG bullish; daily below weekly/monthly grids, 5/10/20MAs lower, 55/100/200MAs supportive; pivots 26064 resistance, 24892 then 24226 support.
Overall State
- Short-Term: Bearish
- Intermediate-Term: Bearish
- Long-Term: Bullish
Conclusion
HTF structure remains mixed near recent highs: yearly grids are bullish across ES, NQ, YM, EMD, RTY, and FDAX, while weekly and monthly session grids are weaker in NQ, YM, RTY, and FDAX, and mixed in ES and EMD. Benchmarks are broadly constructive over 55/100/200-day references, but several instruments are below short-term and intermediate NTZ/F0% centers, keeping current rotation reactive. Pivot structures show ES and EMD near upper-range extensions, while NQ, YM, RTY, and FDAX are correcting beneath overhead resistance. Directional correlation remains aligned with long-cycle strength and short-cycle compression.
Note: Intra-day counter-trend pullbacks or retracements may occur, HTF is context for informational usage and market structure. Glossary: Session Fib Grids periods of YSFG:’Yearly’, MSFG:’Monthly’, WSFG:’Weekly’
For full details visit: AlphaWebTrader Technicals
ES Daily View
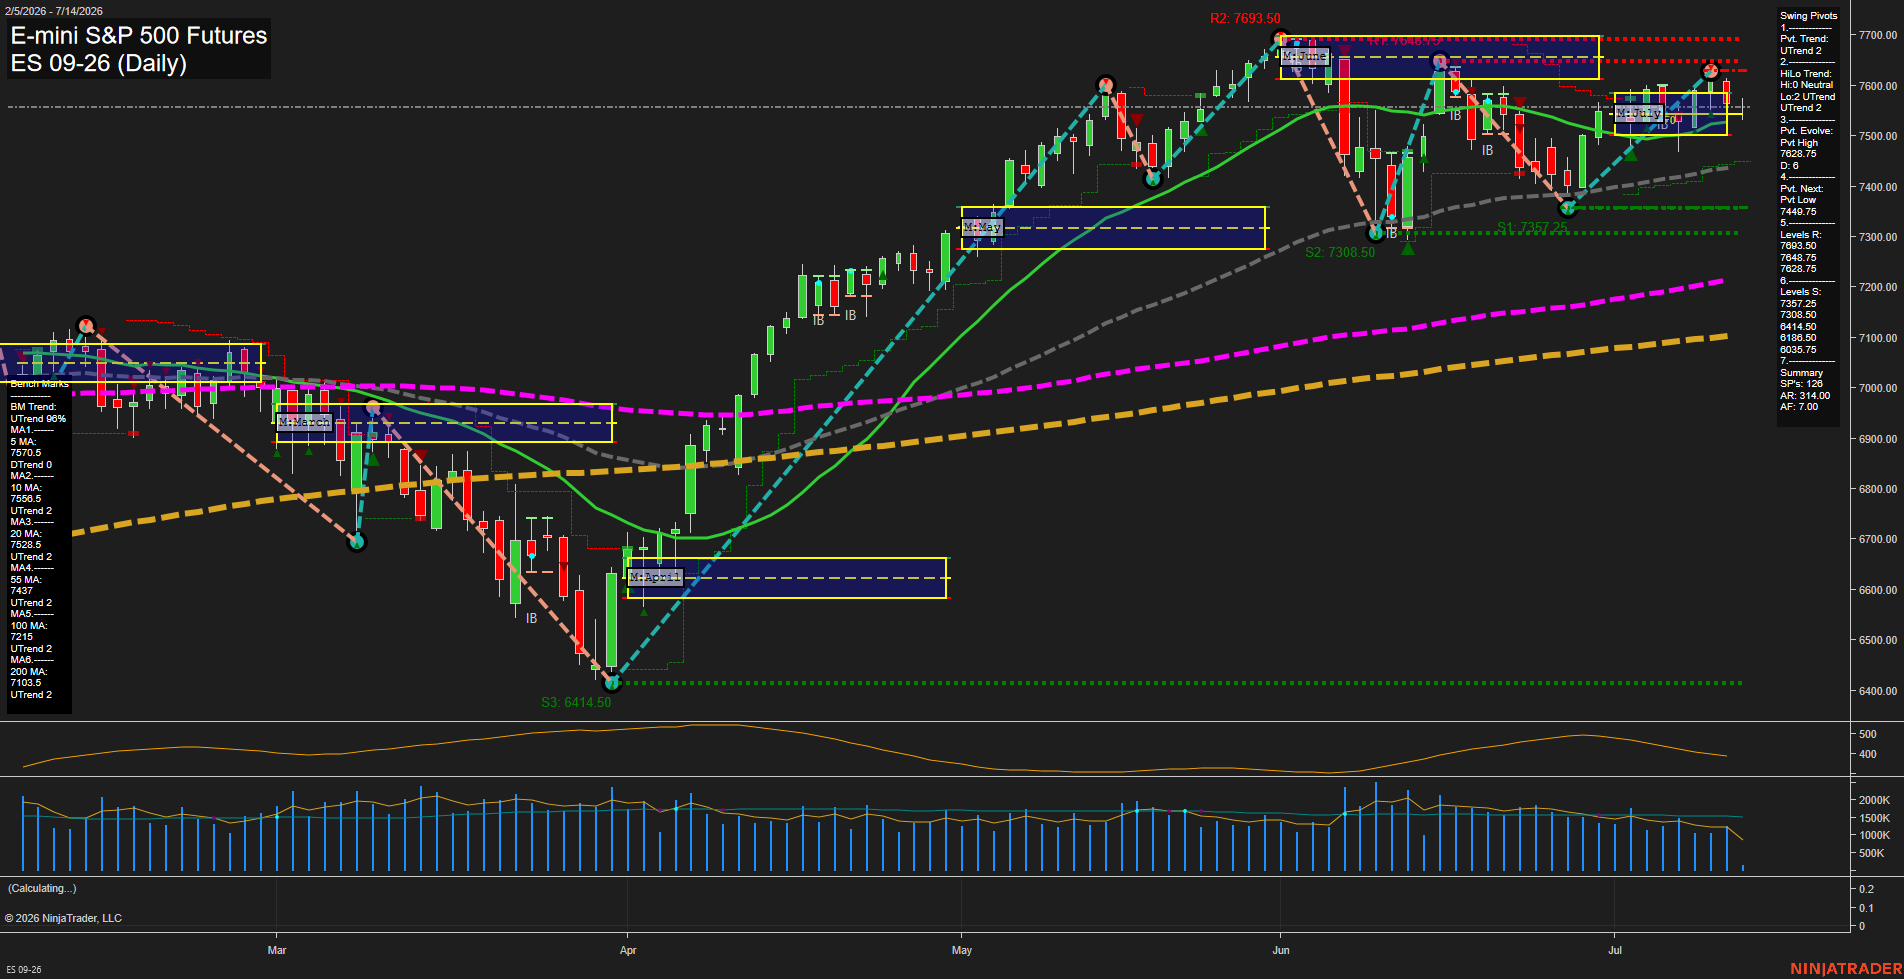
Overall Rating
- Short-Term: Bullish
- Intermediate-Term: Bullish
- Long-Term: Bullish.
Key Insights Summary
Price is holding above the 20-, 55-, 100-, and 200-day benchmarks, keeping the broader structure firmly constructive, while the short-term swing state remains in UTrend with the most recent pivot sequence still pointing higher. The chart has transitioned from the spring selloff into a strong summer recovery, followed by a consolidation just below the recent pivot high near 7628.75 and the upper resistance band around 7648.75 to 7693.50. Weekly fib positioning is still below its NTZ midpoint, which reflects a softer weekly posture versus the monthly and yearly grids that remain positive. Recent inside-bar and rejection behavior around the June highs shows a market digesting gains after a steep rally, with price action currently balancing between breakout continuation and range rotation near overhead resistance.
View charts on: AlphaWebTrader HTF Charts
NQ Daily View
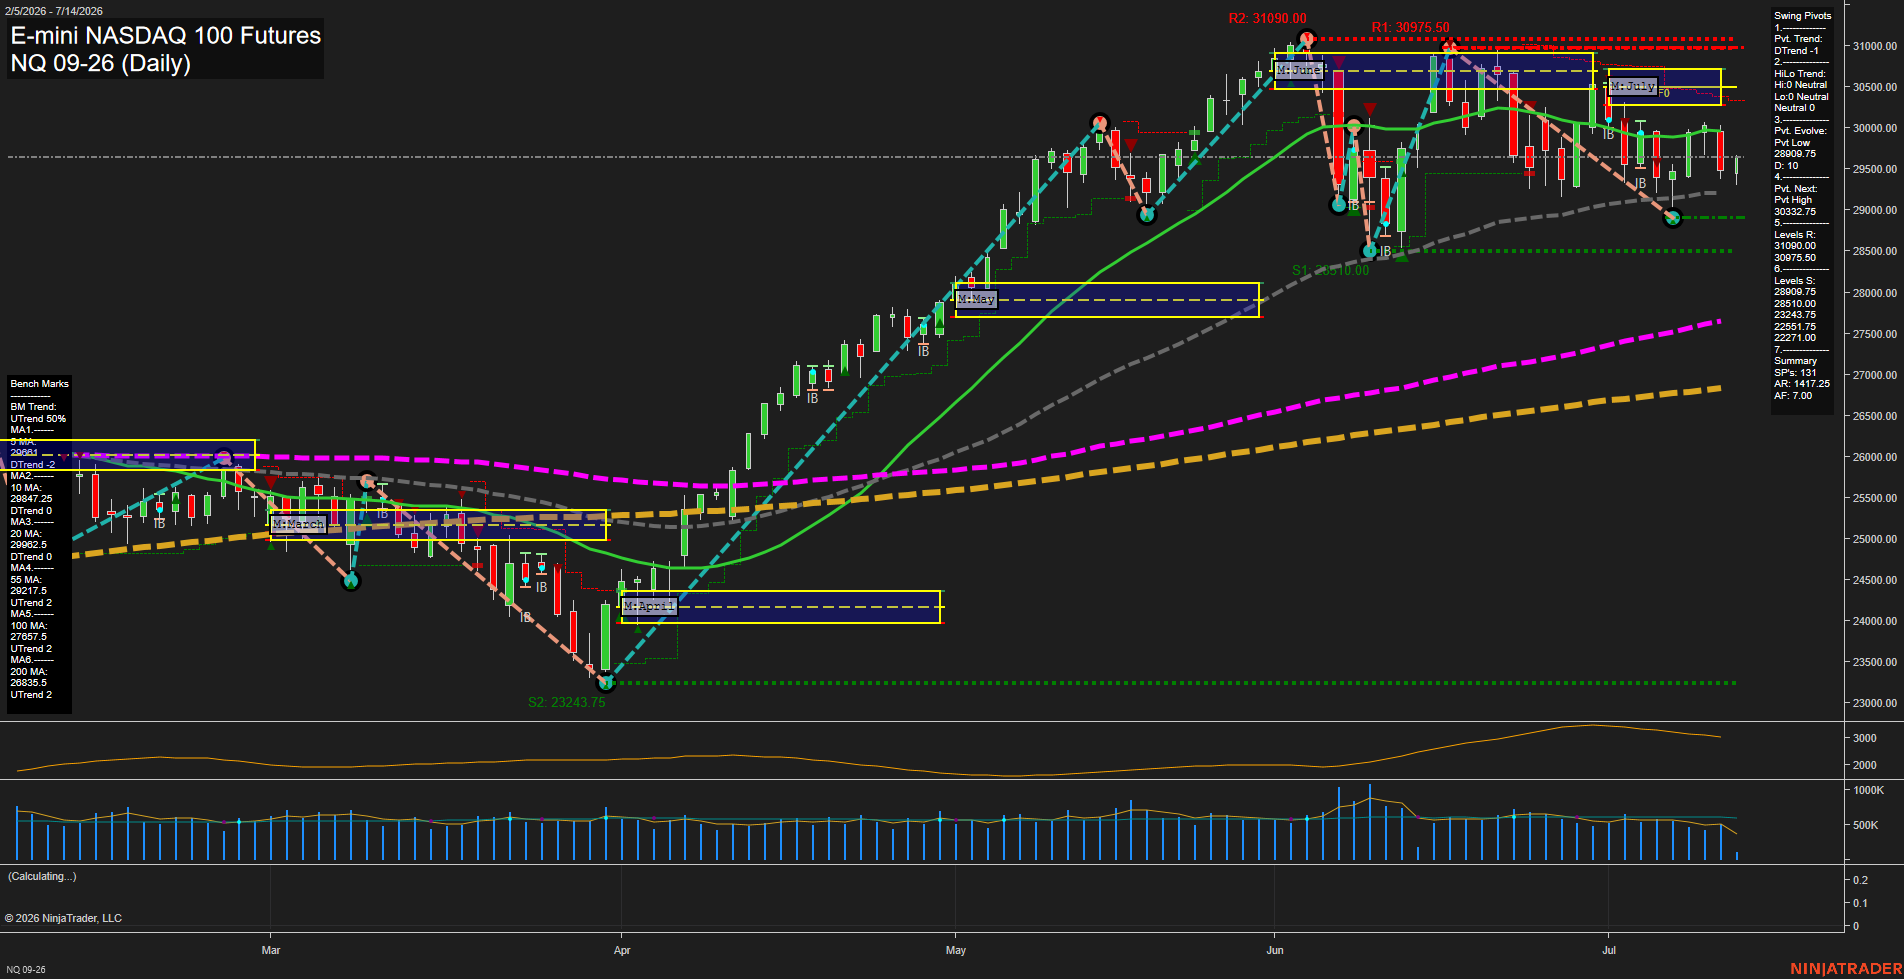
Overall Rating
- Short-Term: Bearish
- Intermediate-Term: Bearish
- Long-Term: Bullish.
Key Insights Summary
The daily structure remains in a post-impulse consolidation zone after the strong May-to-June rally and the sharp June reversal. Price is trading below the weekly and monthly F0%/NTZ centers, keeping the short- and intermediate-term session grids aligned to the downside, while the yearly grid still holds an upward long-cycle bias. Swing pivots show a dominant downtrend in the current pivot sequence, with resistance clustered near 30975.50 to 31090.00 and support focused at 28909.75 and 28510.00. Price is holding below the 5, 10, and 20 day benchmarks, but still above the 55, 100, and 200 day averages, which reflects a bearish near-term phase inside a broader bullish secular structure. The recent signal cluster is consistent with the pullback and rejection behavior seen after the June highs, with volatility expanding enough to support larger daily ranges and broader rotational swings.
View charts on: AlphaWebTrader HTF Charts
CL Daily View
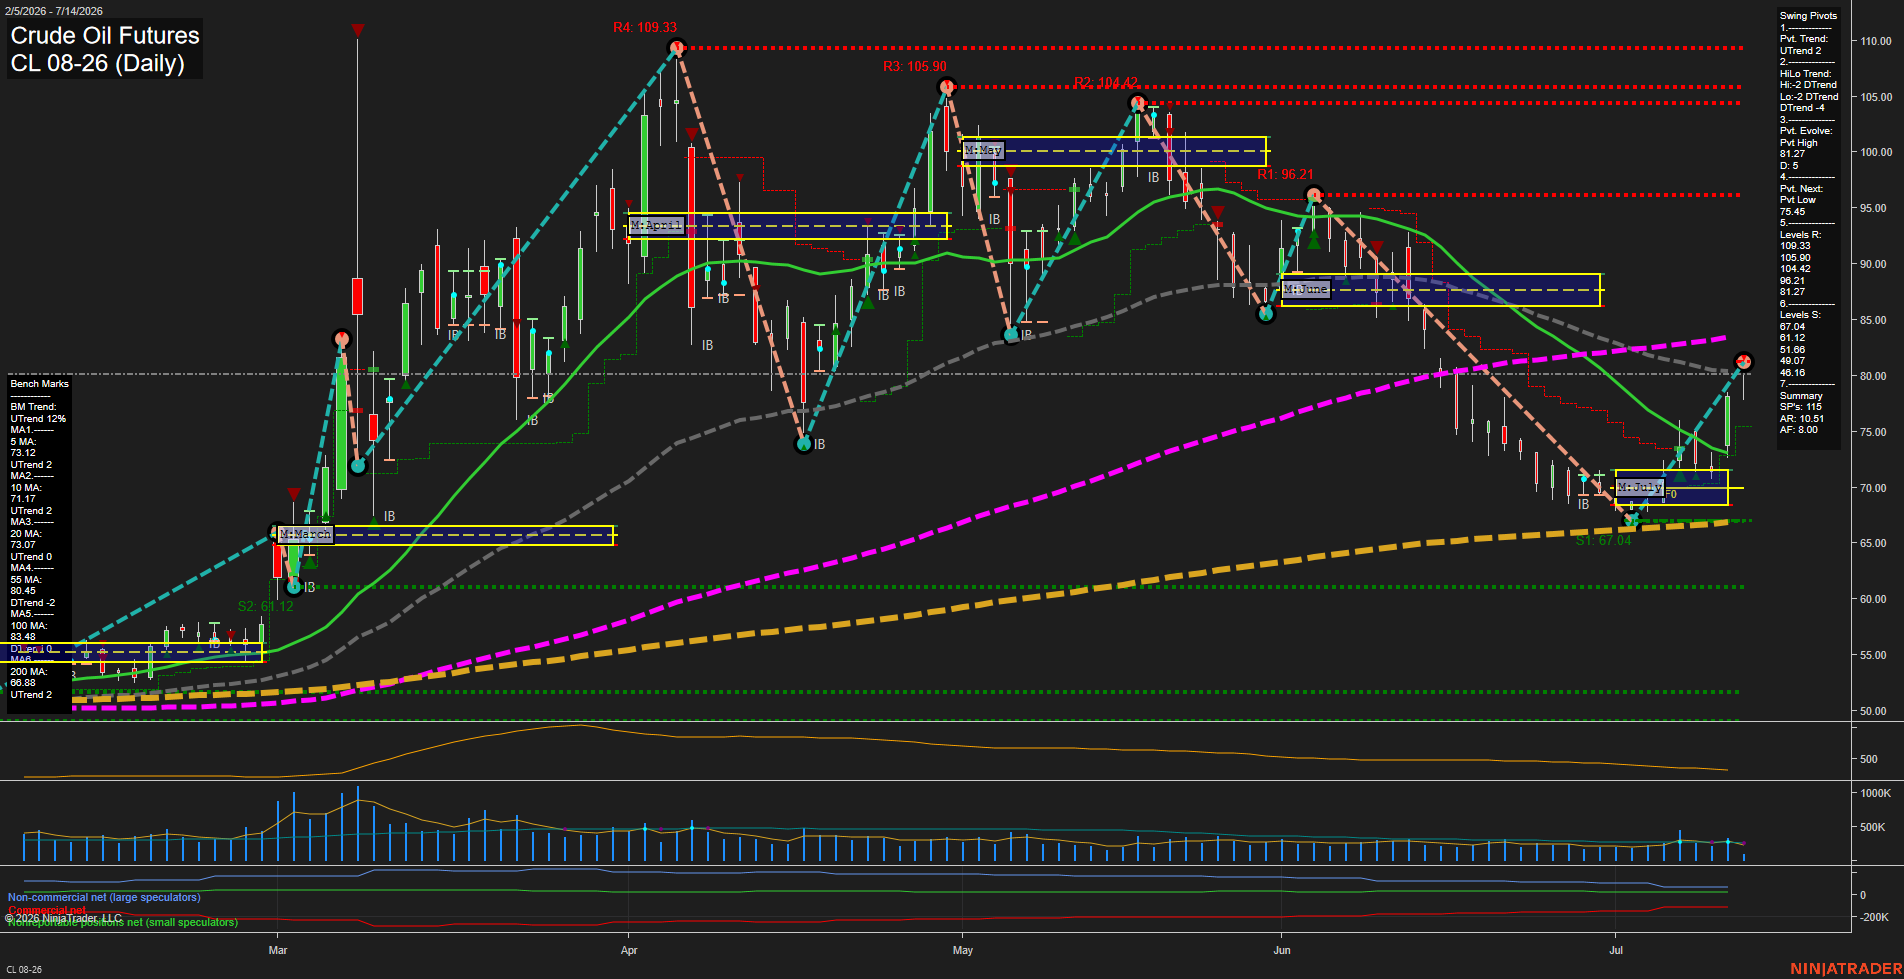
Overall Rating
- Short-Term: Bullish
- Intermediate-Term: Neutral
- Long-Term: Bullish.
Key Insights Summary
Crude oil is rebounding from the early-July selloff and has reclaimed the upper portion of the recent monthly NTZ area, with price now pressing back toward the prior pivot high zone near 81.27. The short-term structure has turned constructive with the latest pivot sequence shifting to an uptrend, while the weekly and monthly session grids remain biased above F0%, supporting the recovery phase. Intermediate-term structure is still mixed because the 55-day benchmark remains above price and the swing pivot hi/lo trend is not yet fully repaired, so the chart still reflects a transition from correction back toward trend recovery. Long-term structure remains firm, with the yearly session context and 200-day benchmark still aligned to the broader bullish backdrop.
View charts on: AlphaWebTrader HTF Charts
GC Daily View
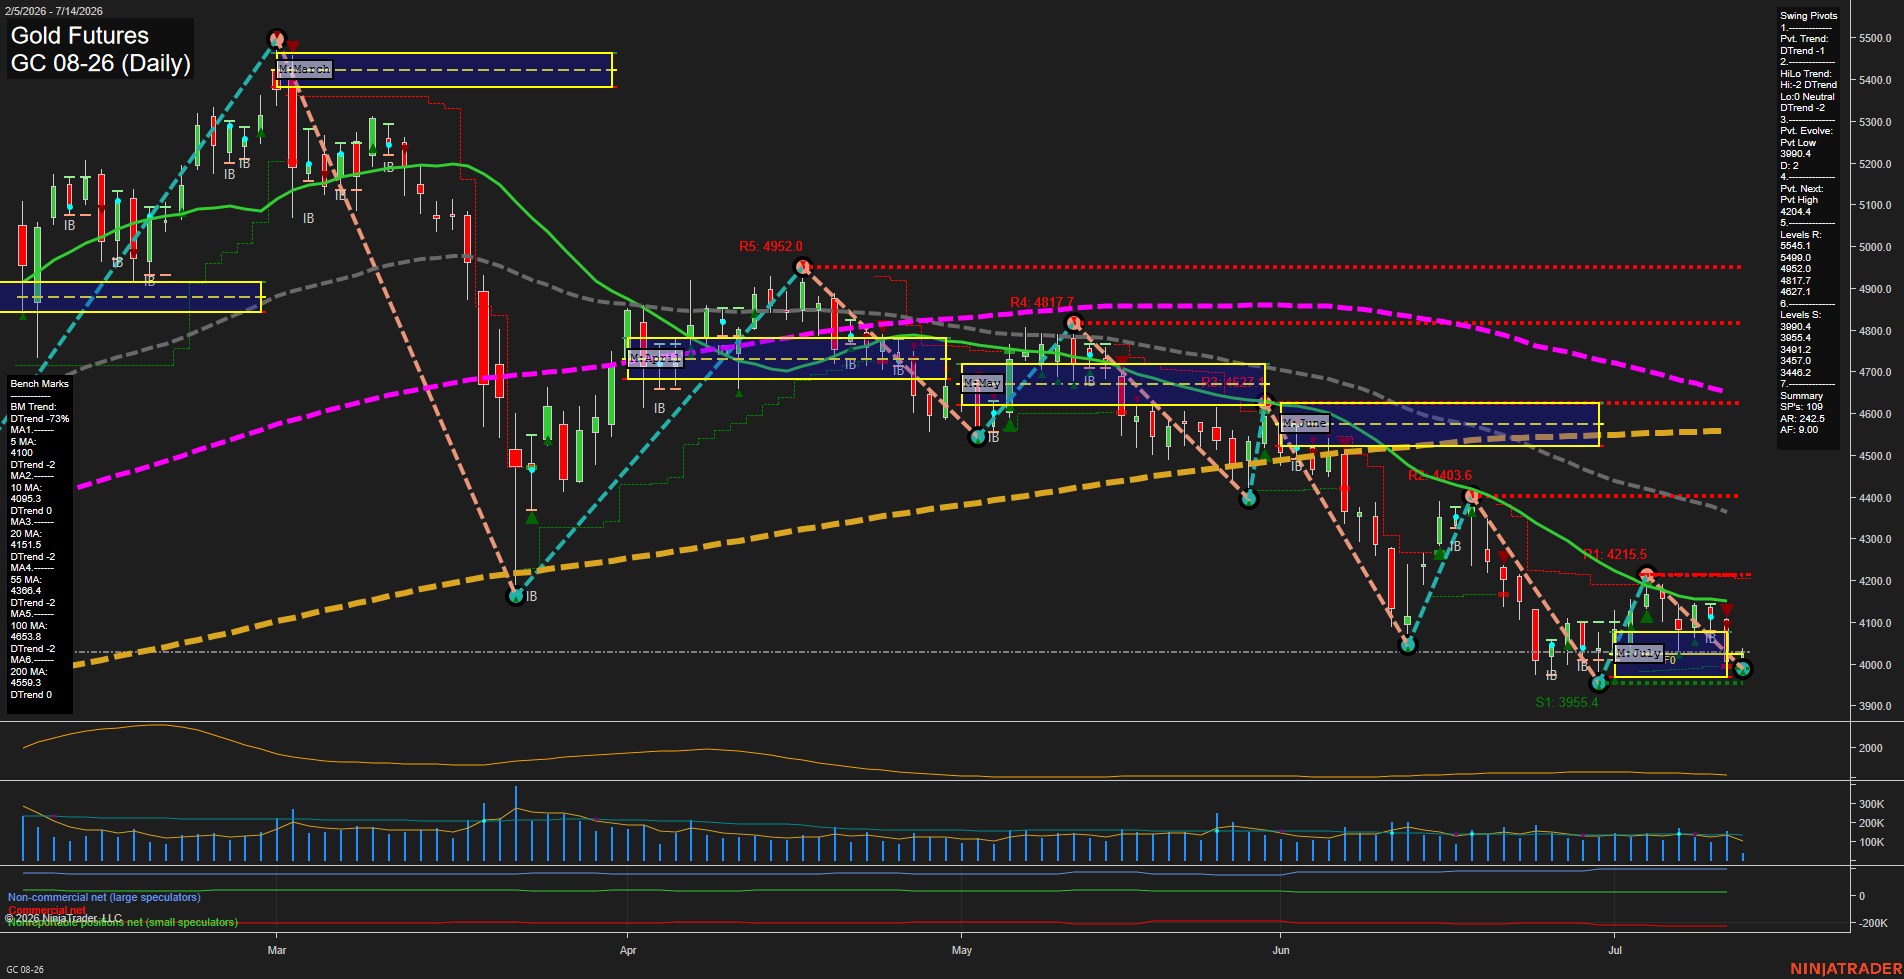
Overall Rating
- Short-Term: Bearish
- Intermediate-Term: Bearish
- Long-Term: Bearish.
Key Insights Summary
Gold futures are trading in a sharply lower daily swing structure after a fast selloff from the 4200 area and a continued sequence of lower highs and lower lows. Price is now pressed under the key daily benchmark stack, with all major moving averages pointed lower and overhead resistance layered at 4095 to 4151 and then 4368. The weekly session fib remains below its F0%/NTZ reference, matching the short-term downtrend, while the monthly session fib still sits above its F0%/NTZ and keeps the intermediate-term view mixed-to-firmer relative to the broader decline. The swing pivot map remains bearish with DTrend active, support clustered near 3955 and 3900, and the next major pivot high still well above at 4204. Recent trade signals reflect the alternating reaction to the July range, but the broader tape remains dominated by downside momentum, heavy volatility, and a consolidation-to-breakdown character after repeated rejection near prior reaction highs.
View charts on: AlphaWebTrader HTF Charts