
Softer inflation, strong bank earnings, AI-linked chip gains and rising Middle East energy risk shaped a mixed Wall Street session as oil and valuations weig…
Fundamentals: Softer U.S. CPI data and strong bank earnings supported stocks, while chip-related gains helped technology shares. At the same time, higher crude prices, renewed US-Iran tensions around the Strait of Hormuz, and stretched valuation concerns kept sentiment mixed. Commentary also pointed to AI infrastructure demand, a New York ban on new hyperscale data centers, and signs of strain in consumer credit.
Technicals: U.S. markets ended mixed as ETF leadership split between NVDA, IBIT, and USO gains and softer closes in AAPL and MSFT. Futures and index grids showed a broader bullish long-term structure, while several contracts remained under short-term pressure after recent rallies. Key benchmarks stayed constructive, but many markets were consolidating near resistance after strong multi-week advances.
After Market Close daily snapshot: market news summary and sentiment, major ETFs, Magnificent 7 analysis, Indices Futures Higher Time Frame Analysis, and E-mini S&P500, Nasdaq 100, NYMEX Crude, Gold Futures Daily Chart analysis.
As of: July 14, 2026 05:00 CT
Market News Summary:
Soft inflation, strong bank earnings, AI-related sector moves, and rising Middle East energy तनाव shaped the session.
Primary Drivers & Risks:
- Primary Driver: Softer CPI and bank earnings
- Primary Risk: Valuation and geopolitical shocks
Tone:
Mixed, with support from inflation and earnings but cross-currents from oil, valuations, and sector rotation.
Stock Market / ETFs / Indices:
US stocks gained support from a softer CPI print, with chip stocks lifting tech while IBM weighed on the Dow. Broadcom and the Nasdaq-100 remained in focus, while commentary on stretched S&P 500 valuation and a higher bar for earnings highlighted index sensitivity to sentiment.
Geopolitical:
US-Iran tensions and Strait of Hormuz developments drove risk attention, including shipping fee changes and renewed concern over Middle Eastern supply routes.
Oil / Energy:
Brent and WTI crude moved higher as traders priced in supply disruption risk tied to Iran and Hormuz passage. Gasoline and inflation headlines connected higher energy costs with broader market pressure.
Gold / Metals:
Gold and other precious metals reacted to the softer inflation report, though later commentary pointed to resistance and uneven bullish momentum in gold.
Fed / Financials:
The softer CPI reading eased pressure on rate-hike expectations, while bank earnings surged and Wall Street banks cited stronger dealmaking and financing tied to AI infrastructure spending.
Macro / Other:
New York imposed a temporary ban on new hyperscale AI data centers, and foreign buying of US securities remained strong. Market commentary also highlighted elevated credit card delinquencies outside the biggest banks.
Conclusion:
Primary support came from cooler inflation, stronger financial-sector earnings, and tech leadership tied to chip stocks and AI spending. Those forces offset pressure from higher oil, geopolitical tension around Hormuz, and valuation concerns across indices.
Secondary risks included stretched market pricing, mixed leadership within the Dow and Nasdaq, and possible energy-driven inflation spillovers. Gold and metals added a lower-intensity macro signal, while the data center ban and credit trends introduced additional cross-currents.
Market News Sentiment
Market News Articles: 55
- Neutral: 58.18%
- Negative: 27.27%
- Positive: 14.55%
Sentiment Summary: Market news is mostly neutral at 58%, with negative articles at 27% and positive articles at 15%, indicating a mixed and slightly cautious tone.
Conclusion: The news flow does not show a clear directional bias for indices futures and remains balanced toward neutral coverage.
GLD,Gold Articles: 8
- Negative: 37.50%
- Positive: 37.50%
- Neutral: 25.00%
Sentiment Summary: GLD and gold news sentiment is balanced, with 38% negative, 38% positive, and 25% neutral coverage across 8 articles.
Conclusion: The article mix is evenly split between positive and negative tone, indicating no clear directional bias in the sentiment snapshot.
USO,Oil Articles: 21
- Positive: 61.90%
- Negative: 19.05%
- Neutral: 19.05%
Sentiment Summary: Oil-related coverage is predominantly positive, with 62% positive sentiment across 21 articles, while negative and neutral sentiment are each 19%.
Conclusion: The news flow shows a positive bias in oil sentiment, with positive articles outnumbering negative and neutral coverage.
Market Data Snapshot
ETF Snapshot of major stock market ETFs, Mag7, and others as of: July 14, 2026 05:00
Top Movers & Losers
- NVDA 211.80 Bullish 4.06% ▲
- IBIT 36.58 Bullish 3.86% ▲
- USO 120.17 Bullish 2.02% ▲
- DIA 524.69 Bullish 0.04% ▲
- AAPL 314.86 Bearish -0.77% ▼
- MSFT 384.93 Bearish -1.55% ▼
Major Index ETFs: SPY, QQQ, DIA, IWM, IJH
- QQQ 719.69 Bullish 1.12% ▲
- IJH 75.57 Bullish 0.44% ▲
- SPY 751.83 Bullish 0.36% ▲
- IWM 294.51 Bullish 0.35% ▲
- DIA 524.69 Bullish 0.04% ▲
Broadly bullish index ETF tone, led by QQQ at +1.12% as the most bullish mover. IJH followed at +0.44%, with SPY at +0.36% and IWM at +0.35%. DIA was the least positive mover at +0.04%, effectively near-flat.
Mag 7 Stocks: AAPL, MSFT, GOOG, AMZN, META, NVDA, TSLA
- NVDA 211.80 Bullish 4.06% ▲
- GOOG 357.33 Bullish 1.90% ▲
- META 661.04 Bullish 0.66% ▲
- TSLA 396.18 Bullish 0.36% ▲
- AMZN 247.49 Bullish 0.07% ▲
- AAPL 314.86 Bearish -0.77% ▼
- MSFT 384.93 Bearish -1.55% ▼
Mag7 snapshot is Mixed: NVDA leads as the most bullish mover at +4.06%, followed by GOOG at +1.90%, META at +0.66%, TSLA at +0.36%, and AMZN near-flat at +0.07%; on the downside, MSFT is the most bearish mover at -1.55%, with AAPL also bearish at -0.77%.
Cross-Market ETFs: TLT, GLD, USO, IBIT
- IBIT 36.58 Bullish 3.86% ▲
- USO 120.17 Bullish 2.02% ▲
- GLD 372.15 Bullish 1.37% ▲
- TLT 84.08 Bullish 0.13% ▲
Bullish tone across the group: IBIT led with +3.86%, followed by USO at +2.02% and GLD at +1.37%; TLT was nearly flat at +0.13%, the least positive mover.
ETF, Mag7, and Cross-Market ETF Insights
Overall Tone
Broadly risk on, with equities and growth-led Mag7 names mostly higher and only a few notable laggards. The tone is constructive, though leadership is selective rather than uniform.
Equity ETFs and Mag7:
Major index ETFs were mostly positive and tightly clustered, with QQQ leading the group at +1.12% while SPY, IWM, IJH, and DIA were all near-flat to modestly higher between +0.04% and +0.44%. Mag7 action was mixed but clearly led by NVDA at +4.06%, followed by GOOG at +1.90% and META at +0.66%, while MSFT was the most bearish mover at -1.55% and AAPL also softened at -0.77%.
Cross-Market ETFs:
Cross-market flows were aligned with the equity bid, with IBIT the most bullish mover at +3.86%, USO also strong at +2.02%, and GLD firm at +1.37%. TLT was essentially flat at +0.13%, making it the least positive mover in the group and signaling muted demand for duration relative to the stronger moves in crypto, energy, and gold.
Futures Indices – Higher Time Frame Analysis
Summary of the current state of US Indices Futures based on higher time-frame (HTF) technical analysis as of: 2026-07-14: 17:00 CT.
US Indices Futures
- ES Yearly/Monthly above F0%, weekly WSFG below NTZ, daily above 20/55/100/200-day benchmarks, UTrend pivots, resistance 7648.75-7693.50, support 7628.75.
- NQ Yearly above F0%, weekly/monthly below NTZ, daily below 5/10/20-day benchmarks, long-term benchmarks above price, pivot high 31090, support 28909.75 and 28510.00.
- YM Yearly above F0%, weekly/monthly below NTZ, daily below weekly/monthly zero lines, pivot downtrend from 53568, support 51006, long benchmarks remain rising.
- EMD Yearly above center, weekly/monthly below NTZ, daily below weekly/monthly zero lines, fresh weekly highs near 3892.4, support 3724.0 and 3692.9, benchmarks stacked higher.
- RTY Yearly above midpoint, weekly/monthly below center, daily below weekly/monthly midlines, resistance 3068.4, support 2943.4 then 2828.1, 55/100/200-day structure still rising.
- FDAX Yearly above F0%, weekly/monthly below F0%, daily below weekly/monthly grids, highs near 26064, support 24892 then 24226, benchmarks remain upward sloped.
Overall State
- Short-Term: Bearish
- Intermediate-Term: Neutral
- Long-Term: Bullish
Conclusion
HTF structure remains anchored by yearly grids and rising 55/100/200-day benchmarks across all listed indices. ES and EMD hold the clearest bullish higher-timeframe alignment, while NQ, YM, RTY, and FDAX show weekly and daily session grids below their F0%/NTZ centers, reflecting corrective rotation beneath recent highs. Swing pivot structures are mixed near overhead resistance on ES, NQ, YM, EMD, RTY, and FDAX, with recent highs acting as reference points and nearby support clustered at prior pivot lows and benchmark zones. Broad correlation remains constructive long-term, while short-term session grids are weaker across most contracts.
Note: Intra-day counter-trend pullbacks or retracements may occur, HTF is context for informational usage and market structure. Glossary: Session Fib Grids periods of YSFG:’Yearly’, MSFG:’Monthly’, WSFG:’Weekly’
For full details visit: AlphaWebTrader Technicals
ES Daily View
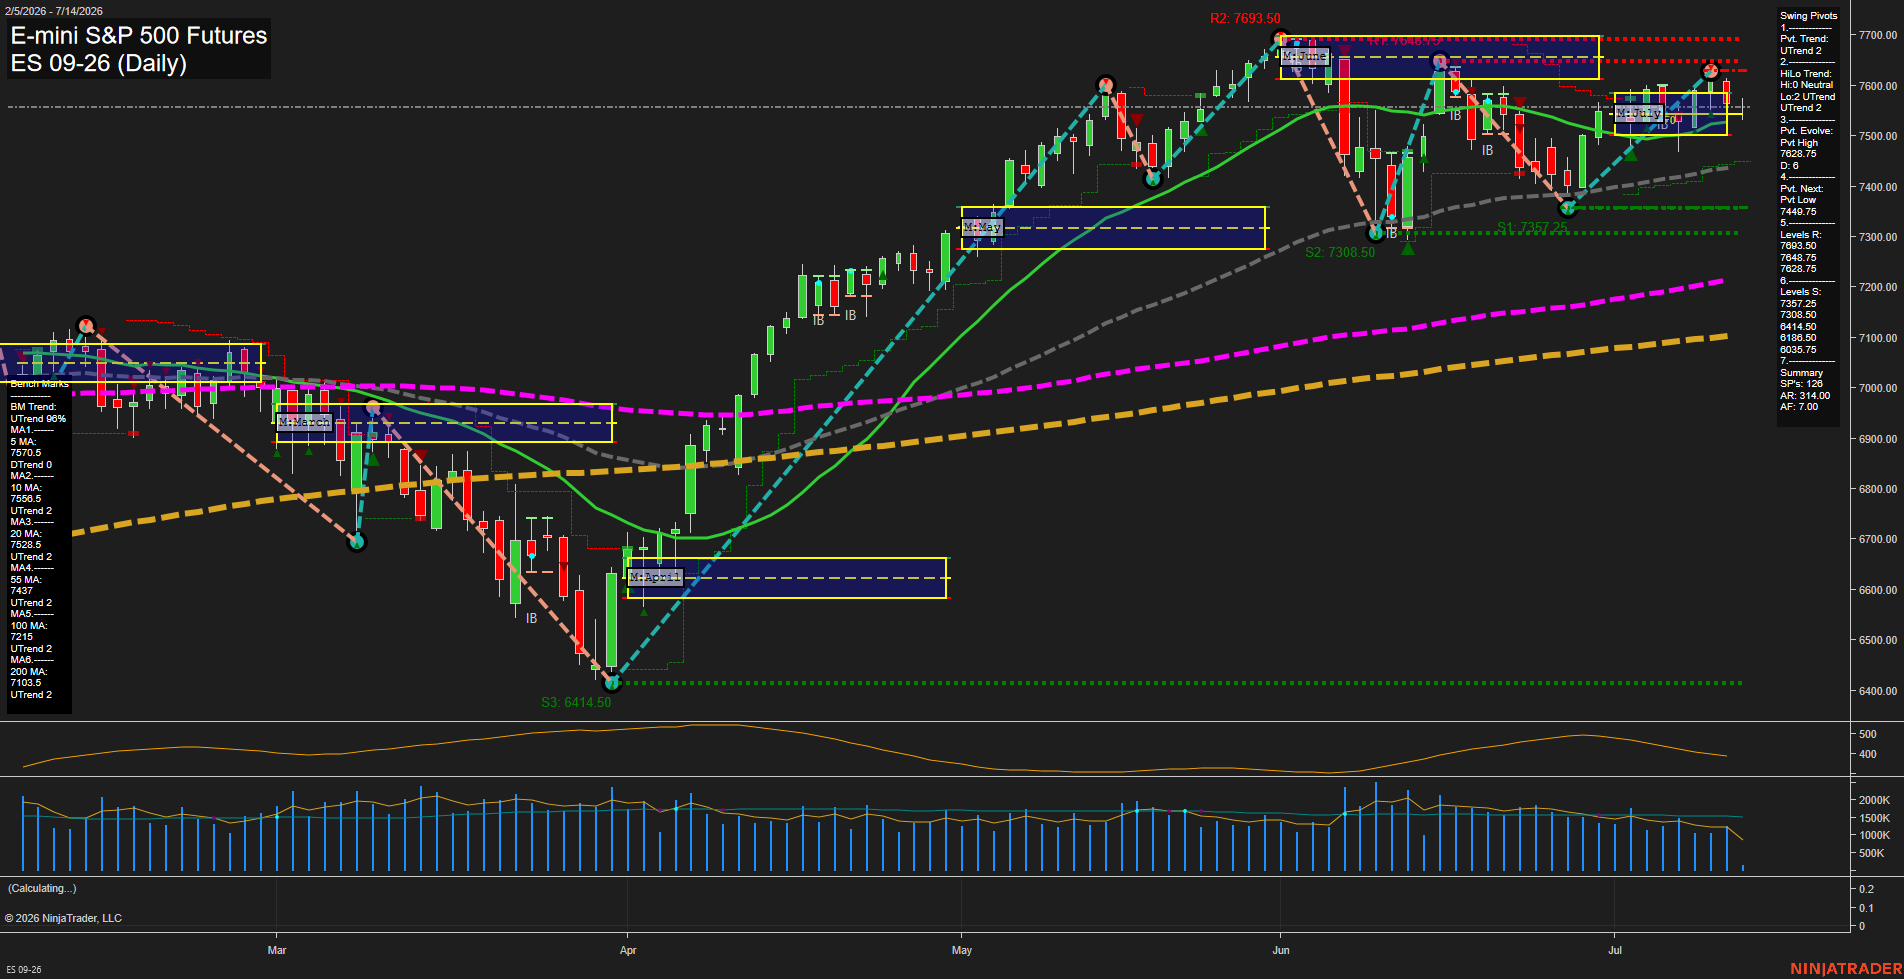
Overall Rating
- Short-Term: Bullish
- Intermediate-Term: Bullish
- Long-Term: Bullish.
Key Insights Summary
Price is holding above the 20-, 55-, 100-, and 200-day benchmarks, keeping the broader structure firmly constructive, while the short-term swing state remains in UTrend with the most recent pivot sequence still pointing higher. The chart has transitioned from the spring selloff into a strong summer recovery, followed by a consolidation just below the recent pivot high near 7628.75 and the upper resistance band around 7648.75 to 7693.50. Weekly fib positioning is still below its NTZ midpoint, which reflects a softer weekly posture versus the monthly and yearly grids that remain positive. Recent inside-bar and rejection behavior around the June highs shows a market digesting gains after a steep rally, with price action currently balancing between breakout continuation and range rotation near overhead resistance.
View charts on: AlphaWebTrader HTF Charts
NQ Daily View
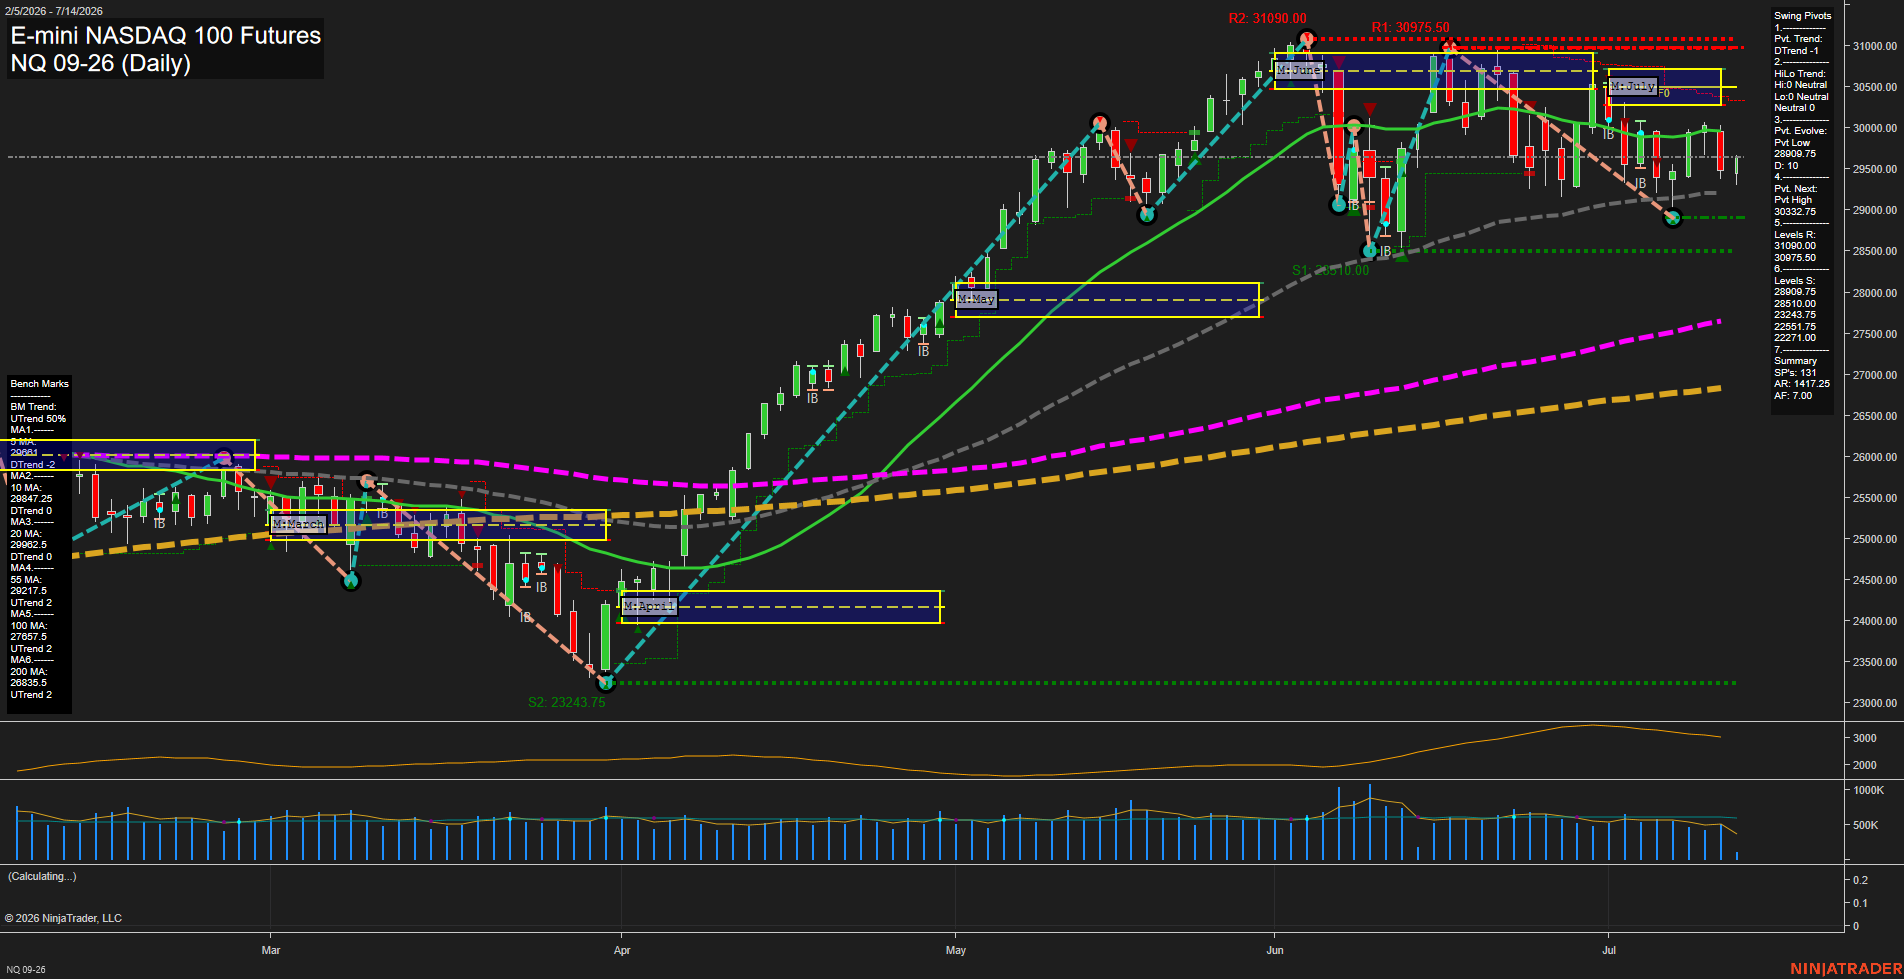
Overall Rating
- Short-Term: Bearish
- Intermediate-Term: Bearish
- Long-Term: Bullish.
Key Insights Summary
The daily structure remains in a post-impulse consolidation zone after the strong May-to-June rally and the sharp June reversal. Price is trading below the weekly and monthly F0%/NTZ centers, keeping the short- and intermediate-term session grids aligned to the downside, while the yearly grid still holds an upward long-cycle bias. Swing pivots show a dominant downtrend in the current pivot sequence, with resistance clustered near 30975.50 to 31090.00 and support focused at 28909.75 and 28510.00. Price is holding below the 5, 10, and 20 day benchmarks, but still above the 55, 100, and 200 day averages, which reflects a bearish near-term phase inside a broader bullish secular structure. The recent signal cluster is consistent with the pullback and rejection behavior seen after the June highs, with volatility expanding enough to support larger daily ranges and broader rotational swings.
View charts on: AlphaWebTrader HTF Charts
CL Daily View
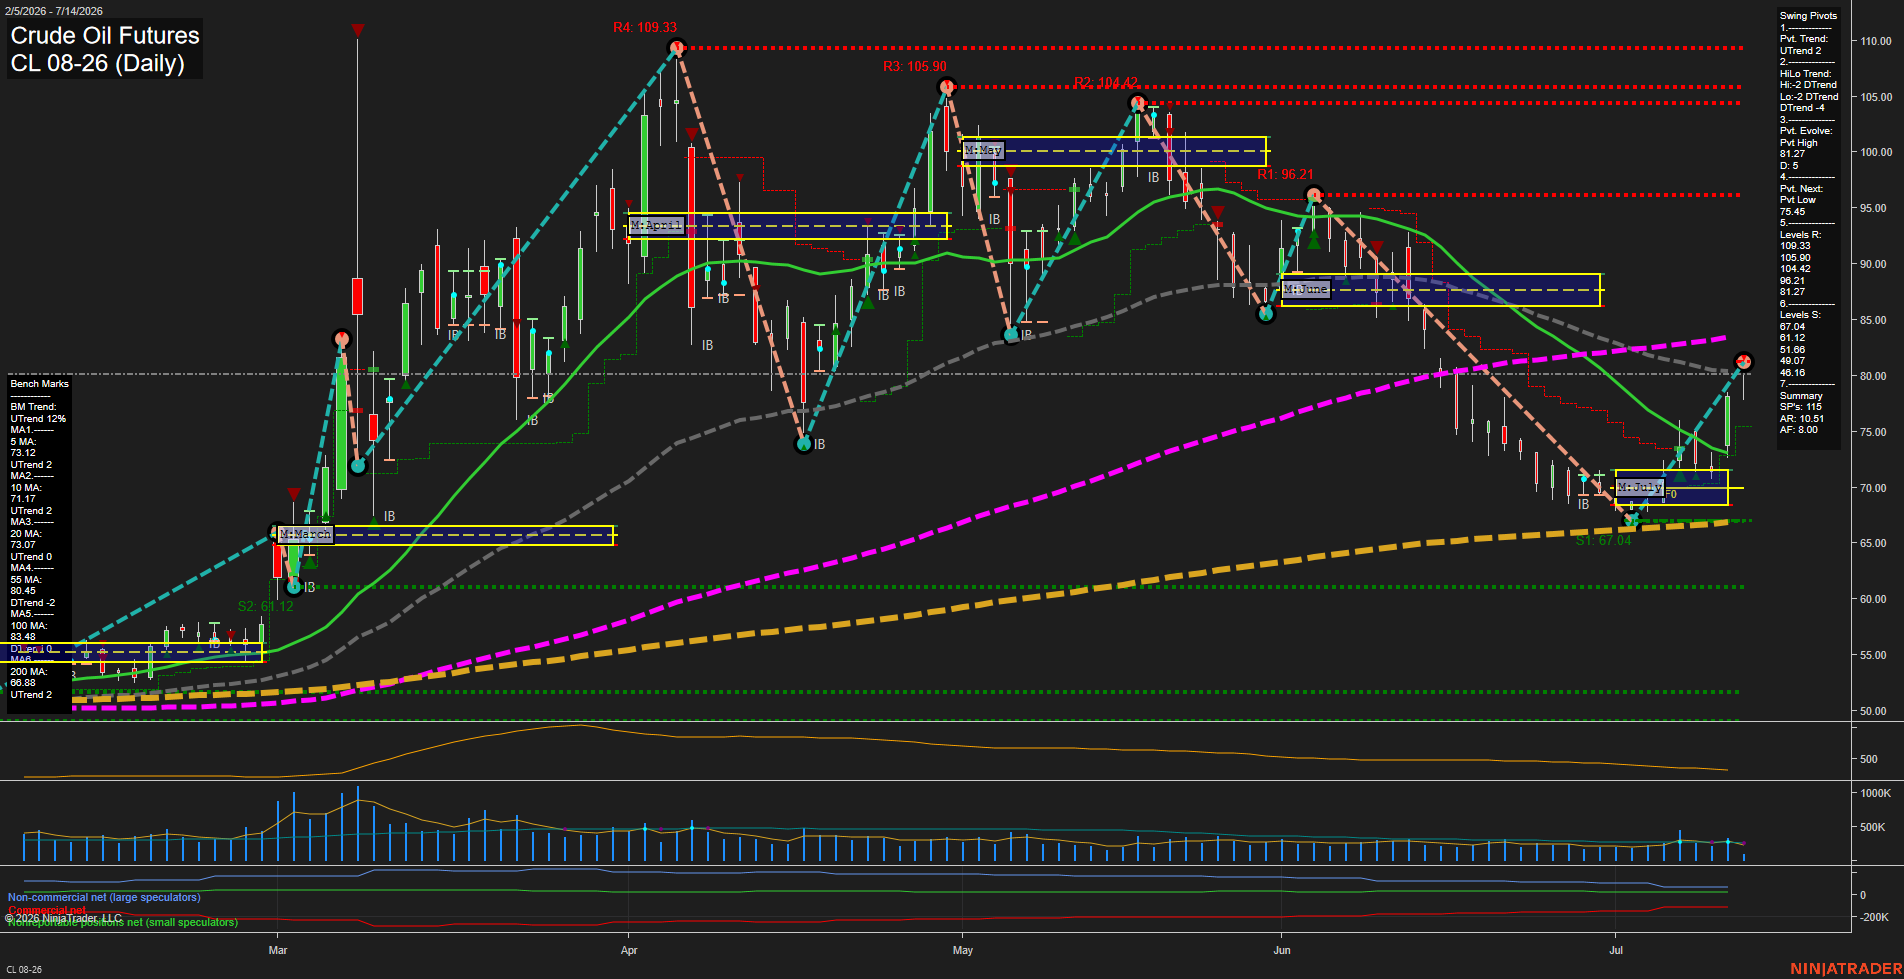
Overall Rating
- Short-Term: Bullish
- Intermediate-Term: Neutral
- Long-Term: Bullish.
Key Insights Summary
Crude oil is rebounding from the early-July selloff and has reclaimed the upper portion of the recent monthly NTZ area, with price now pressing back toward the prior pivot high zone near 81.27. The short-term structure has turned constructive with the latest pivot sequence shifting to an uptrend, while the weekly and monthly session grids remain biased above F0%, supporting the recovery phase. Intermediate-term structure is still mixed because the 55-day benchmark remains above price and the swing pivot hi/lo trend is not yet fully repaired, so the chart still reflects a transition from correction back toward trend recovery. Long-term structure remains firm, with the yearly session context and 200-day benchmark still aligned to the broader bullish backdrop.
View charts on: AlphaWebTrader HTF Charts
GC Daily View
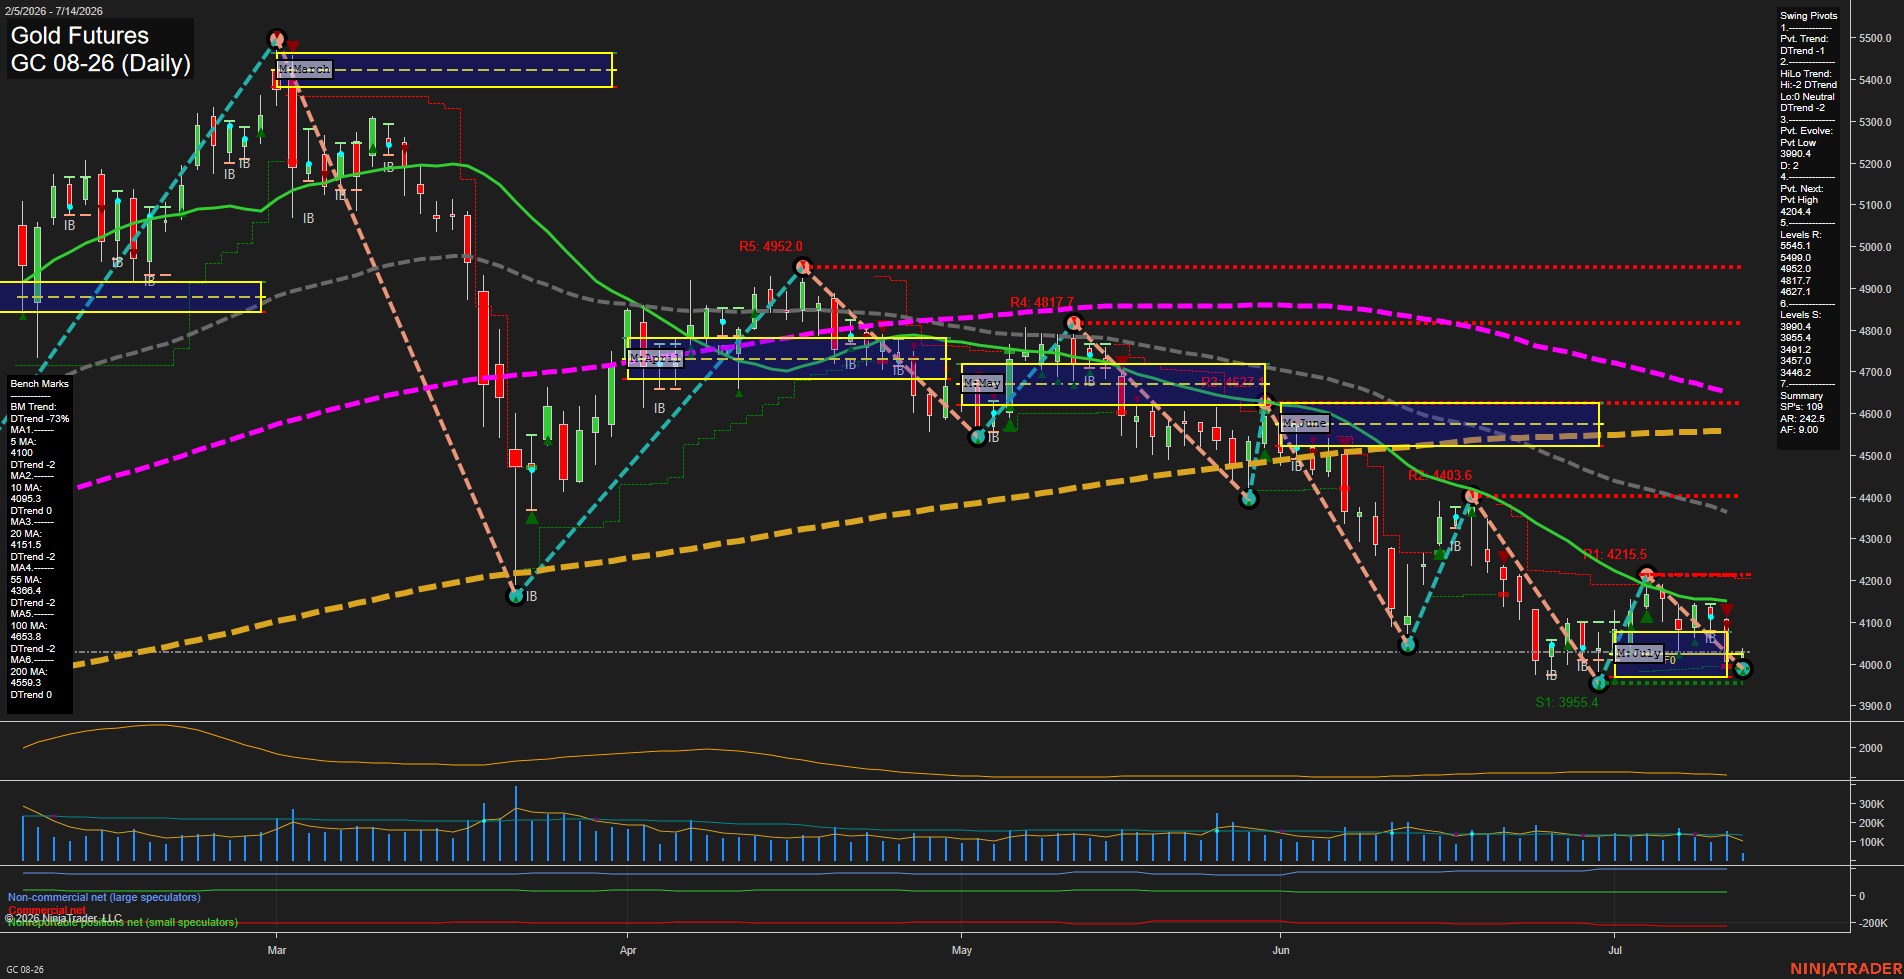
Overall Rating
- Short-Term: Bearish
- Intermediate-Term: Bearish
- Long-Term: Bearish.
Key Insights Summary
Gold futures are trading in a sharply lower daily swing structure after a fast selloff from the 4200 area and a continued sequence of lower highs and lower lows. Price is now pressed under the key daily benchmark stack, with all major moving averages pointed lower and overhead resistance layered at 4095 to 4151 and then 4368. The weekly session fib remains below its F0%/NTZ reference, matching the short-term downtrend, while the monthly session fib still sits above its F0%/NTZ and keeps the intermediate-term view mixed-to-firmer relative to the broader decline. The swing pivot map remains bearish with DTrend active, support clustered near 3955 and 3900, and the next major pivot high still well above at 4204. Recent trade signals reflect the alternating reaction to the July range, but the broader tape remains dominated by downside momentum, heavy volatility, and a consolidation-to-breakdown character after repeated rejection near prior reaction highs.
View charts on: AlphaWebTrader HTF Charts