
U.S. stocks rose on softer inflation data and megacap tech strength, while oil, gold, Fed scrutiny, and Middle East tensions shaped market tone.
Fundamentals: U.S. stocks finished higher as softer inflation data and early earnings strength supported buying, with megacap technology leading gains while some semiconductor shares lagged. Gold advanced on lower yields and a weaker dollar, oil held firm amid inventory draws and geopolitical tension, and Fed messaging kept policy focus in view.
Technicals: U.S. market internals ended the session with a mixed tone, as AAPL, GOOG, and META posted strong gains while QQQ and TSLA slipped. Futures and index structure remained broadly constructive on higher time frames, but several daily and weekly charts showed short-term pressure, consolidation, or corrective action beneath recent highs.
After Market Close daily snapshot: market news summary and sentiment, major ETFs, Magnificent 7 analysis, Indices Futures Higher Time Frame Analysis, and E-mini S&P500, Nasdaq 100, NYMEX Crude, Gold Futures Daily Chart analysis.
As of: July 15, 2026 05:00 CT
Market News Summary:
Stocks gained on softer inflation data and megacap technology strength, while oil, gold, and Fed-related headlines kept cross-asset volatility in focus.
Primary Drivers & Risks:
- Primary Driver: Softer inflation and tech strength
- Primary Risk: Higher oil and policy tension
Tone:
Mixed but constructive for equities, with inflation relief offset by energy and geopolitical pressure.
Stock Market / ETFs / Indices:
U.S. stocks finished higher as softer inflation data and a strong earnings start supported buying. Megacap technology led gains while semiconductor stocks lagged, and commentary noted renewed interest in Nasdaq-100 and AI-linked exposure.
Geopolitical:
Renewed Middle East and U.S.-Iran tensions appeared across the headlines, alongside concerns over sanctions-related tariff language tied to Russia. These developments added a risk backdrop for global markets.
Oil / Energy:
U.S. crude inventories fell more than forecast, while WTI and Brent held firm earlier before later profit-taking. Traders also focused on renewed Strait of Hormuz tension and rising gas-price bets, keeping energy inflation in view.
Gold / Metals:
Gold moved higher as softer U.S. inflation data pressured Treasury yields and the dollar, while silver slipped. Several items noted gold holding above key levels, though resistance remained in view.
Fed / Financials:
Fed Chair Kevin Warsh faced Senate scrutiny and defended central-bank independence. He also said AI-related price gains are not necessarily inflationary, while commentary stressed inflation as the central policy focus.
Macro / Other:
Industrial warehouse construction rose on demand from data-center equipment suppliers. Other headlines pointed to cooler PPI, rotation into Chinese ADRs, and broad concern over consumer fundamentals, elevated gas prices, and stagnant wage growth.
Conclusion:
Soft inflation data and megacap technology strength supported U.S. equities, while the Dow and broader indices gained on the session. Earnings momentum also helped offset weakness in chip stocks.
Energy prices, Middle East tension, and tariff concerns remained important cross-currents for indices futures. Fed messaging, higher gas-price expectations, and weaker consumer-fundamental commentary added pressure beneath the surface.
Market News Sentiment
Market News Articles: 45
- Neutral: 51.11%
- Positive: 24.44%
- Negative: 24.44%
Sentiment Summary: Among 45 market news articles, sentiment is mostly neutral at 51%, with positive and negative articles evenly split at 24% each.
Conclusion: The news flow is balanced and largely neutral, with no clear directional sentiment bias.
GLD,Gold Articles: 16
- Positive: 37.50%
- Negative: 31.25%
- Neutral: 31.25%
Sentiment Summary: Gold-related articles were mixed, with 38% positive, 31% negative, and 31% neutral sentiment across 16 articles.
Conclusion: The news flow shows a balanced but slightly positive tone for gold, with no dominant sentiment direction.
USO,Oil Articles: 11
- Negative: 54.55%
- Positive: 27.27%
- Neutral: 18.18%
Sentiment Summary: USO oil coverage is mostly negative, with 55% negative, 27% positive, and 18% neutral articles across 11 items.
Conclusion: The news flow around oil is tilted negative, which may be relevant for intraday attention to energy-linked index inputs.
Market Data Snapshot
ETF Snapshot of major stock market ETFs, Mag7, and others as of: July 15, 2026 05:00
Top Movers & Losers
- AAPL 327.50 Bullish 4.01% ▲
- GOOG 370.21 Bullish 3.60% ▲
- META 681.31 Bullish 3.07% ▲
- GLD 372.35 Bullish 0.05% ▲
- QQQ 717.74 Bearish -0.27% ▼
- TSLA 394.46 Bearish -0.43% ▼
Major Index ETFs: SPY, QQQ, DIA, IWM, IJH
- IWM 295.77 Bullish 0.43% ▲
- SPY 754.81 Bullish 0.40% ▲
- DIA 525.95 Bullish 0.24% ▲
- IJH 75.63 Bullish 0.08% ▲
- QQQ 717.74 Bearish -0.27% ▼
Mixed tone across the major index ETFs: IWM leads the group as the most bullish mover at +0.43%, followed by SPY at +0.40% and DIA at +0.24%; IJH is near-flat at +0.08%, while QQQ is the most bearish mover at -0.27%.
Mag 7 Stocks: AAPL, MSFT, GOOG, AMZN, META, NVDA, TSLA
- AAPL 327.50 Bullish 4.01% ▲
- GOOG 370.21 Bullish 3.60% ▲
- META 681.31 Bullish 3.07% ▲
- AMZN 254.96 Bullish 3.02% ▲
- MSFT 395.63 Bullish 2.78% ▲
- NVDA 212.50 Bullish 0.33% ▲
- TSLA 394.46 Bearish -0.43% ▼
Mag7 tone is Mixed but firmly led by AAPL at +4.01%, followed by GOOG +3.60%, META +3.07%, AMZN +3.02%, and MSFT +2.78%; NVDA is near-flat at +0.33%, while TSLA is the most bearish mover at -0.43%.
Cross-Market ETFs: TLT, GLD, USO, IBIT
- USO 121.38 Bullish 1.01% ▲
- IBIT 36.81 Bullish 0.63% ▲
- TLT 84.24 Bullish 0.19% ▲
- GLD 372.35 Bullish 0.05% ▲
Mixed-to-Bullish tone across the group, led by USO at +1.01% as the most bullish mover, followed by IBIT at +0.63%; TLT at +0.19% was near-flat, while GLD at +0.05% was the least positive mover.
ETF, Mag7, and Cross-Market ETF Insights
Overall Tone
Mixed-to-Bullish risk tone, with equities and most Mag7 names positive while QQQ and TSLA diverge slightly lower.
Equity ETFs and Mag7:
Major index ETFs were broadly constructive, led by SPY at +0.40%, while IWM +0.43% and DIA +0.24% stayed mildly positive and IJH was near flat at +0.08%. QQQ lagged the group at -0.27%, showing some softness in mega-cap growth even as the rest of equities held firm. Among Mag7, AAPL was the strongest mover at +4.01%, followed by GOOG +3.60% and META +3.07%, while TSLA was the most bearish mover at -0.43%.
Cross-Market ETFs:
Cross-market ETFs were mostly stable to slightly positive, with USO the strongest at +1.01% and IBIT also higher at +0.63%. TLT at +0.19% and GLD at +0.05% were near flat, suggesting only modest hedging demand relative to the equity tone. The group shows a mild risk-on backdrop with commodity and digital-asset strength outpacing the more defensive sleeves.
Futures Indices – Higher Time Frame Analysis
Summary of the current state of US Indices Futures based on higher time-frame (HTF) technical analysis as of: 2026-07-15: 17:00 CT.
US Indices Futures
- ES Weekly: short-term bearish, intermediate/long bullish, YSFG above midpoint, MSFG/WSFG mixed, price above 20/55/100/200D, pivots in uptrend, resistance 7628.75/7648.75/7693.50, support 7545.25/7357.25/7308.50.
- NQ Weekly: short-term bullish, intermediate neutral, long bullish, YSFG above NTZ, MSFG below center, price above 20/55/100/200D, UTrend pivot sequence, resistance 30975.50/31090.00, support 30293.75.
- YM Weekly: short-term neutral, intermediate/long bullish, YSFG/MSFG supportive, price at new highs above rising benchmark stack, pivots remain UTrend, support 52255/50136, resistance near 53586.
- EMD Weekly: short-term bullish, intermediate bearish, long bullish, YSFG constructive, MSFG below center, price above rising 5/10/20/55/100/200D stack, pivots UTrend, resistance 3840.6/3892.4, support 3724.0/3682.9.
- RTY Weekly: short-term bearish, intermediate bearish, long bullish, YSFG above midpoint, WSFG/MSFG below center, price below 5/10D but above 55/100/200D, pivot rejected at 3068, support 2943.4/2827.8.
- FDAX Weekly: short-term bullish, intermediate bullish, long bullish, YSFG above center, weekly/monthly fibs mixed but constructive, price above 55/100/200D, pivot trend up, resistance near 26064, support 25600/25250/24892.
Overall State
- Short-Term: Bearish
- Intermediate-Term: Bullish
- Long-Term: Bullish
Conclusion
HTF structure remains aligned to the larger uptrend across ES, NQ, YM, EMD, RTY, and FDAX, with yearly session fib grids broadly above midpoint or NTZ support and benchmark stacks mostly rising. Short-term conditions are mixed-to-bearish where weekly or daily session fib grids sit below F0% or NTZ, especially in RTY, FDAX daily, and the daily structures of ES, YM, and EMD. ES, NQ, and YM retain stronger intermediate and long-term correlation, while RTY shows the clearest lag at the top of its range. EMD and FDAX remain constructive on the higher time frames, though their daily charts show rotational pressure beneath nearby resistance. Overall, the HTF context reflects a broad bullish long-term structure with shorter-cycle pullback and consolidation phases against that backdrop.
Note: Intra-day counter-trend pullbacks or retracements may occur, HTF is context for informational usage and market structure. Glossary: Session Fib Grids periods of YSFG:’Yearly’, MSFG:’Monthly’, WSFG:’Weekly’
For full details visit: AlphaWebTrader Technicals
ES Daily View
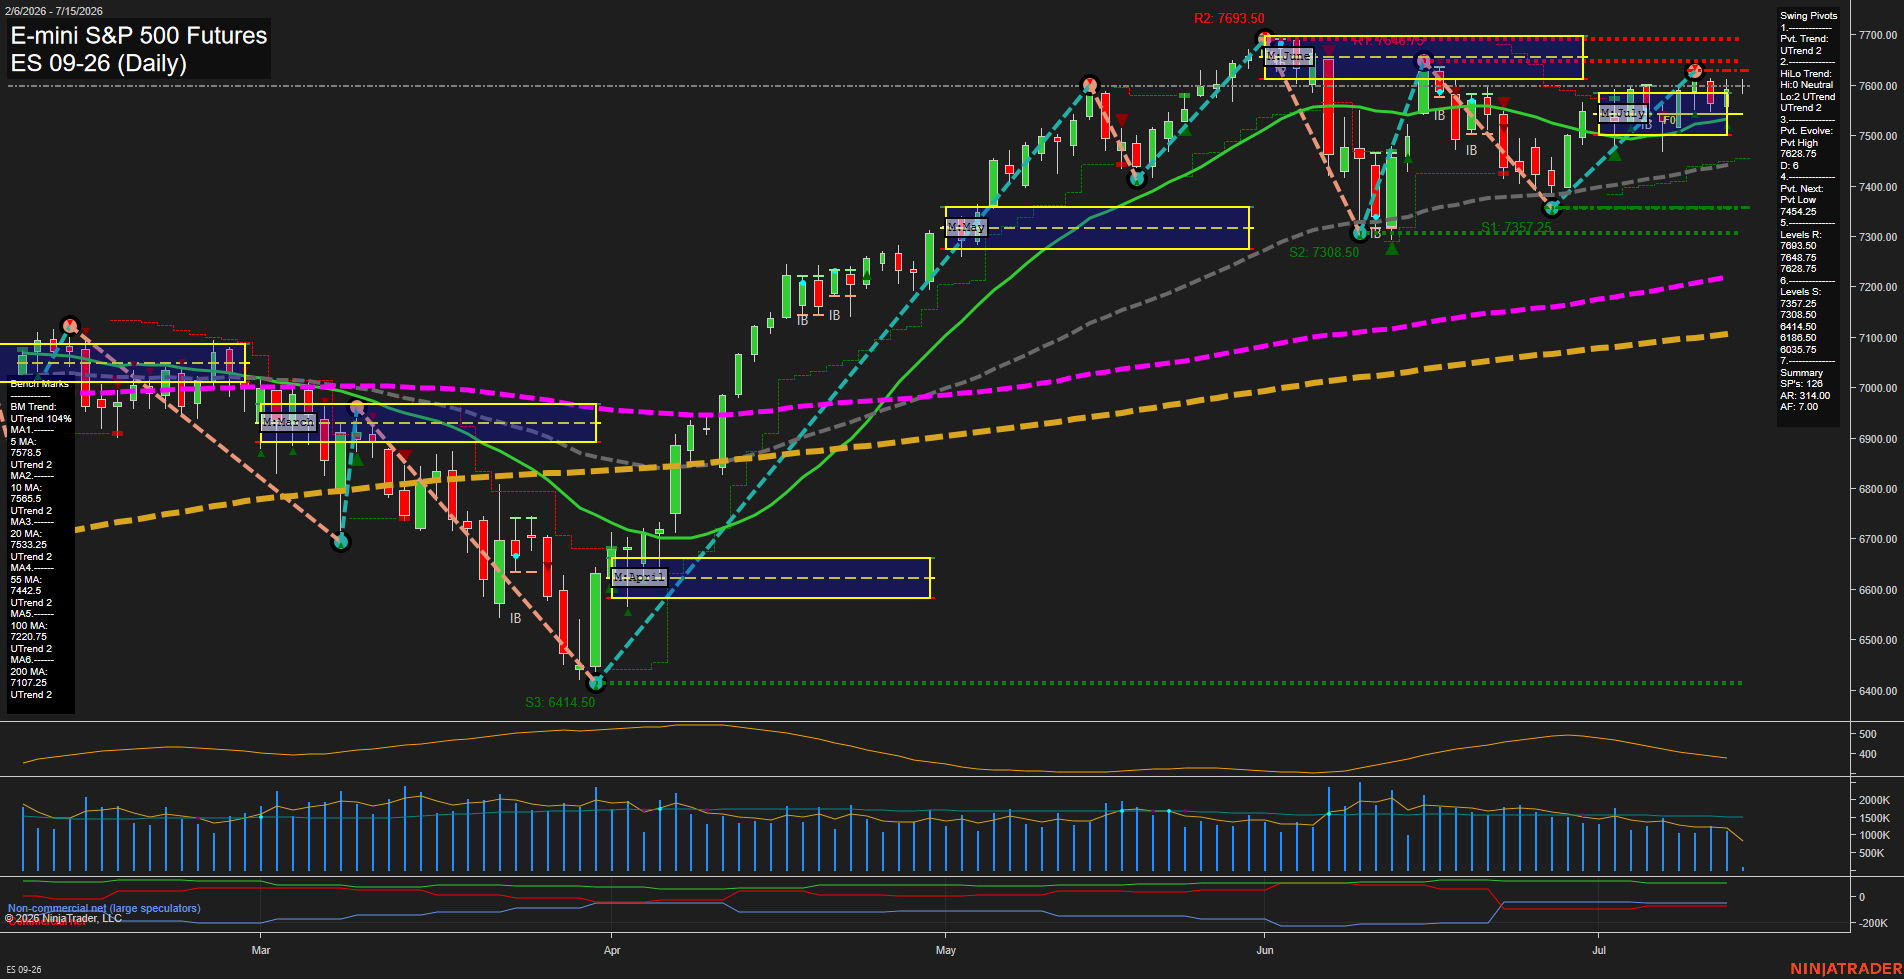
Overall Rating
- Short-Term: Bullish
- Intermediate-Term: Bullish
- Long-Term: Bullish.
Key Insights Summary
Price is holding above the 5, 10, 20, 55, 100, and 200 day benchmarks, which keeps the broader daily structure firmly positive. The pivot sequence remains in an uptrend, with price trading near the upper part of the recent range after a strong recovery from the early-June pullback and the July test of support. Weekly structure is still below the weekly F0%/NTZ midpoint and trends down, so the shorter-cycle backdrop is mixed versus the stronger monthly and yearly posture. The daily tape shows a constructive advance with medium-sized bars and average momentum, while nearby resistance sits at 7628.75, 7648.75, and 7693.50; support is layered at 7545.25, 7357.25, and 7308.50. Recent signals show renewed long bias on the monthly and TR120 measures after the prior weekly short signal, reflecting a transition from the July dip back into the larger uptrend.
View charts on: AlphaWebTrader HTF Charts
NQ Daily View
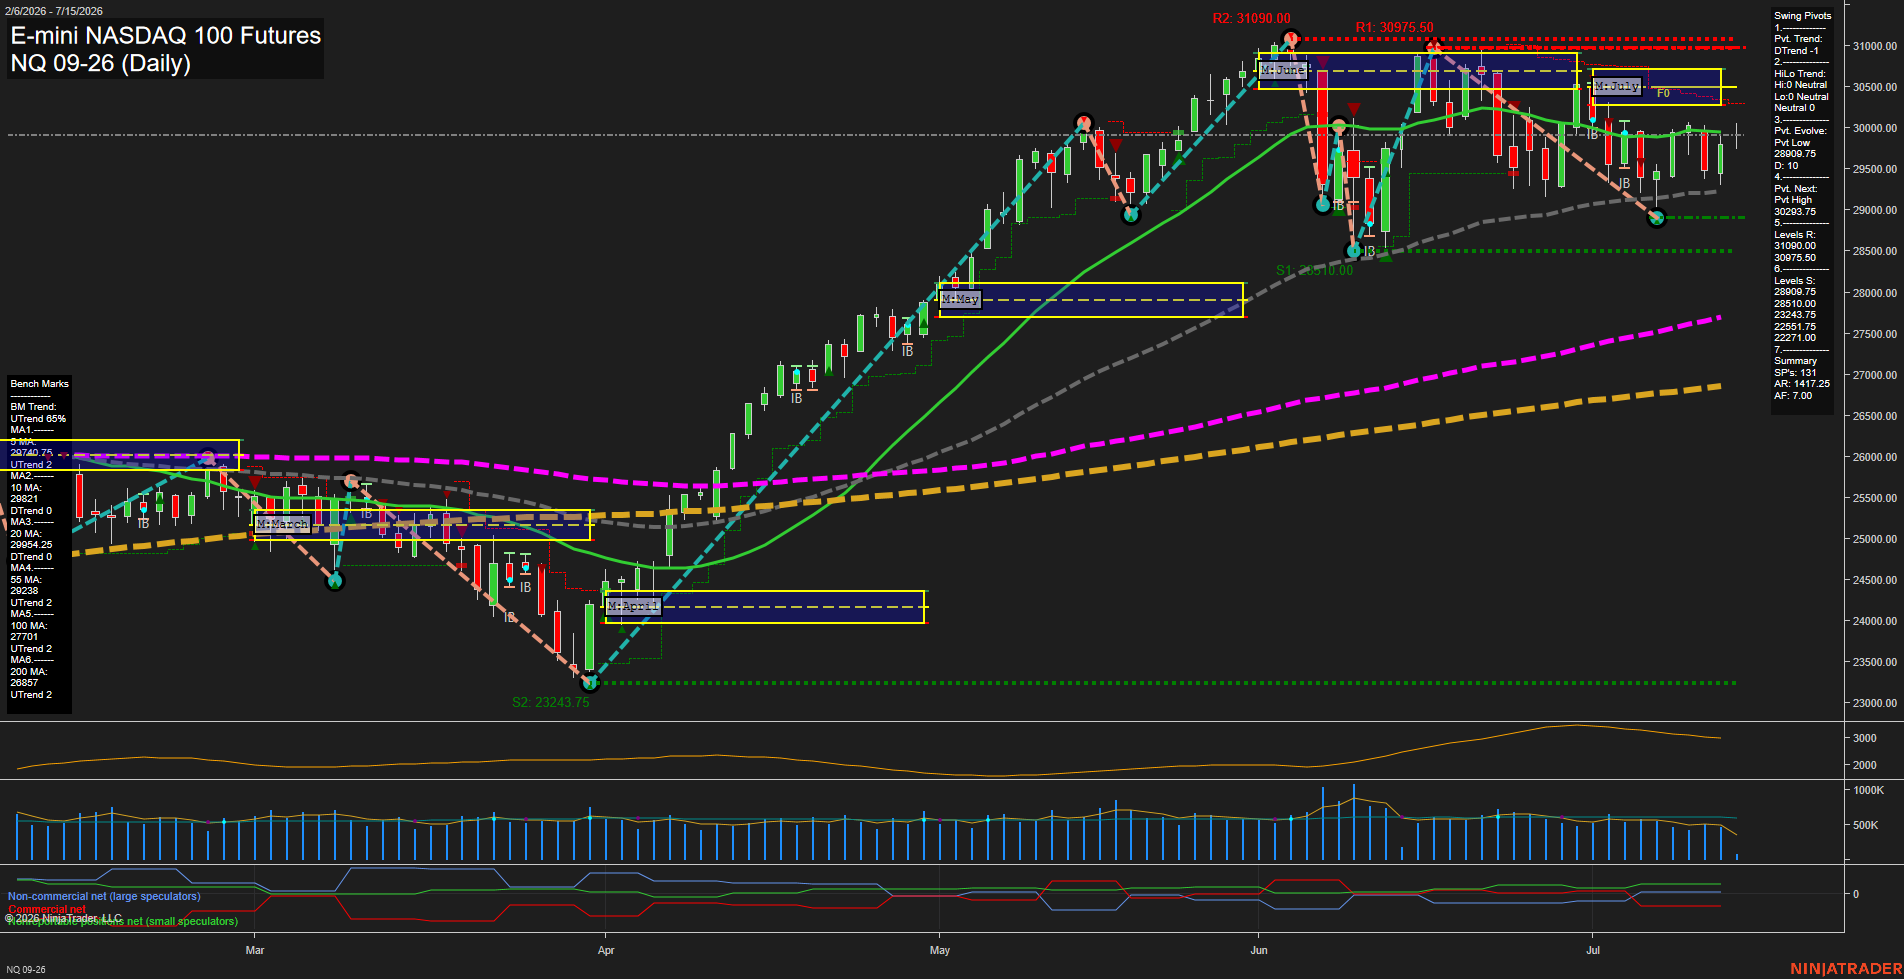
Overall Rating
- Short-Term: Bearish
- Intermediate-Term: Bearish
- Long-Term: Bullish.
Key Insights Summary
Price is trading below both the weekly and monthly session fib zero lines, which keeps the short- and intermediate-term structure tilted lower despite the longer-term 2026 yearly profile remaining firmly above its midpoint. The swing pivot model is in a down phase with a lower pivot evolve and the next opposite pivot defined higher at 30293.75, while nearby resistance remains stacked overhead at 30975.50 and 31090.00. Benchmark alignment is mixed but still corrective in the nearer time frames, with the 5-day above price support behavior and the 10-day and 20-day leaning lower, while the 55-day, 100-day, and 200-day remain constructive on the broader trend. The recent sequence shows a strong advance into June, followed by a pullback and consolidation band into July, leaving the chart in a choppy, range-to-corrective posture under the upper resistance shelf.
View charts on: AlphaWebTrader HTF Charts
CL Daily View
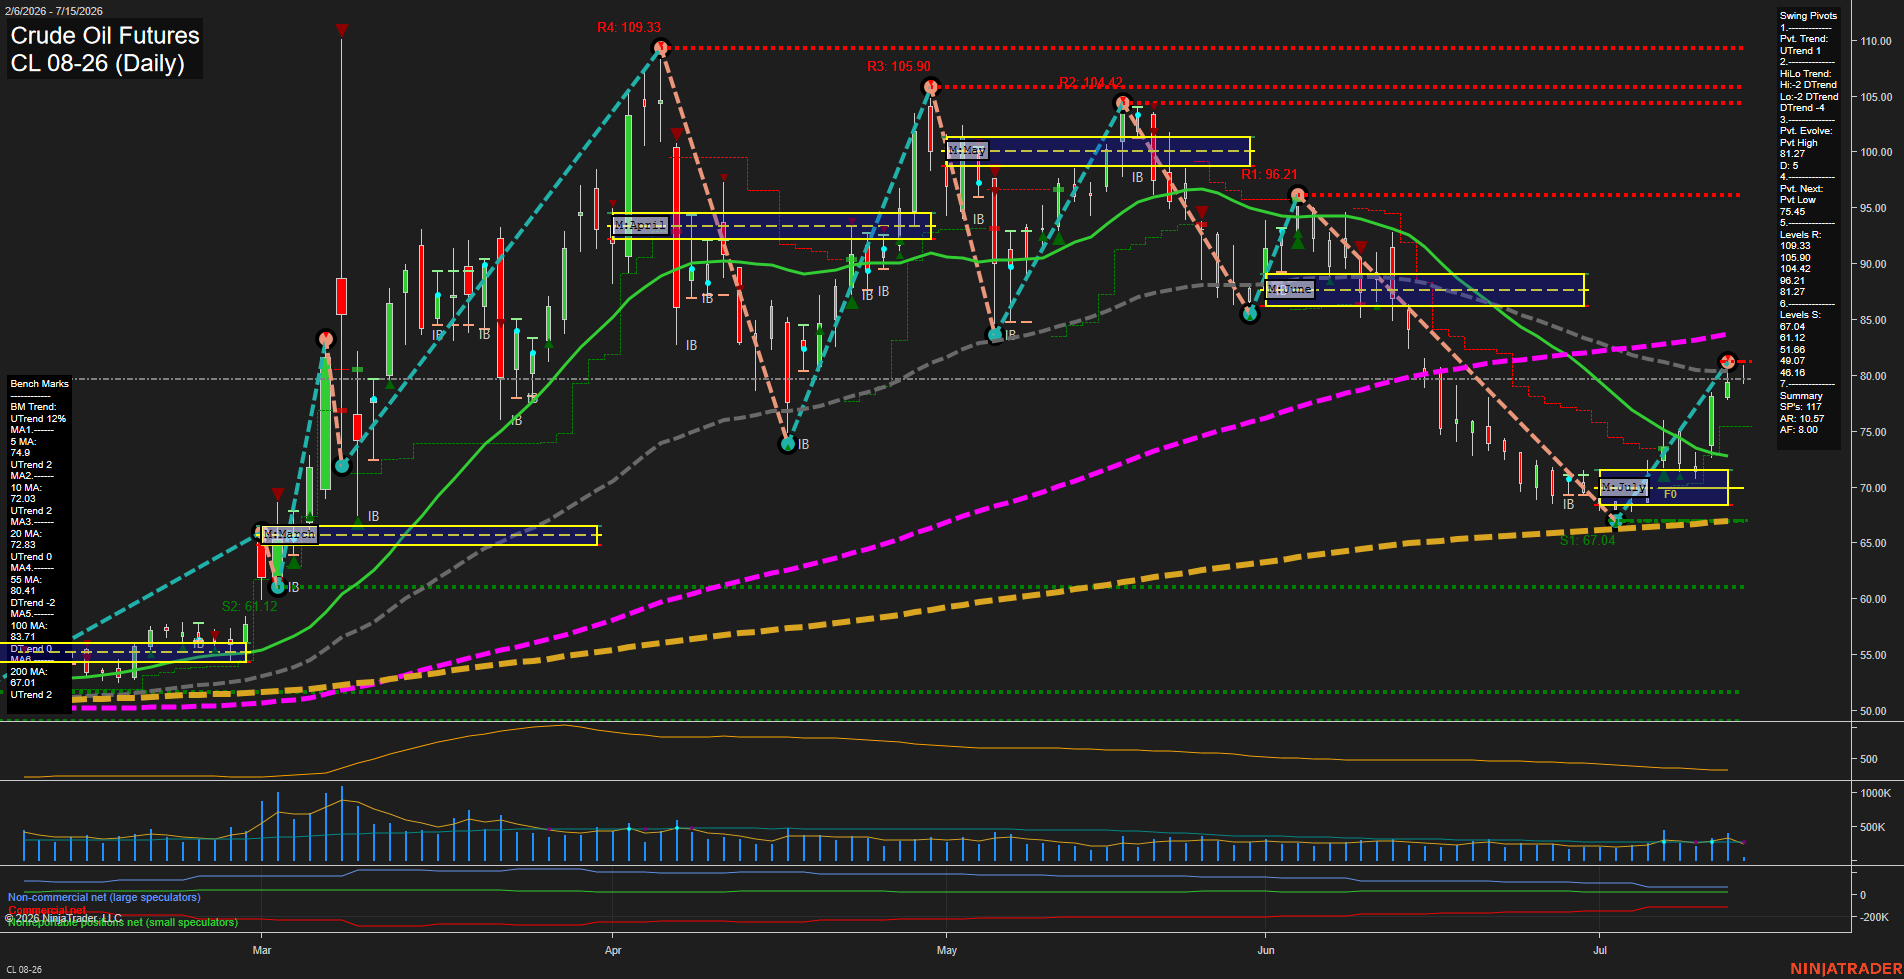
Overall Rating
- Short-Term: Bullish
- Intermediate-Term: Bullish
- Long-Term: Bullish.
Key Insights Summary
Crude oil remains in a constructive recovery phase after the early-July pullback, with price reclaiming the 75-area and pressing back toward the 79-80 zone. The short-term swing structure is aligned bullish, while the intermediate HiLo trend still reflects a broader downtrend backdrop, showing that the market is transitioning rather than fully escaping the prior decline. Price is above the weekly, monthly, and yearly F0%/NTZ reference zones, reinforcing a positive grid bias across all higher timeframes. The daily benchmark set is mixed but supportive overall: the 5, 10, and 20-day averages are rising, while the 55-day remains a nearby overhead pressure point. Recent long signals from WSFG, MSFG, and TR120 confirm improving momentum, and the current market profile resembles a rebound leg within a larger rotational structure.
View charts on: AlphaWebTrader HTF Charts
GC Daily View
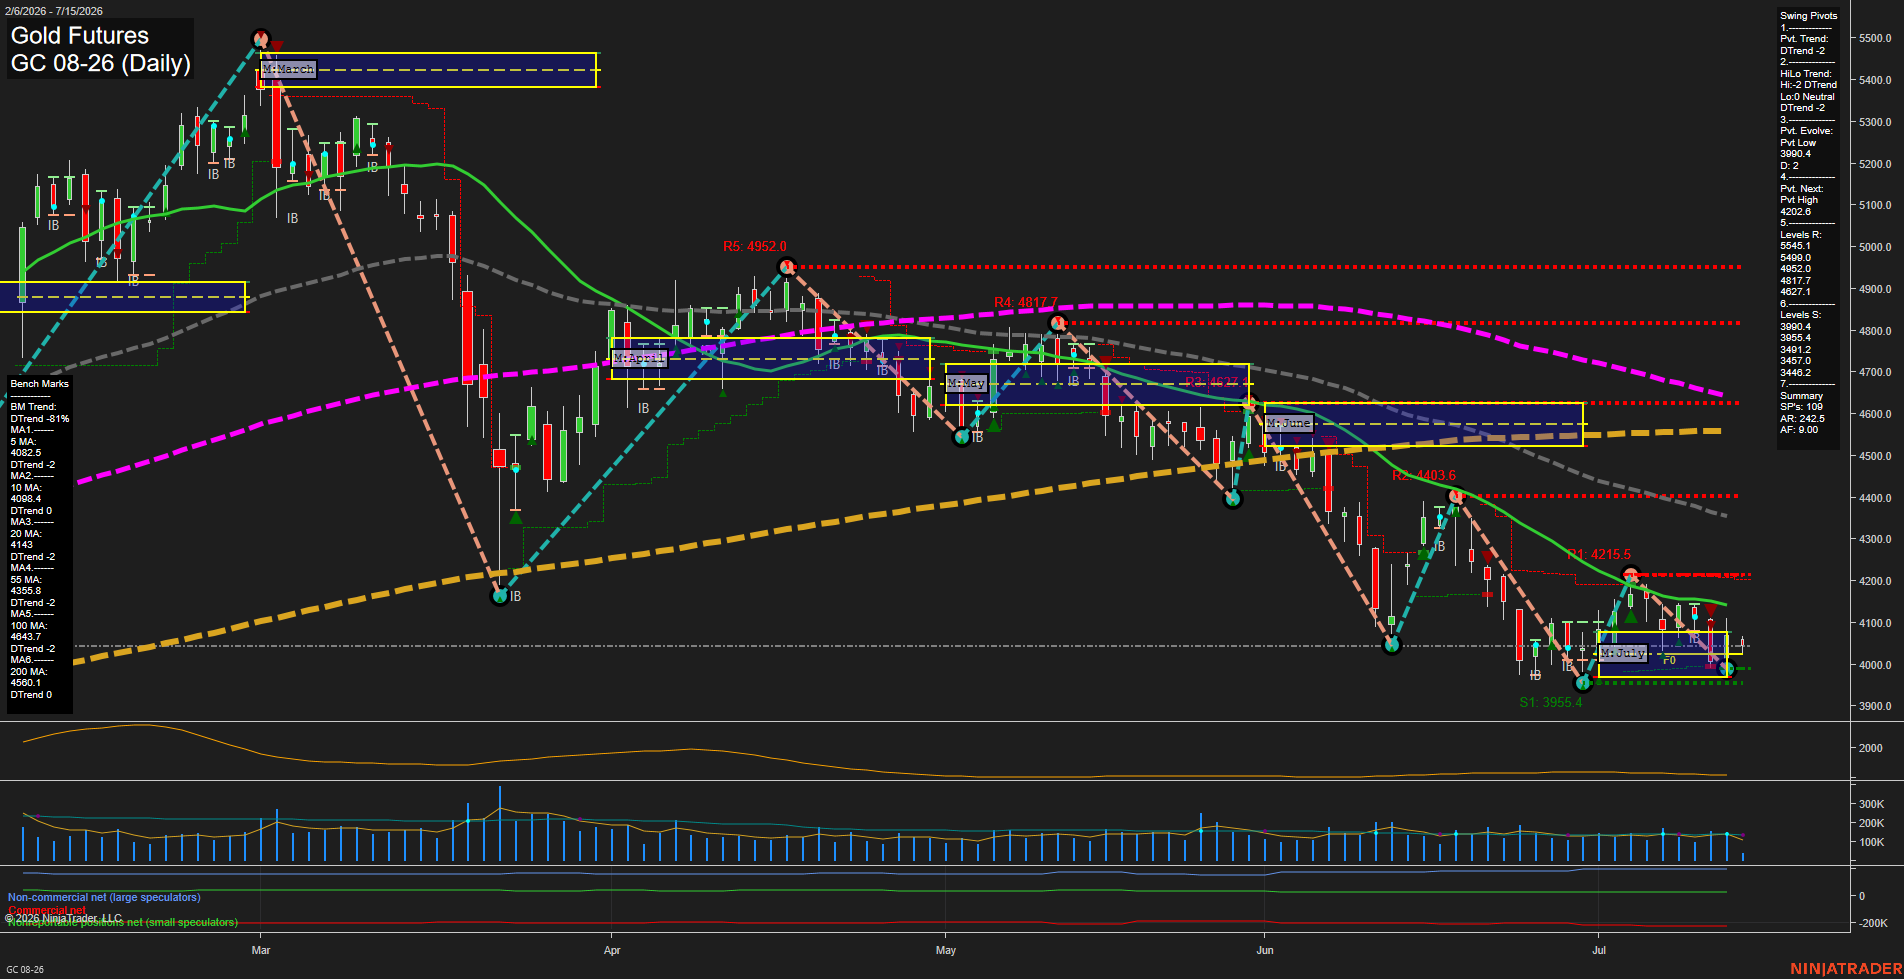
Overall Rating
- Short-Term: Bearish
- Intermediate-Term: Bearish
- Long-Term: Bearish.
Key Insights Summary
Gold futures are trading deep below the main benchmark moving-average stack, with the 5, 10, 20, 55, 100, and 200 day measures all sloping down and positioned overhead, confirming persistent downside structure. The daily swing pivot model is in DTrend, with the next pivot marked as a pivot high, while price remains pinned near the lower July session fib zone after a sharp selloff and bounce attempts. Weekly fib structure is below the NTZ midpoint, monthly structure remains slightly above its midpoint bias, and the yearly framework is still negative, reflecting a broader bearish backdrop despite short countertrend rebounds. Recent trade signals show alternating short-term reversal activity, but the dominant chart pattern is a lower-high, lower-low sequence with repeated rejection near prior resistance shelves and a late-month breakdown into the 3900-4050 area.
View charts on: AlphaWebTrader HTF Charts