NYSE pre-market radar tracks ETF movers, index futures and key U.S. data as oil gains on Hormuz tensions keep inflation and tech in focus.
Fundamentals: Investors enter the NYSE pre-market session with attention on U.S. retail sales, jobless claims and the Philadelphia Fed manufacturing index. Middle East tensions and potential Strait of Hormuz supply disruptions have pushed oil higher, keeping energy-driven inflation in focus. Big Tech and chip shares remain key equity themes amid questions over AI-related earnings support, while tariffs add trade and supply-chain uncertainty.
Technicals: Pre-market market radar shows strong prior-session gains in Apple, Alphabet and Meta, while QQQ and Tesla closed lower. Futures technical conditions remain broadly constructive in ES and YM, but near-term signals are mixed to bearish in NQ, RTY and FDAX. Key pivot levels, moving averages and Fib-grid readings outline consolidation, pullback and resistance areas across major index contracts.
Pre-Market Trading 360° view Market Radar of: holidays, earnings, eco-news, market-news summary, news sentiment, prior session major ETFs, MAG7, Higher Time Frame Analysis Indices Futures Summary, and E-mini S&P500, Nasdaq 100, NYMEX Crude, Gold Futures Daily Chart analysis.
As of: July 16, 2026 07:16 CT
EcoNews Radar U.S. Events
| Day | Time | Impact | Event |
|---|---|---|---|
| Thu | 08:30 | Medium | Core Retail Sales m/m |
| Thu | 08:30 | Medium | Philly Fed Manufacturing Index |
| Thu | 08:30 | Medium | Retail Sales m/m |
| Thu | 08:30 | Medium | Unemployment Claims |
| Fri | 10:00 | Medium | Prelim UoM Consumer Sentiment |
| Fri | 10:00 | Medium | Prelim UoM Inflation Expectations |
EcoNews Summary
No qualifying high-impact EcoNews events are listed. The listed releases are medium impact and are not directly related to oil, crude inventories, energy prices, or petroleum supply; they are excluded under the stated criteria.
Event Notes:
- No qualifying events listed.
Conclusion:
There is no qualifying single most important day or event this week under the provided event-selection criteria.
For full details visit: Forex Factory EcoNews
Market News Summary:
Middle East conflict risk and rising oil prices dominated the overnight market backdrop, while AI-led equity leadership faced renewed scrutiny.
Primary Drivers & Risks:
- Primary Driver: Strait of Hormuz supply disruption fears
- Primary Risk: Energy-driven inflation and conflict escalation
Tone:
Risk-sensitive, with inflation and geopolitical cross-currents.
Stock Market / ETFs / Indices:
Major indexes rose alongside a Big Tech rally, though commentary questioned whether gains in Alphabet, Microsoft, Meta, and Amazon reflected changing fundamentals. Chip stocks remained under examination despite a strong TSMC earnings result, while reports highlighted high market concentration, pressure on momentum shares, and uneven 2026 performance among hyperscalers.
Geopolitical:
U.S. strikes on Iranian military sites and Iran’s warning over a Strait of Hormuz “red line” intensified concerns around wider conflict and transit through the waterway. The U.S. also announced a 25% tariff on most Brazilian goods, with a separate proposed forced-labor duty adding trade-policy uncertainty.
Oil / Energy:
Oil prices rose for a fourth consecutive day as conflict concerns raised the prospect of supply disruptions through the Strait of Hormuz. Gas-price prediction markets placed an 88% probability on a national average above $4 per gallon by end-July, while low U.S. strategic reserve levels remained in focus despite the Energy Department citing a much lower operational minimum.
Gold / Metals:
Gold trading reflected competing inputs: softer U.S. consumer and producer inflation data pressured Treasury yields and the dollar, while elevated crude prices and Hormuz tensions sustained inflation concerns. Central-bank gold accumulation and sovereign demand linked to U.S. sanctions and trade policy remained supportive themes.
Fed / Financials:
Inflation remained the central Fed issue, with commentary describing a hold in policy despite softer recent inflation readings. Rising energy prices and global policy tightening, including the Bank of Korea’s first rate increase since 2023, underscored persistent inflation pressure.
Macro / Other:
Manufacturing shares drew increased short interest amid supply-chain concerns connected to Hormuz tensions. European companies entered a comparatively strong earnings season, though investors continued to flag Europe’s weaker AI growth exposure versus the United States.
Conclusion:
Oil and geopolitical developments are the dominant drivers, centered on conflict risk and the Strait of Hormuz. Inflation implications remain closely tied to energy prices.
Equity leadership remains concentrated in technology and AI-related shares, with questions around earnings support and investment payoffs. Softer U.S. inflation data offsets part of the energy-price pressure, while tariffs and supply-chain stress add cross-currents.
Market News Sentiment
Market News Articles: 41
- Neutral: 53.66%
- Negative: 29.27%
- Positive: 17.07%
Sentiment Summary: Among 41 market news articles, 54% were neutral, 29% negative, and 17% positive, indicating predominantly neutral coverage with a negative skew over positive items.
Conclusion: Indices futures day traders are facing a news backdrop with limited positive sentiment and a larger share of negative coverage.
GLD,Gold Articles: 14
- Neutral: 35.71%
- Positive: 35.71%
- Negative: 28.57%
Sentiment Summary: GLD/Gold coverage is balanced, with 36% positive, 36% neutral, and 29% negative articles across 14 items.
Conclusion: Gold-related news sentiment is mixed, with positive and neutral coverage equal and negative coverage slightly lower.
USO,Oil Articles: 9
- Positive: 44.44%
- Negative: 33.33%
- Neutral: 22.22%
Sentiment Summary: Oil-related coverage was mixed, with 44% positive, 33% negative, and 22% neutral articles across 9 reports.
Conclusion: The oil news tone was modestly positive overall, while negative coverage remained significant for indices futures day traders.
Market Data Snapshot
ETF Snapshot of major stock market ETFs, Mag7, and others as of: July 16, 2026 07:16
Top Movers & Losers
- AAPL 327.50 Bullish 4.01% ▲
- GOOG 370.21 Bullish 3.60% ▲
- META 681.31 Bullish 3.07% ▲
- GLD 372.35 Bullish 0.05% ▲
- QQQ 717.74 Bearish -0.27% ▼
- TSLA 394.46 Bearish -0.43% ▼
Major Index ETFs: SPY, QQQ, DIA, IWM, IJH
- IWM 295.77 Bullish 0.43% ▲
- SPY 754.81 Bullish 0.40% ▲
- DIA 525.95 Bullish 0.24% ▲
- IJH 75.63 Bullish 0.08% ▲
- QQQ 717.74 Bearish -0.27% ▼
Mixed index ETF conditions: IWM is the most bullish mover at +0.43%, followed by SPY at +0.40% and DIA at +0.24%. IJH is marginally Bullish at +0.08%. QQQ is the most bearish mover at -0.27%, creating a mixed large-cap growth versus broader index backdrop.
Mag 7 Stocks: AAPL, MSFT, GOOG, AMZN, META, NVDA, TSLA
- AAPL 327.50 Bullish 4.01% ▲
- GOOG 370.21 Bullish 3.60% ▲
- META 681.31 Bullish 3.07% ▲
- AMZN 254.96 Bullish 3.02% ▲
- MSFT 395.63 Bullish 2.78% ▲
- NVDA 212.50 Bullish 0.33% ▲
- TSLA 394.46 Bearish -0.43% ▼
Mixed: AAPL is the most bullish mover at +4.01%, followed by GOOG at +3.60%, META at +3.07%, AMZN at +3.02%, and MSFT at +2.78%. NVDA is modestly Bullish at +0.33%. TSLA is the most bearish mover at -0.43%.
Cross-Market ETFs: TLT, GLD, USO, IBIT
- USO 121.38 Bullish 1.01% ▲
- IBIT 36.81 Bullish 0.63% ▲
- TLT 84.24 Bullish 0.19% ▲
- GLD 372.35 Bullish 0.05% ▲
Other ETFs are Bullish across the group: USO is the most bullish mover at +1.01%, followed by IBIT at +0.63%. TLT is modestly Bullish at +0.19%, while GLD is the least positive mover and near-flat at +0.05%.
ETF, Mag7, and Cross-Market ETF Insights
Overall Tone
Mixed: broad equity ETFs were narrowly Bullish while Mag7 leadership was strong but selective, with QQQ and TSLA Bearish.
Equity ETFs and Mag7:
Major Index ETFs were Mixed, with IWM +0.43%, SPY +0.40%, DIA +0.24%, and IJH +0.08% Bullish, while QQQ was Bearish at -0.27%. Mag7 action was selectively Bullish, led by AAPL, the most bullish mover, at +4.01%, followed by GOOG +3.60%, META +3.07%, AMZN +3.02%, MSFT +2.78%, and NVDA +0.33%. TSLA was the most bearish mover at -0.43%, creating divergence versus the broader Mag7 strength.
Cross-Market ETFs:
Cross-Market ETFs were Bullish, led by USO, the most bullish mover, at +1.01%, with IBIT also Bullish at +0.63%. TLT at +0.19% and GLD at +0.05% were marginally Bullish, with GLD the least positive mover. Commodity and digital-asset strength contrasted with near-flat hedging ETF moves.
Futures Indices – Higher Time Frame Analysis
Summary of the current state of US Indices Futures based on higher time-frame (HTF) technical analysis as of: 2026-07-16: 07:16 CT.
US Indices Futures
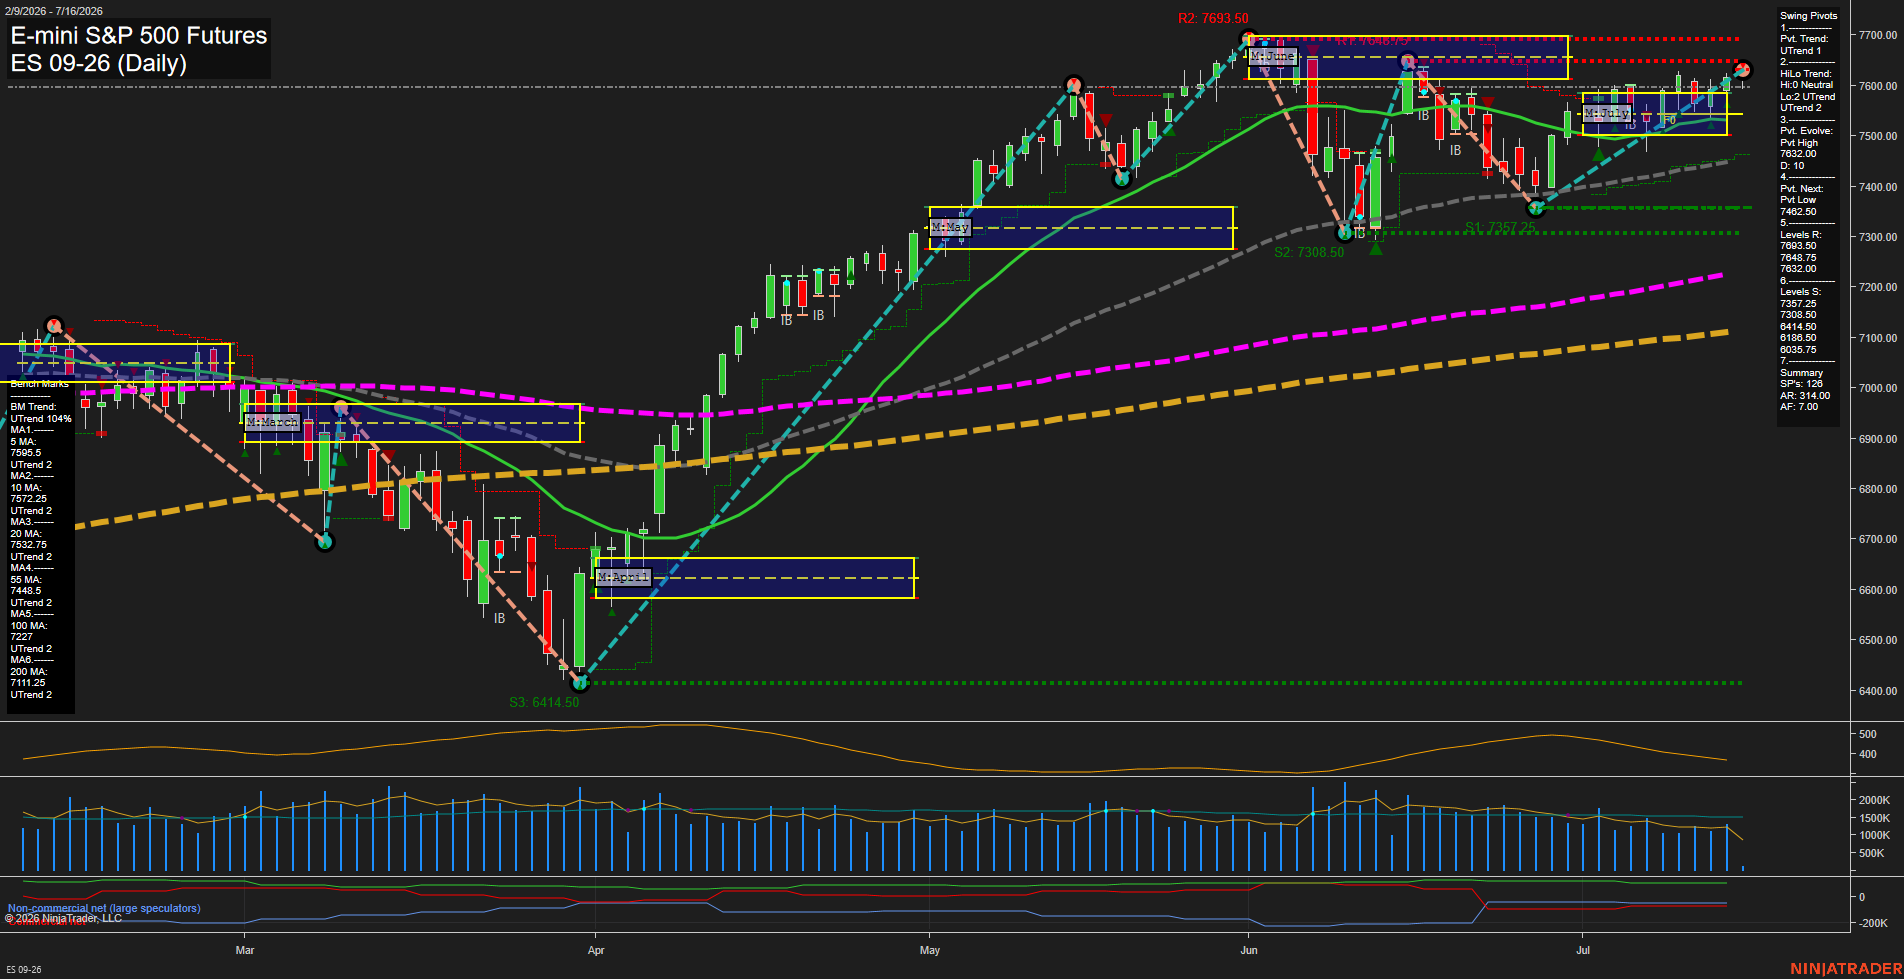
- ES Bullish YSFG/MSFG, WSFG down; above rising benchmarks; UTrend pivots; resistance 7632-7693.50, support 7357.25/7308.50, reversal pivot 7230.00.
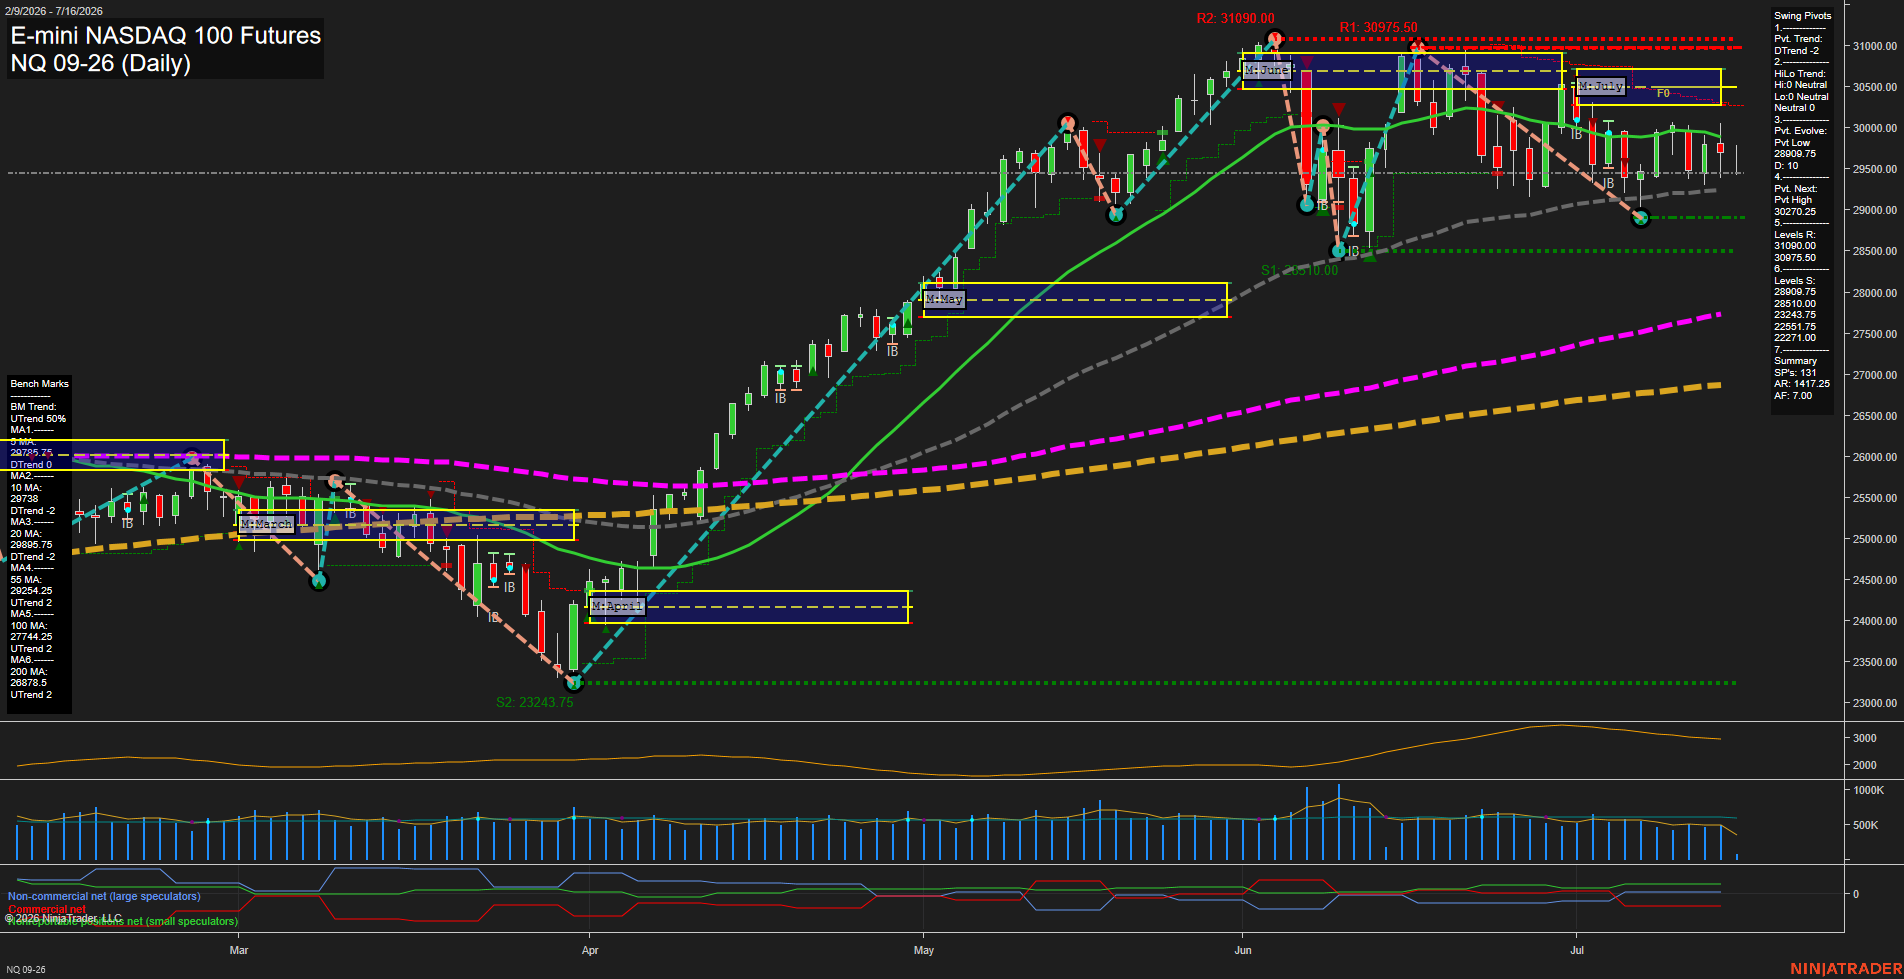
- NQ Bullish YSFG, MSFG/WSFG below F0%; below 5/10-day benchmarks; DTrend; resistance 31000, support 28909.75, reversal pivot 28495.50.
- YM YSFG/MSFG/WSFG above F0%; above rising benchmarks; higher-high/higher-low structure; resistance 53401-53658, support 52255, reversal pivot 51006.
- EMD Bullish YSFG/WSFG, MSFG below F0%; mixed daily benchmarks; short-term DTrend; resistance 3840.8/3892.4, support 3721.7-3692.9, reversal pivot 3643.8.
- RTY Bullish YSFG, MSFG negative and WSFG below F0%; declining 10/20-day averages; pullback from 3068.4; support 2943.4/2939.8, reversal pivot 2827.8.
- FDAX YSFG, MSFG and WSFG below F0%; daily DTrend below 5/10/20-day benchmarks; resistance 26064, support 24830/24130/23827, reversal pivot 24224.
Overall State
- Short-Term: Neutral
- Intermediate-Term: Neutral
- Long-Term: Bullish
Conclusion
Long-term alignment remains bullish across all contracts, with prices generally above rising 55-, 100-, and 200-period benchmarks and YSFG support. Short-term conditions are mixed: ES and YM consolidate near highs, while NQ, RTY, and FDAX retain bearish WSFG/MSFG or daily pivot readings. EMD remains range-bound after rejection from 3892.4. NQ, RTY, and FDAX are the weaker directional correlations; ES and YM retain higher-time-frame pivot strength.
Note: Intra-day counter-trend pullbacks or retracements may occur, HTF is context for informational usage and market structure. Glossary: Session Fib Grids periods of YSFG:’Yearly’, MSFG:’Monthly’, WSFG:’Weekly’
For full details visit: AlphaWebTrader Technicals
ES Daily View
Overall Rating
- Short-Term: Neutral
- Intermediate-Term: Bullish
- Long-Term: Bullish.
Key Insights Summary
Price remains in a broad bullish daily structure, holding above every benchmark moving average while the intermediate and long-term Fib Grid trends remain upward. The short-term picture is mixed: the weekly Fib Grid is negative and price is consolidating beneath clustered 7632.00 to 7693.50 resistance, while the active pivot structure remains an UTrend. The recent range reflects a pullback-and-rebound sequence with higher support at 7357.25 and 7308.50, but momentum has moderated as price trades near the upper portion of the range. This is a constructive but choppy consolidation beneath the prior pivot high at 7678.50.
View charts on: AlphaWebTrader HTF Charts
NQ Daily View
Overall Rating
- Short-Term: Bearish
- Intermediate-Term: Neutral
- Long-Term: Bullish.
Key Insights Summary
Price is consolidating below the July monthly and weekly F0% areas after rejection from the 30975.50-31090.00 resistance zone. Short-term structure remains bearish, with lower highs, price below the declining 5- and 10-day benchmarks, a DTrend pivot state, and aligned short signals. Intermediate structure is mixed: the July MSFG is down while the rising 20- and 55-day averages and support at 28909.75 preserve the broader recovery structure. Long-term conditions remain bullish above rising 100- and 200-day averages and the yearly F0% level, although current momentum is slow and reflects a volatile pullback/consolidation phase.
View charts on: AlphaWebTrader HTF Charts
CL Daily View
Overall Rating
- Short-Term: Bullish
- Intermediate-Term: Bullish
- Long-Term: Bullish.
Key Insights Summary
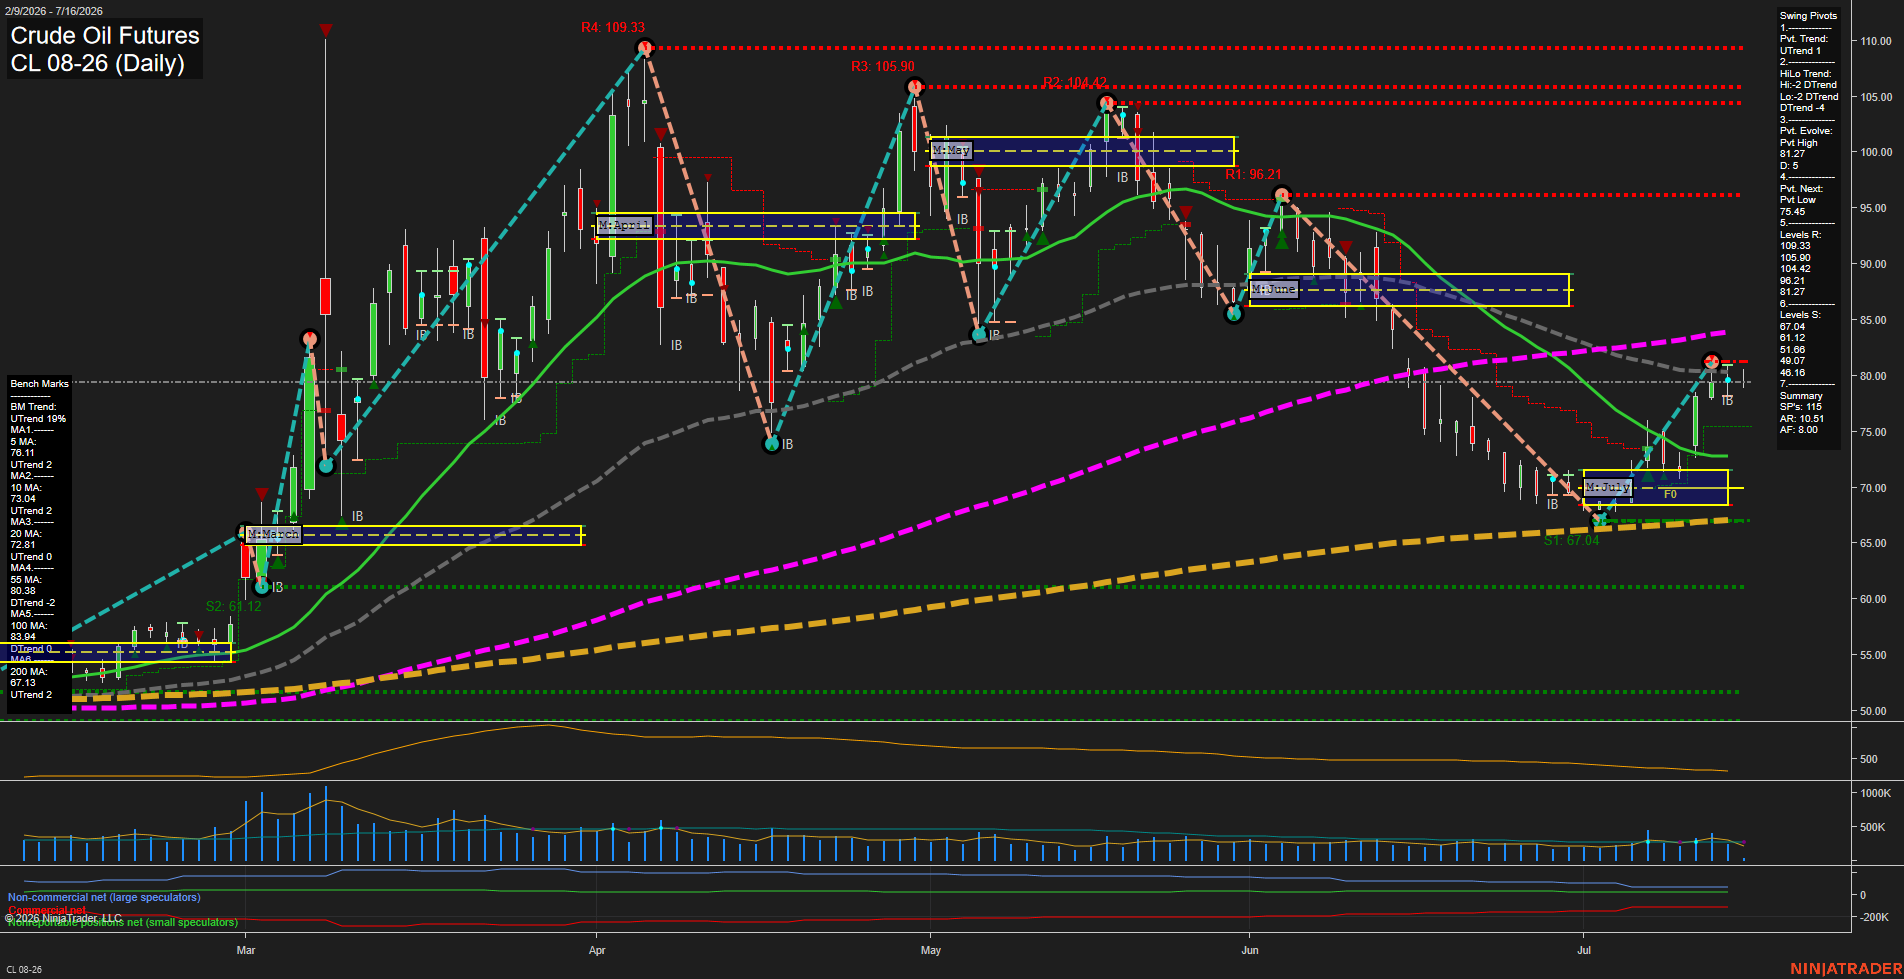
Price has produced a sharp V-shaped recovery from the 67.04 pivot low and is holding above the rising 5, 10, and 20-day benchmarks, maintaining a constructive short-term structure. The advance has reached the 81.27 pivot-high resistance area while remaining below declining 55-day and 100-day benchmarks, leaving the intermediate swing structure in a recovery phase rather than a fully confirmed higher-high trend. Monthly, weekly, and yearly fib-grid positioning remains above their F0% references, while moderate momentum and contained volume indicate consolidation following the fast rebound.
View charts on: AlphaWebTrader HTF Charts
GC Daily View
Overall Rating
- Short-Term: Bearish
- Intermediate-Term: Bearish
- Long-Term: Bearish.
Key Insights Summary
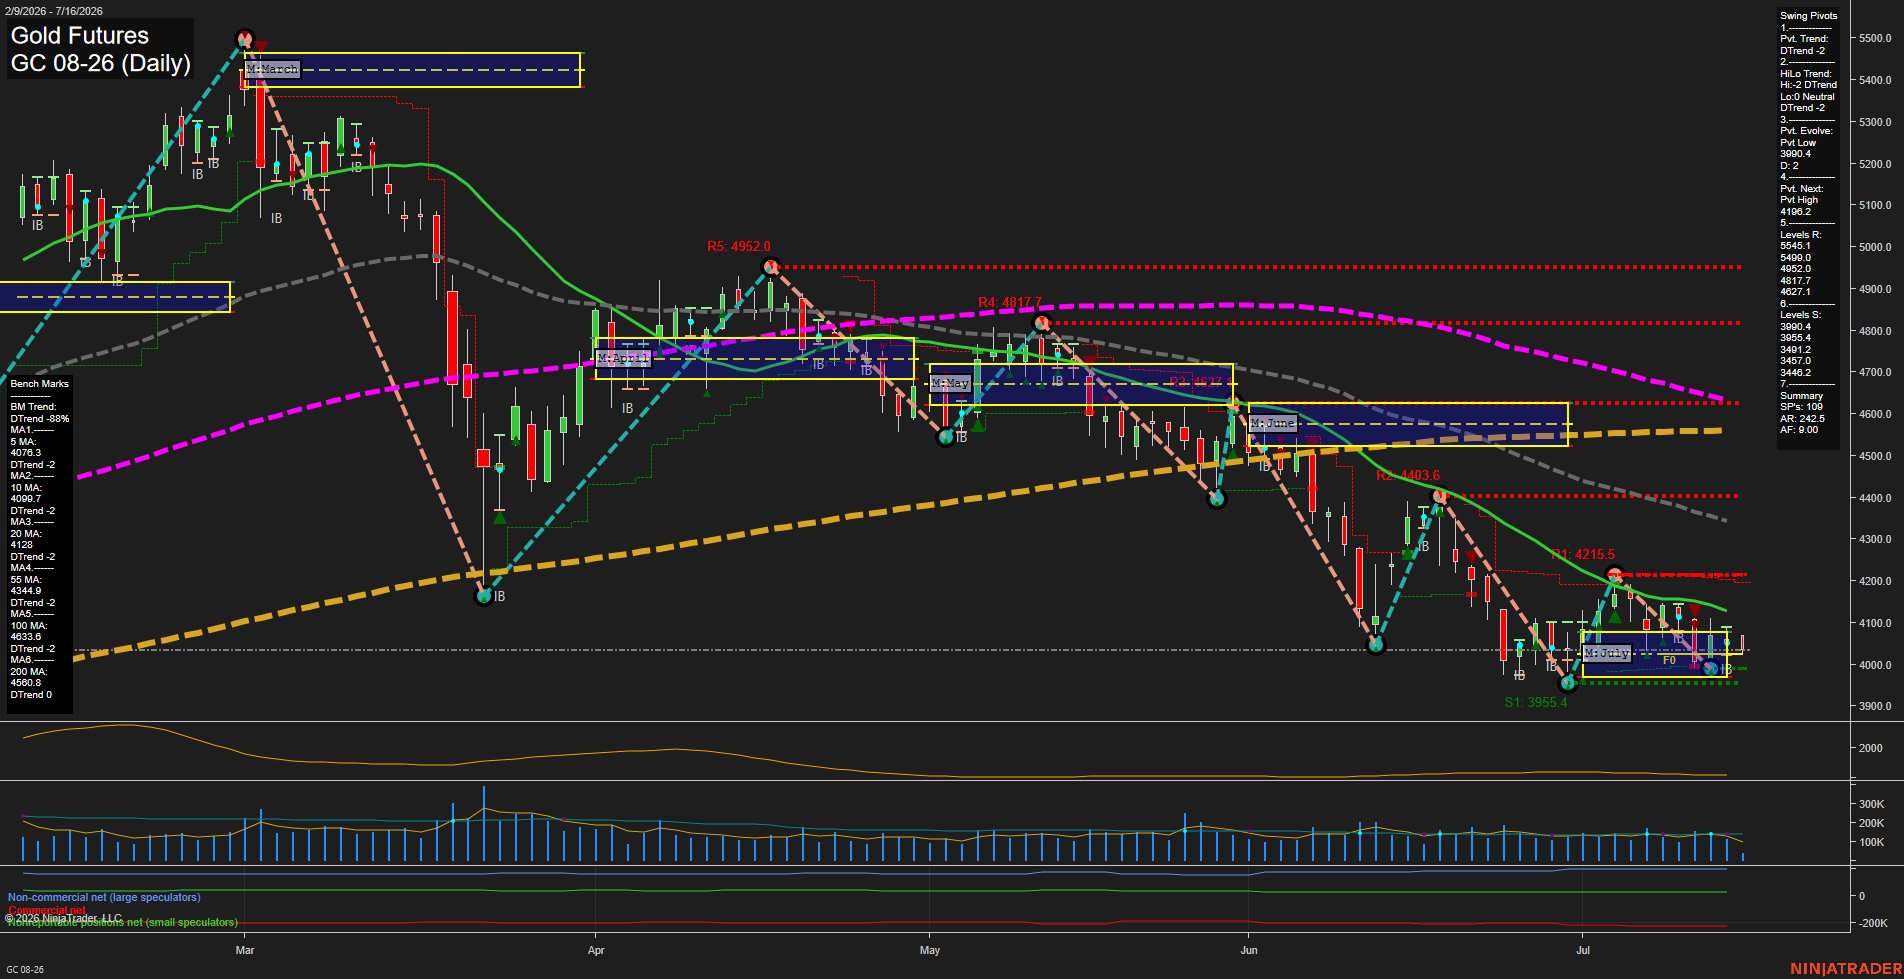
Gold remains in a broad daily-chart decline, with price near 4029.5 below every benchmark moving average and both pivot trend measures in DTrend. The July monthly grid is marginally above its F0% level, reflecting a localized counter-trend stabilization, while the weekly and yearly grids remain below F0% and retain downward structure. Small recent candles and subdued momentum show consolidation around the 3990.4 and 3955.4 support zone following the June-July selloff; 4196.2 is the next pivot reversal threshold, with the declining 5-, 10-, and 20-day averages clustered above price.
View charts on: AlphaWebTrader HTF Charts