
NYSE close roundup examines chip-led Nasdaq weakness, higher-rate concerns, diesel inflation and mixed oil signals shaping equity market conditions.
Fundamentals: U.S. equities faced a cautious backdrop as semiconductor weakness and scrutiny of AI spending weighed on the Nasdaq, while the S&P 500 remained near record levels. Fed calls for modestly higher rates pressured rate-sensitive assets, while diesel supply tightness, rising mortgage rates and mixed oil signals added inflation and housing concerns.
Technicals: Stocks closed with mixed leadership as gains in Apple and Microsoft contrasted with declines in Nvidia, Meta and Alphabet. S&P 500 and Dow futures retained broadly bullish intermediate and long-term structures, while Nasdaq and Russell 2000 futures showed short-term weakness beneath recent resistance. European and mid-cap contracts also remained in consolidation or corrective phases.
After Market Close daily snapshot: market news summary and sentiment, major ETFs, Magnificent 7 analysis, Indices Futures Higher Time Frame Analysis, and E-mini S&P500, Nasdaq 100, NYMEX Crude, Gold Futures Daily Chart analysis.
As of: July 16, 2026 05:00 CT
Market News Summary:
Equity futures context is defined by a technology-led pullback, elevated rate concerns, and mixed inflation signals.
Primary Drivers & Risks:
- Primary Driver: Chip and AI spending reassessment
- Primary Risk: Higher rates and fuel inflation
Tone:
Cautious, with tech weakness offset by selective defensive strength.
Stock Market / ETFs / Indices:
The Nasdaq fell about 1% intraday as semiconductor shares declined on profitability concerns and investors reassessed the AI trade ahead of hyperscaler earnings. The S&P 500 remained near record levels, but concentration in technology and top holdings, elevated valuation debate, and late-cycle IPO and capital-raising concerns remain key cross-currents. Healthcare and pharmaceutical shares have outperformed the S&P 500 over the past month, while transports have risen as chips weakened.
Geopolitical:
U.S.-Iran fighting remained an energy-market focus, while trader attention shifted toward the prospect of negotiations. A congressional report alleging South Korean targeting of a U.S. e-commerce company added a separate business-policy concern.
Oil / Energy:
Crude prices showed mixed signals: oil retreated as negotiations entered market focus, while WTI tested technical resistance following a recovery. A sharp decline in diesel supplies is raising costs for truckers and farmers and reviving inflation concerns.
Gold / Metals:
Gold fell more than 1% as rate-hike expectations strengthened, with technical commentary focused on key support and the potential for a deeper correction. Longer-term gold commentary remained constructive, and China’s AI and clean-energy investment was cited as a prospective source of strategic platinum demand.
Fed / Financials:
Dallas Fed President Lorie Logan called for modestly higher interest rates, stating recent consumer and wholesale inflation data did not establish sufficient progress toward the 2% target. Higher-rate expectations pressured precious metals and added to broader risk-asset sensitivity.
Macro / Other:
The average 30-year fixed mortgage rate rose to 6.55%, the highest level in almost a year, adding pressure to housing. Jobless claims improved, while pending home sales declined; slowing inflation was also cited as a supportive macro offset for technology.
Conclusion:
Chip-sector weakness and scrutiny of AI capital spending are the main equity-index drivers. Fed messaging favoring higher rates reinforces pressure on rate-sensitive sectors.
Diesel supply tightness and higher mortgage rates add inflation and housing risks. Oil negotiations, defensive healthcare leadership, and still-near-record broad indexes create offsetting market signals.
Market News Sentiment
Market News Articles: 41
- Neutral: 58.54%
- Negative: 34.15%
- Positive: 7.32%
Sentiment Summary: News coverage is predominantly neutral (59%), with negative articles (34%) outweighing positive articles (7%) across 41 items.
Conclusion: The overall news tone is neutral with a notable negative skew and limited positive coverage.
GLD,Gold Articles: 12
- Negative: 41.67%
- Positive: 33.33%
- Neutral: 25.00%
Sentiment Summary: GLD and gold coverage is mildly negative, with 42% negative, 33% positive, and 25% neutral articles.
Conclusion: For indices futures day traders, gold-related news tone is mixed with a negative tilt rather than a clear directional signal.
USO,Oil Articles: 8
- Positive: 62.50%
- Negative: 25.00%
- Neutral: 12.50%
Sentiment Summary: USO/Oil coverage is predominantly positive (63%), with 25% negative and 13% neutral articles.
Conclusion: Oil-related news tone is net positive, with a meaningful minority of negative coverage relevant to index futures sentiment.
Market Data Snapshot
ETF Snapshot of major stock market ETFs, Mag7, and others as of: July 16, 2026 05:00
Top Movers & Losers
- AAPL 333.26 Bullish 1.76% ▲
- MSFT 401.10 Bullish 1.38% ▲
- IJH 75.99 Bullish 0.48% ▲
- NVDA 207.40 Bearish -2.40% ▼
- META 664.54 Bearish -2.46% ▼
- GOOG 353.81 Bearish -4.43% ▼
Major Index ETFs: SPY, QQQ, DIA, IWM, IJH
- IJH 75.99 Bullish 0.48% ▲
- IWM 295.59 Bearish -0.06% ▼
- DIA 524.83 Bearish -0.21% ▼
- SPY 750.72 Bearish -0.54% ▼
- QQQ 705.94 Bearish -1.64% ▼
Mixed index ETF snapshot: IJH is the most bullish mover at +0.48%, while QQQ is the most bearish mover at -1.64%. SPY is Bearish at -0.54% and DIA is Bearish at -0.21%; IWM is marginally Bearish at -0.06%.
Mag 7 Stocks: AAPL, MSFT, GOOG, AMZN, META, NVDA, TSLA
- AAPL 333.26 Bullish 1.76% ▲
- MSFT 401.10 Bullish 1.38% ▲
- TSLA 391.06 Bearish -0.86% ▼
- AMZN 249.89 Bearish -1.99% ▼
- NVDA 207.40 Bearish -2.40% ▼
- META 664.54 Bearish -2.46% ▼
- GOOG 353.81 Bearish -4.43% ▼
Mixed Mag7 snapshot: AAPL is the most bullish mover at +1.76%, followed by MSFT at +1.38%. GOOG is the most bearish mover at -4.43%, with META -2.46%, NVDA -2.40%, AMZN -1.99%, and TSLA -0.86% also Bearish.
Cross-Market ETFs: TLT, GLD, USO, IBIT
- TLT 84.21 Bearish -0.04% ▼
- IBIT 36.39 Bearish -1.14% ▼
- USO 119.30 Bearish -1.71% ▼
- GLD 364.96 Bearish -1.98% ▼
Other ETFs were Bearish across the group. GLD was the most bearish mover at -1.98%, followed by USO at -1.71% and IBIT at -1.14%. TLT was the least negative mover, marginally lower at -0.04%.
ETF, Mag7, and Cross-Market ETF Insights
Overall Tone
Mixed, with broad equity and cross-market weakness offset by selective strength in AAPL and MSFT.
Equity ETFs and Mag7:
Major Index ETFs were Bearish overall: IJH was the only Bullish index ETF at +0.48%, while IWM was marginally Bearish at -0.06%, DIA fell -0.21%, SPY declined -0.54%, and QQQ lagged at -1.64%. Mag7 performance was selective, led by AAPL at +1.76%, the most bullish mover, and MSFT at +1.38%; GOOG was the most bearish mover at -4.43%, followed by META at -2.46%, NVDA at -2.40%, AMZN at -1.99%, and TSLA at -0.86%.
Cross-Market ETFs:
Cross-market ETFs were uniformly Bearish, with TLT near-flat and the least negative mover at -0.04%. IBIT declined -1.14%, USO fell -1.71%, and GLD was the most bearish mover at -1.98%, aligning cross-market pressure with the broader equity weakness.
Futures Indices – Higher Time Frame Analysis
Summary of the current state of US Indices Futures based on higher time-frame (HTF) technical analysis as of: 2026-07-16: 17:00 CT.
US Indices Futures
- ES: YSFG/MSFG up, WSFG down; above rising benchmarks; UTrend pivots; resistance 7632.00-7693.50, support 7357.25/7308.50, reversal 7230.00.
- NQ: YSFG up, MSFG/WSFG below F0%; below 5/10-day benchmarks, DTrend; resistance 31000.00, support 28909.75, reversal 28495.50.
- YM: YSFG/MSFG/WSFG above F0%; above rising benchmarks; higher-high/higher-low pivots; resistance 53401/53658, support 52255, reversal 51006.
- EMD: YSFG/WSFG up, MSFG below F0%; mixed daily benchmarks and down pivot; resistance 3840.8/3892.4, support 3721.7-3692.9, reversal 3643.8.
- RTY: YSFG up, MSFG down, WSFG below F0%; declining short benchmarks; pullback from 3068.4, support 2943.4/2939.8, reversal 2827.8.
- FDAX: YSFG/MSFG/WSFG below F0%; daily DTrend below 5/10/20-day benchmarks; resistance 26064, support 24830/24130/23827, reversal 24224.
Overall State
- Short-Term: Bearish
- Intermediate-Term: Neutral
- Long-Term: Bullish
Conclusion
Long-term benchmark alignment remains upward across all contracts. ES and YM retain the strongest intermediate structure, while NQ, RTY, and FDAX hold short-term bearish grid and pivot conditions. EMD is consolidating between 3692.9 support and 3892.4 resistance. Index futures are broadly correlated through retracement or consolidation phases beneath recent pivot highs.
Note: Intra-day counter-trend pullbacks or retracements may occur, HTF is context for informational usage and market structure. Glossary: Session Fib Grids periods of YSFG:’Yearly’, MSFG:’Monthly’, WSFG:’Weekly’
For full details visit: AlphaWebTrader Technicals
ES Daily View
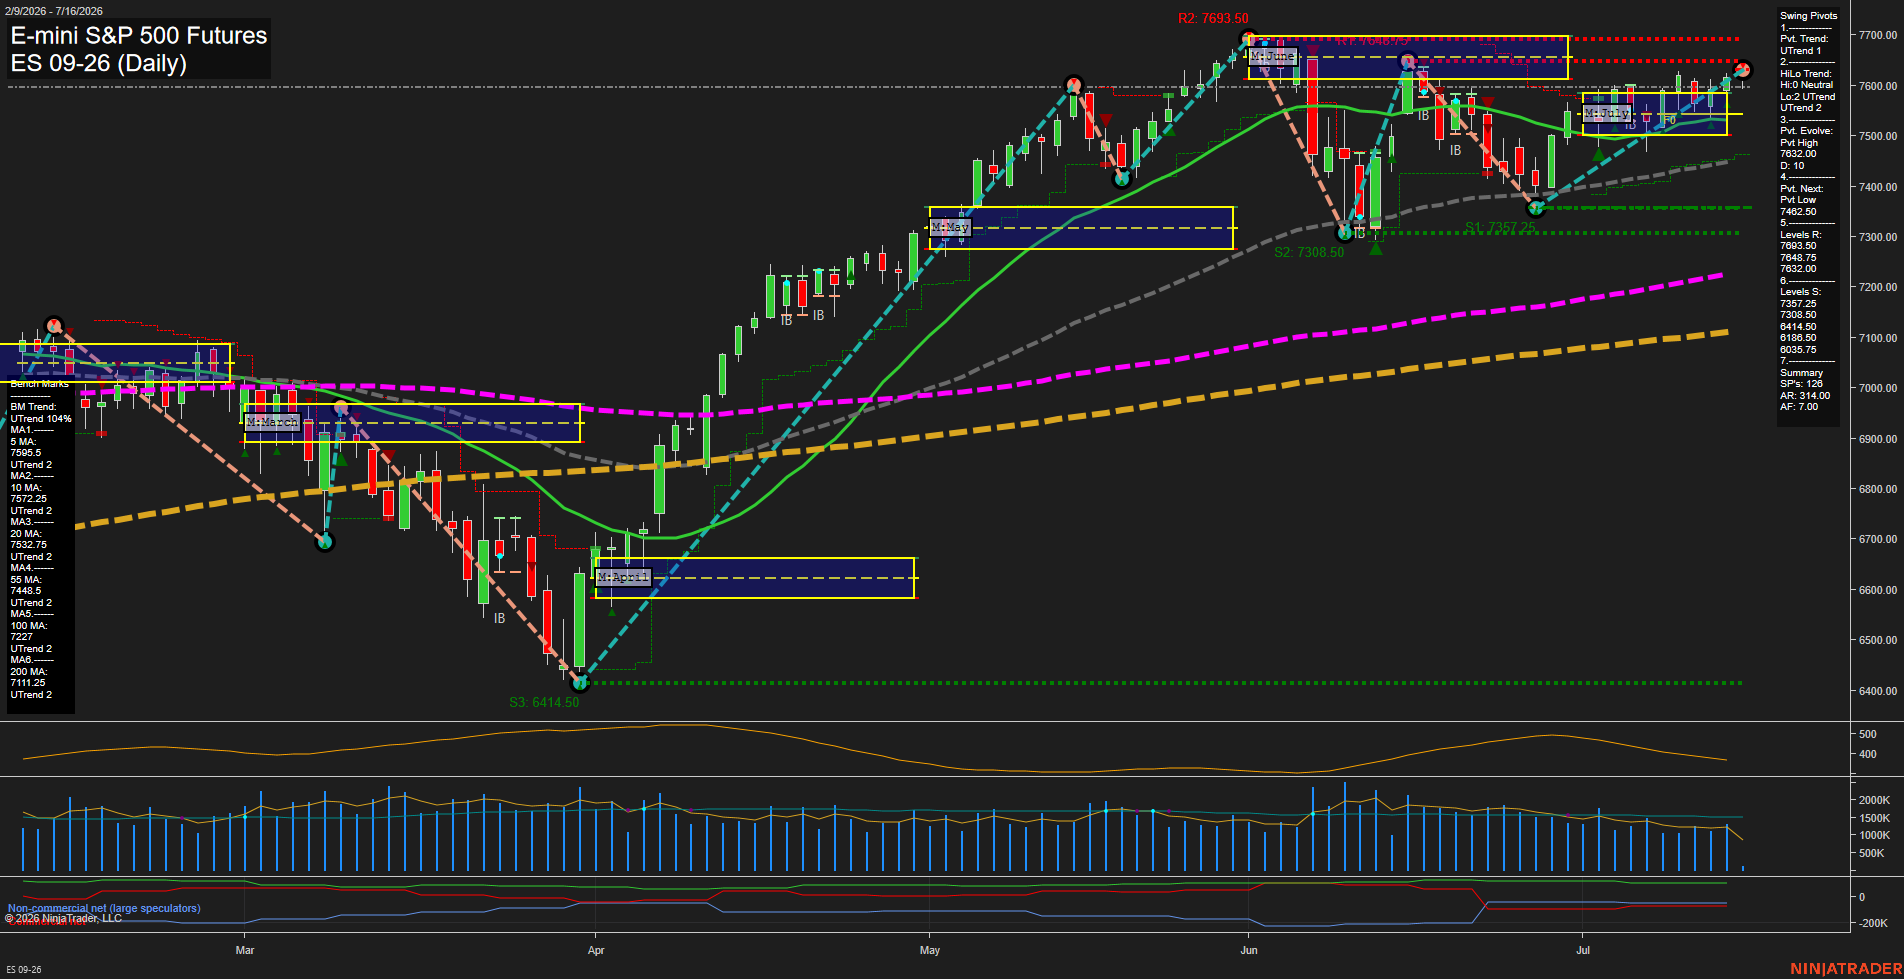
Overall Rating
- Short-Term: Neutral
- Intermediate-Term: Bullish
- Long-Term: Bullish.
Key Insights Summary
Price remains in a broad bullish daily structure, holding above every benchmark moving average while the intermediate and long-term Fib Grid trends remain upward. The short-term picture is mixed: the weekly Fib Grid is negative and price is consolidating beneath clustered 7632.00 to 7693.50 resistance, while the active pivot structure remains an UTrend. The recent range reflects a pullback-and-rebound sequence with higher support at 7357.25 and 7308.50, but momentum has moderated as price trades near the upper portion of the range. This is a constructive but choppy consolidation beneath the prior pivot high at 7678.50.
View charts on: AlphaWebTrader HTF Charts
NQ Daily View
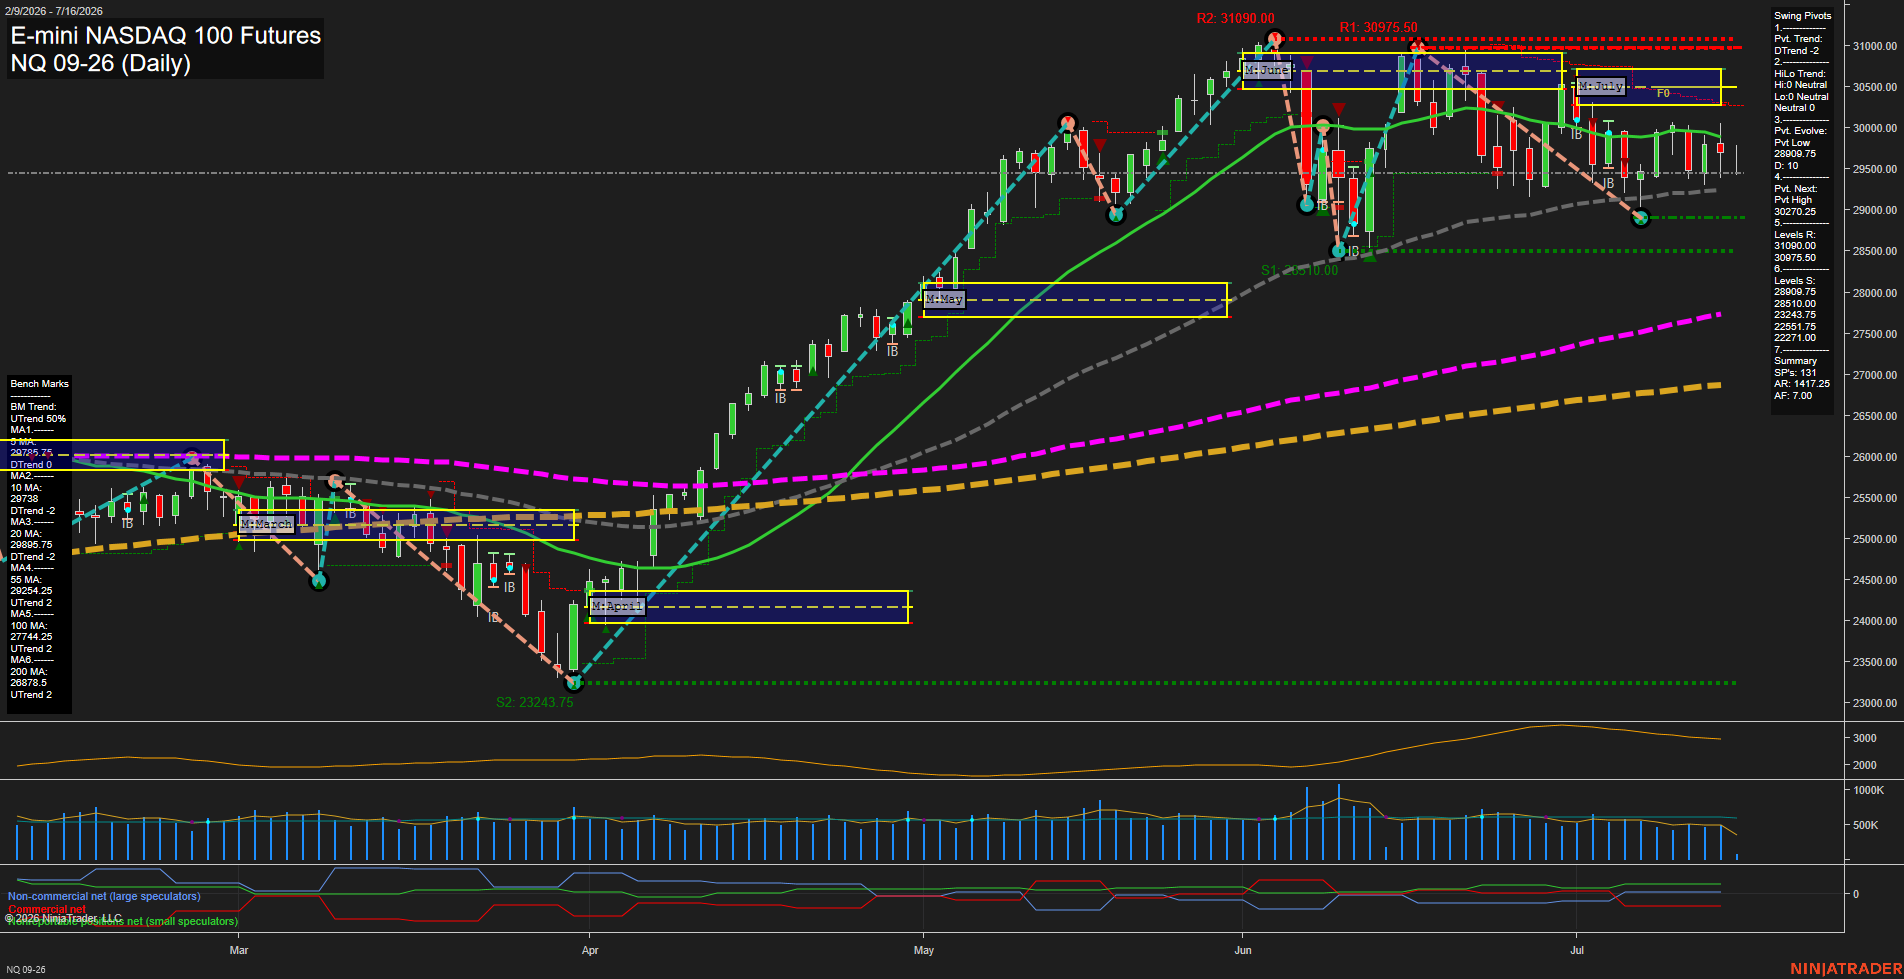
Overall Rating
- Short-Term: Bearish
- Intermediate-Term: Neutral
- Long-Term: Bullish.
Key Insights Summary
Price is consolidating below the July monthly and weekly F0% areas after rejection from the 30975.50-31090.00 resistance zone. Short-term structure remains bearish, with lower highs, price below the declining 5- and 10-day benchmarks, a DTrend pivot state, and aligned short signals. Intermediate structure is mixed: the July MSFG is down while the rising 20- and 55-day averages and support at 28909.75 preserve the broader recovery structure. Long-term conditions remain bullish above rising 100- and 200-day averages and the yearly F0% level, although current momentum is slow and reflects a volatile pullback/consolidation phase.
View charts on: AlphaWebTrader HTF Charts
CL Daily View
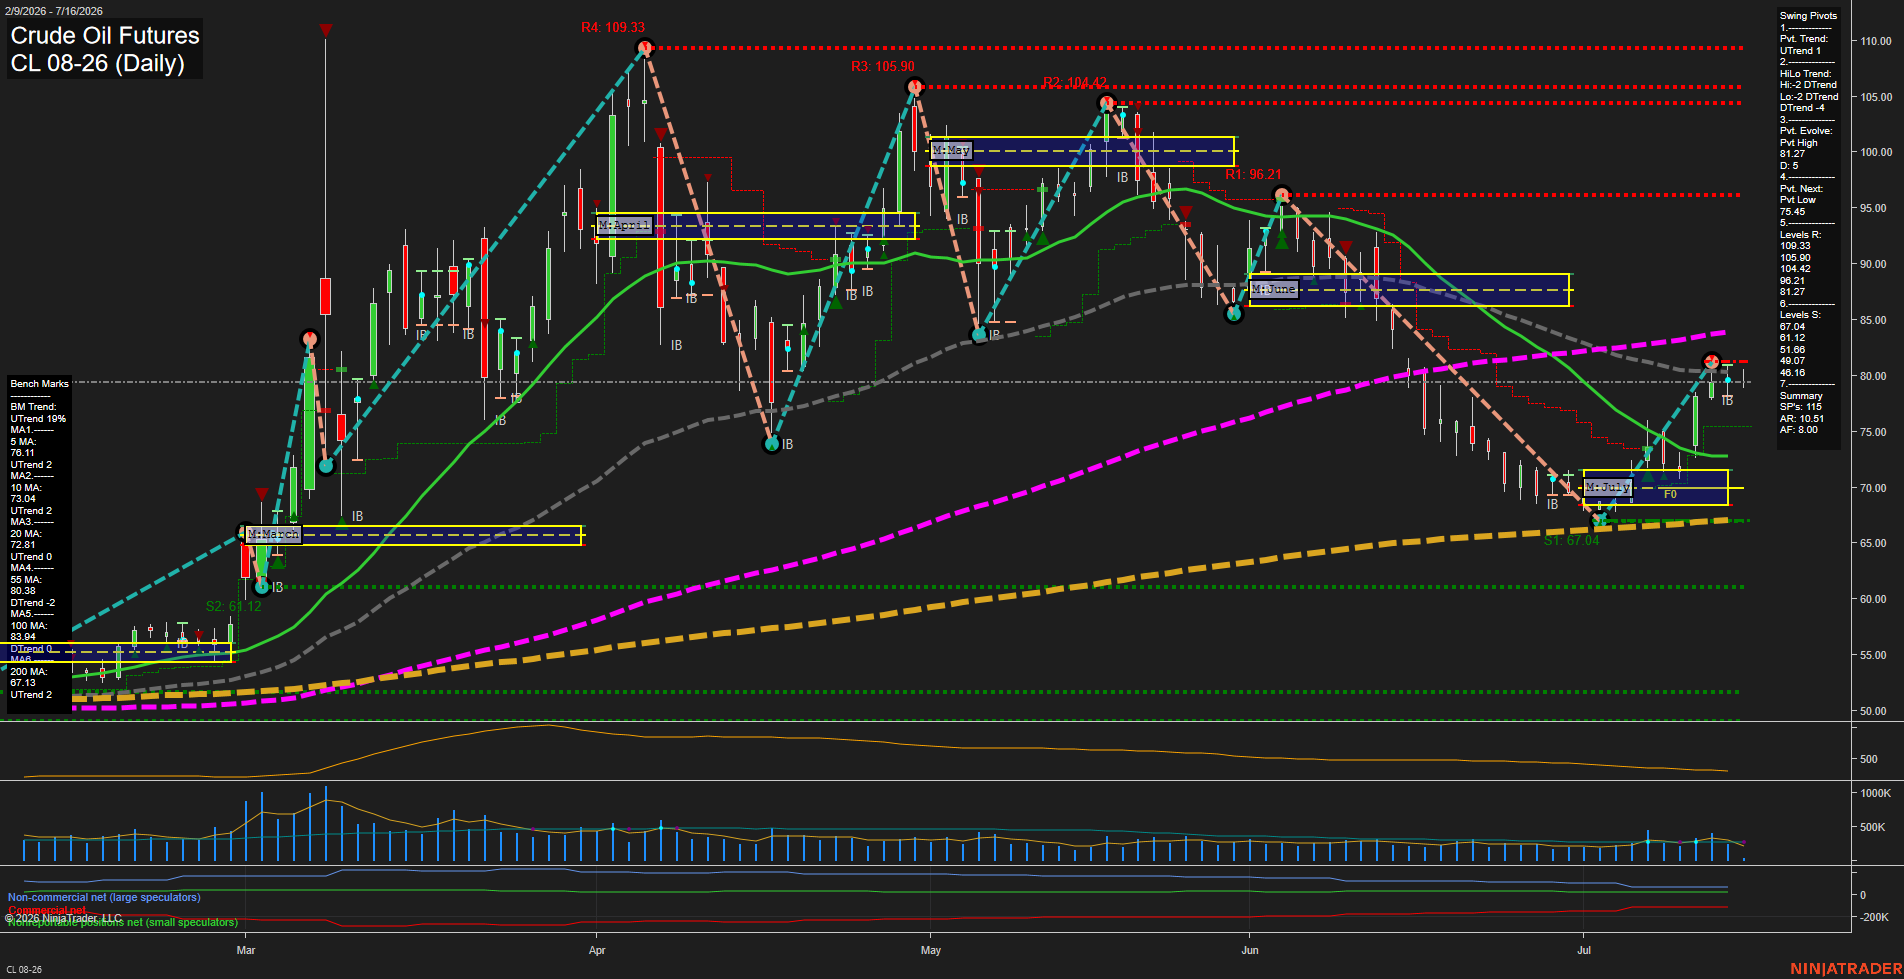
Overall Rating
- Short-Term: Bullish
- Intermediate-Term: Bullish
- Long-Term: Bullish.
Key Insights Summary
Price has produced a sharp V-shaped recovery from the 67.04 pivot low and is holding above the rising 5, 10, and 20-day benchmarks, maintaining a constructive short-term structure. The advance has reached the 81.27 pivot-high resistance area while remaining below declining 55-day and 100-day benchmarks, leaving the intermediate swing structure in a recovery phase rather than a fully confirmed higher-high trend. Monthly, weekly, and yearly fib-grid positioning remains above their F0% references, while moderate momentum and contained volume indicate consolidation following the fast rebound.
View charts on: AlphaWebTrader HTF Charts
GC Daily View
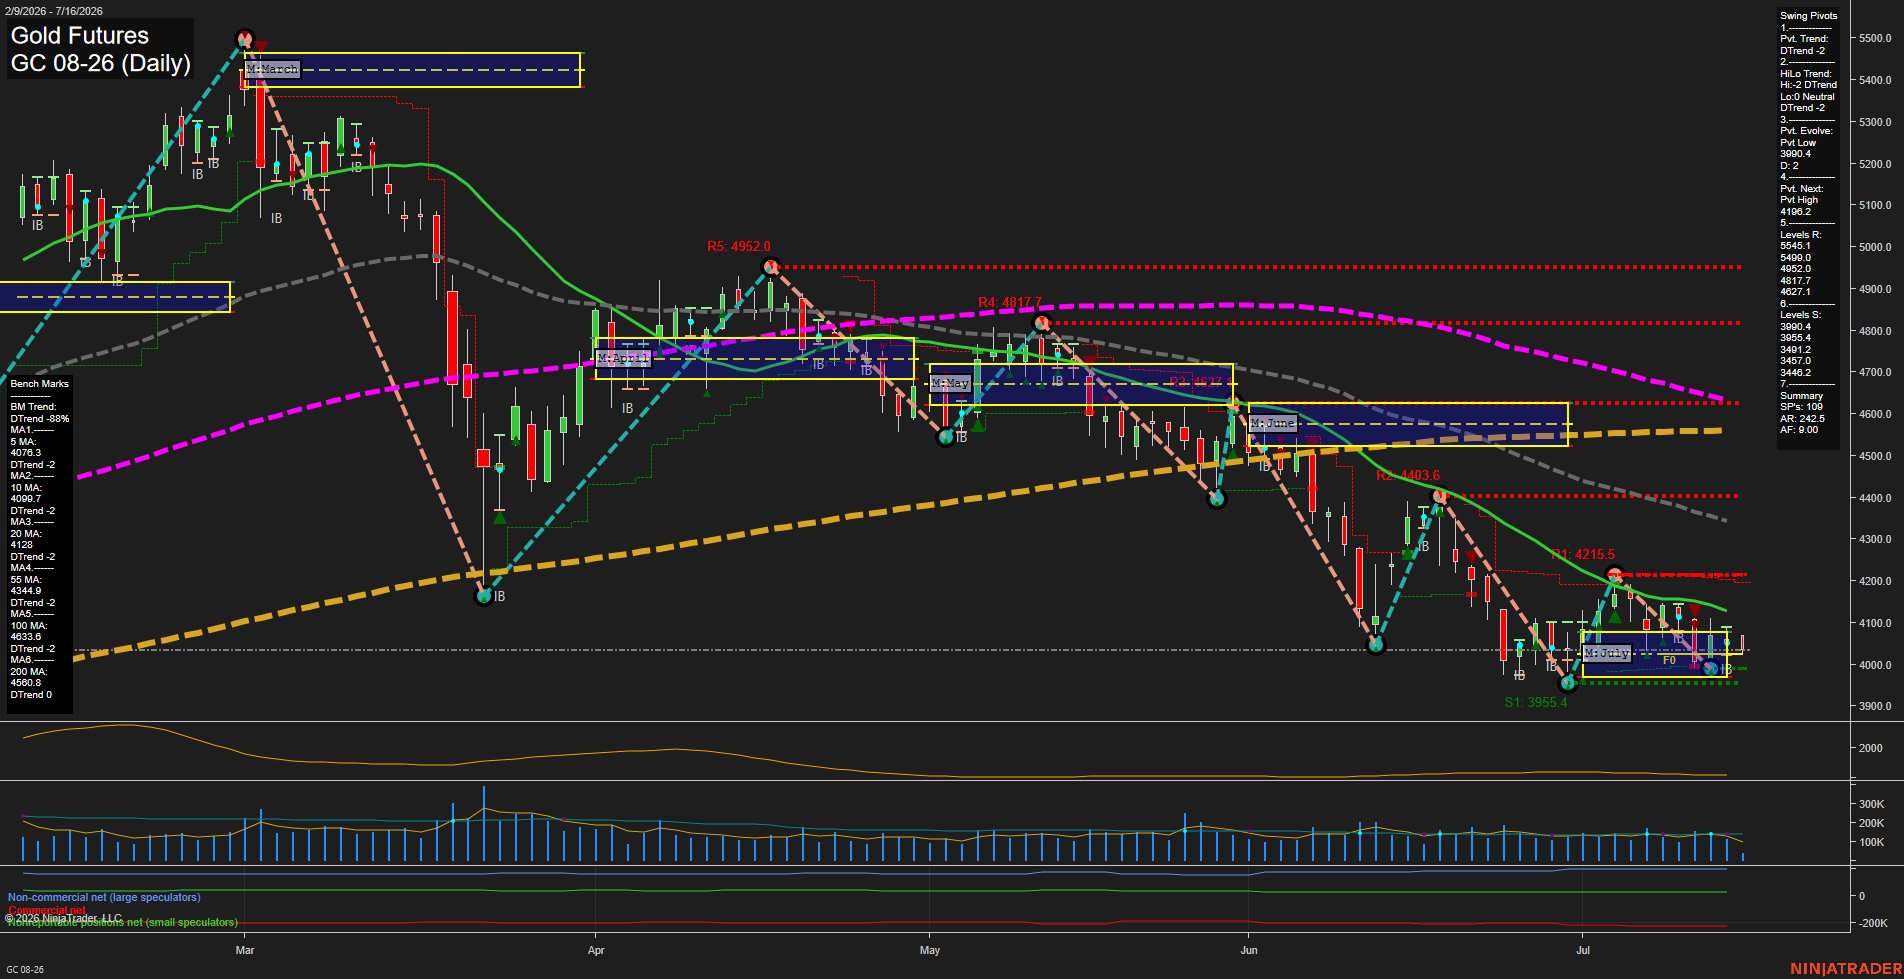
Overall Rating
- Short-Term: Bearish
- Intermediate-Term: Bearish
- Long-Term: Bearish.
Key Insights Summary
Gold remains in a broad daily-chart decline, with price near 4029.5 below every benchmark moving average and both pivot trend measures in DTrend. The July monthly grid is marginally above its F0% level, reflecting a localized counter-trend stabilization, while the weekly and yearly grids remain below F0% and retain downward structure. Small recent candles and subdued momentum show consolidation around the 3990.4 and 3955.4 support zone following the June-July selloff; 4196.2 is the next pivot reversal threshold, with the declining 5-, 10-, and 20-day averages clustered above price.
View charts on: AlphaWebTrader HTF Charts