NYSE pre-market radar tracks tech and chip weakness, index futures, AI valuation concerns and rising oil risks ahead of UoM sentiment data release.
Fundamentals: U.S. index futures enter the pre-market session with technology and semiconductor shares under pressure as investors reassess AI spending, financing needs, and valuations. Resilient consumer data and softer June inflation offer a mixed macro backdrop, while Middle East tensions and risks to Hormuz and Red Sea shipping routes support oil and add cross-asset volatility.
Technicals: Pre-market analysis shows AAPL and MSFT gaining in the prior session while NVDA, META and GOOG declined. ES futures are consolidating beneath resistance with a neutral near-term view, while NQ remains in a sharp bearish swing. YM, RTY and FDAX reflect corrective pressure, although longer-term trend structures across major index futures remain broadly constructive.
Pre-Market Trading 360° view Market Radar of: holidays, earnings, eco-news, market-news summary, news sentiment, prior session major ETFs, MAG7, Higher Time Frame Analysis Indices Futures Summary, and E-mini S&P500, Nasdaq 100, NYMEX Crude, Gold Futures Daily Chart analysis.
As of: July 17, 2026 07:16 CT
Earnings Radar
Monitoring for earnings releases by the Magnificent 7, AI-tech-related firms, and major financial institutions.
- INTC Release: 2026-07-23 T:AMC
- GOOGL Release: 2026-07-22 T:AMC
- TSLA Release: 2026-07-22 T:AMC
Conclusion: Index futures face concentrated post-close earnings catalysts on July 22 from GOOGL and TSLA, followed by INTC on July 23. These releases place major tech, AI-related sentiment, semiconductors, and broader index positioning in focus; market momentum and volume can slow ahead of these major earnings releases.
For full details visit: Yahoo Earnings Calendar
EcoNews Radar U.S. Events
| Day | Time | Impact | Event |
|---|---|---|---|
| Fri | 10:00 | Medium | Prelim UoM Consumer Sentiment |
| Fri | 10:00 | Medium | Prelim UoM Inflation Expectations |
EcoNews Summary
No qualifying high-impact EcoNews events are listed. The listed Friday U.S. consumer sentiment and inflation-expectations releases are medium-impact events and are excluded because they do not relate directly to oil, crude inventories, energy prices, or petroleum supply.
Event Notes:
- No qualifying events listed.
Conclusion:
No single qualifying high-impact event is listed for the week. Friday is the only scheduled data day provided, with medium-impact U.S. sentiment and inflation-expectations releases excluded under the energy-only medium-impact criterion.
For full details visit: Forex Factory EcoNews
Market News Summary:
Index futures context centers on a broad technology retreat, resilient U.S. activity data, and rising Middle East energy-disruption concerns.
Primary Drivers & Risks:
- Primary Driver: AI technology valuation repricing
- Primary Risk: Hormuz and Red Sea disruption
Tone:
Risk-off in technology, with inflation and energy cross-currents.
Stock Market / ETFs / Indices:
Chipmakers and broader technology shares faced a steep selloff as investors reassessed AI valuations, hyperscaler financing needs, and the durability of spending growth. Transports rose while major indexes remained near records, but S&P 500 valuation commentary highlighted elevated CAPE readings. IPO issuance remained exceptionally strong, with $140 billion raised through July 10.
Geopolitical:
U.S.-Iran hostilities intensified, with threats to Gulf infrastructure and discussion of a potential Red Sea export-route closure. The IEA warned that prolonged restrictions on flows through the Strait of Hormuz pose global energy-security risks.
Oil / Energy:
Oil moved higher on disrupted Hormuz flows, escalating Gulf conflict, Red Sea closure threats, and a reported inventory draw. Energy supply concerns remained the principal geopolitical market transmission channel.
Gold / Metals:
Gold traded around the $4,000 level but closed Thursday at $3,976 after pressure from firmer Treasury yields and a stronger dollar. GLD recorded more than $14 billion of outflows since March amid gold’s year-to-date decline, while central-bank buying remained a structural demand theme.
Fed / Financials:
June CPI and PPI data showed monthly price declines, while retail-sales data pointed to resilient consumer spending. Treasury yields initially firmed alongside the stronger data and dollar, then their decline accelerated as oil stabilized. AI capital spending also increased debt-financing demands among large hyperscalers.
Macro / Other:
China’s Moonshot AI introduced a model positioned against leading U.S. systems, underscoring intensifying technology competition. Defense demand featured prominently as security risks shifted attention toward weapons production.
Conclusion:
The main equity driver is the technology and semiconductor selloff tied to AI spending, financing, and valuation concerns. Resilient consumer data and softer June inflation provide an offsetting macro backdrop.
Middle East escalation is lifting oil through supply-route risks centered on Hormuz and the Red Sea. Higher oil, shifting yields, dollar strength, and weakness in gold add cross-asset volatility.
Market News Sentiment
Market News Articles: 40
- Neutral: 47.50%
- Negative: 32.50%
- Positive: 20.00%
Sentiment Summary: Of 40 market news articles, 48% were neutral, 33% negative, and 20% positive, indicating predominantly neutral coverage with a negative skew over positive items.
Conclusion: Indices futures day traders are facing a news backdrop where neutral reporting is dominant, while negative articles outnumber positive articles.
GLD,Gold Articles: 15
- Negative: 46.67%
- Positive: 40.00%
- Neutral: 13.33%
Sentiment Summary: Gold coverage is mixed, with 47% negative, 40% positive, and 13% neutral sentiment across 15 articles.
Conclusion: The gold news tone is slightly negative overall, with positive and negative coverage relatively balanced.
USO,Oil Articles: 7
- Positive: 71.43%
- Negative: 14.29%
- Neutral: 14.29%
Sentiment Summary: USO/Oil coverage is predominantly positive at 71%, with 14% negative and 14% neutral across 7 articles.
Conclusion: Oil-related news tone is positive overall, with limited negative coverage.
Market Data Snapshot
ETF Snapshot of major stock market ETFs, Mag7, and others as of: July 17, 2026 07:16
Top Movers & Losers
- AAPL 333.26 Bullish 1.76% ▲
- MSFT 401.10 Bullish 1.38% ▲
- IJH 75.99 Bullish 0.48% ▲
- NVDA 207.40 Bearish -2.40% ▼
- META 664.54 Bearish -2.46% ▼
- GOOG 353.81 Bearish -4.43% ▼
Major Index ETFs: SPY, QQQ, DIA, IWM, IJH
- IJH 75.99 Bullish 0.48% ▲
- IWM 295.59 Bearish -0.06% ▼
- DIA 524.83 Bearish -0.21% ▼
- SPY 750.72 Bearish -0.54% ▼
- QQQ 705.94 Bearish -1.64% ▼
Major index ETFs were Bearish overall: IJH was the most bullish mover at +0.48%, while QQQ was the most bearish mover at -1.64%. SPY declined -0.54%, DIA fell -0.21%, and IWM was marginally Bearish at -0.06%.
Mag 7 Stocks: AAPL, MSFT, GOOG, AMZN, META, NVDA, TSLA
- AAPL 333.26 Bullish 1.76% ▲
- MSFT 401.10 Bullish 1.38% ▲
- TSLA 391.06 Bearish -0.86% ▼
- AMZN 249.89 Bearish -1.99% ▼
- NVDA 207.40 Bearish -2.40% ▼
- META 664.54 Bearish -2.46% ▼
- GOOG 353.81 Bearish -4.43% ▼
Mag7 breadth is Bearish: AAPL is the most bullish mover at +1.76%, followed by MSFT at +1.38%. GOOG is the most bearish mover at -4.43%, with META -2.46%, NVDA -2.40%, AMZN -1.99%, and TSLA -0.86% also Bearish.
Cross-Market ETFs: TLT, GLD, USO, IBIT
- TLT 84.21 Bearish -0.04% ▼
- IBIT 36.39 Bearish -1.14% ▼
- USO 119.30 Bearish -1.71% ▼
- GLD 364.96 Bearish -1.98% ▼
Other ETFs were Bearish across the snapshot. GLD led losses at -1.98%, followed by USO at -1.71% and IBIT at -1.14%. TLT was the least negative mover, marginally lower at -0.04%.
ETF, Mag7, and Cross-Market ETF Insights
Overall Tone
Mixed tone: equity leadership is selective while broad index ETFs and cross-market ETFs are Bearish.
Equity ETFs and Mag7:
Major Index ETFs were mostly Bearish, led lower by QQQ at -1.64%, while SPY fell -0.54% and DIA declined -0.21%; IJH was the lone Bullish index ETF at +0.48%, while IWM was marginally Bearish at -0.06%. Mag7 action was selective: AAPL was the most bullish mover at +1.76%, followed by MSFT at +1.38%, while GOOG was the most bearish mover at -4.43%. META fell -2.46%, NVDA declined -2.40%, AMZN lost -1.99%, and TSLA fell -0.86%, showing narrow leadership rather than broad equity alignment.
Cross-Market ETFs:
Cross-market ETFs were uniformly Bearish, with TLT near-flat and the least negative mover at -0.04%. GLD was the most bearish mover at -1.98%, followed by USO at -1.71% and IBIT at -1.14%. The concurrent declines in gold, oil, and bitcoin align with broader Bearish pressure rather than commodity or alternative-asset strength.
Futures Indices – Higher Time Frame Analysis
Summary of the current state of US Indices Futures based on higher time-frame (HTF) technical analysis as of: 2026-07-17: 07:16 CT.
US Indices Futures
- ES: YSFG up, MSFG/WSFG below F0%, UTrend and rising benchmarks; 7693.50 resistance, 7278.50 pivot support; weekly consolidation, daily mixed.
- NQ: YSFG up, MSFG/WSFG down below F0%; benchmarks mixed weekly, declining daily; 31090 resistance, 28510-28550 support, then 27757.
- YM: YSFG up, MSFG near F0%, WSFG down; rising major benchmarks, short-term pullback; 53658 resistance, 53393 recovery level, 52255/51006 supports.
- EMD: YSFG up, MSFG below F0%, WSFG up; rising long-term benchmarks, mixed daily pivots; 3892.4 resistance, 3839.8 pivot, 3727.8/3692.9 support.
- RTY: YSFG up, MSFG/WSFG below F0%; rising weekly benchmarks, bearish daily structure; 3068.4 resistance, 3043.0 recovery level, 2941.9/2827.8 support.
- FDAX: YSFG up, MSFG/WSFG down below F0%; rising weekly benchmarks, daily downside momentum; 26064 resistance, 25487 pivot, 24715/24130 support.
Overall State
- Short-Term: Bearish
- Intermediate-Term: Neutral
- Long-Term: Bullish
Conclusion
Long-term correlation remains upward across all contracts: YSFG positioning and rising 100/200-period benchmarks underpin the broader structure. Short-term conditions are mixed to bearish, led by NQ and FDAX downside swings; YM and RTY are also retracing from pivot highs. ES and EMD remain range-bound near upper swing areas. MSFG and WSFG readings are predominantly below F0%, aligning with corrective momentum beneath pivot-high resistance. Key pivot supports define current structural references.
Note: Intra-day counter-trend pullbacks or retracements may occur, HTF is context for informational usage and market structure. Glossary: Session Fib Grids periods of YSFG:’Yearly’, MSFG:’Monthly’, WSFG:’Weekly’
For full details visit: AlphaWebTrader Technicals
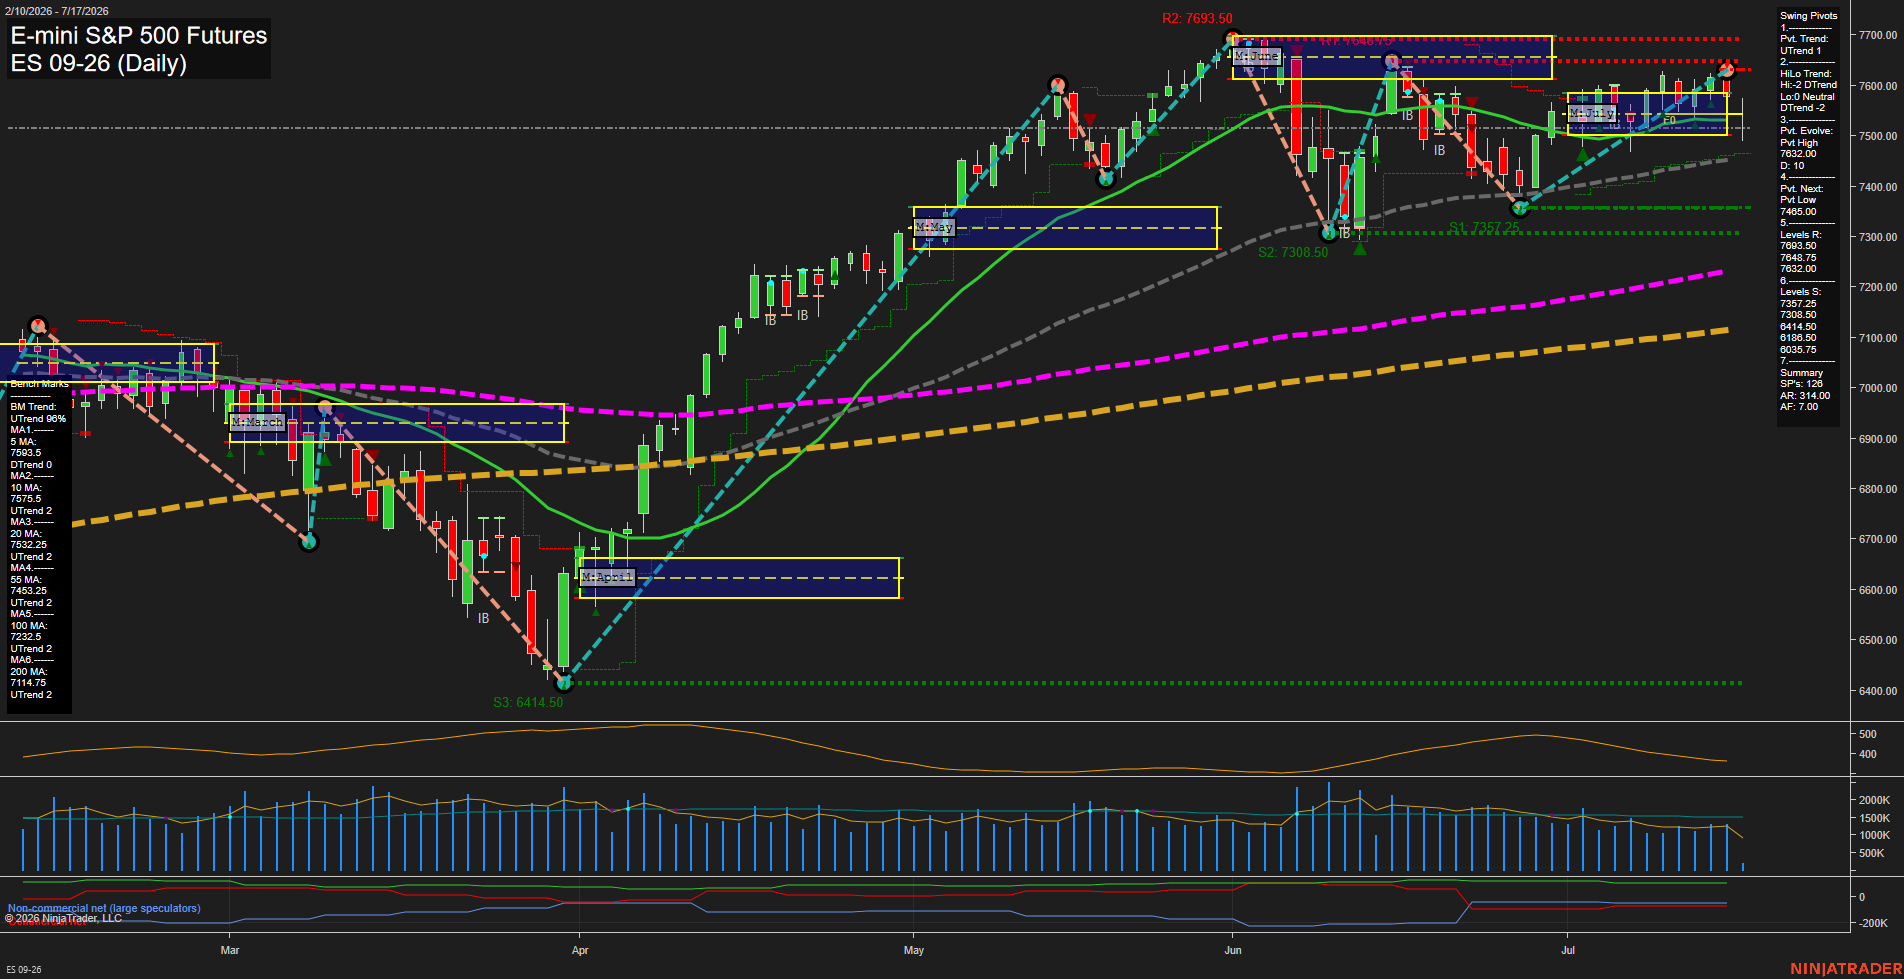
ES Daily View
Overall Rating
- Short-Term: Neutral
- Intermediate-Term: Neutral
- Long-Term: Bullish.
Key Insights Summary
Price is consolidating just below the 7632.00 pivot-high resistance after recovering from the late-June pullback. The short-term pivot has turned upward and price remains above the rising 10-day and 20-day benchmarks, but the weekly and monthly fib-grid readings remain below their F0% levels while the intermediate HiLo pivot trend remains down. This creates a mixed swing structure: an advancing near-term recovery inside a broader consolidation beneath 7648.75 and 7693.50 resistance. The long-term structure remains constructive, supported by price holding above all major rising intermediate- and long-term moving averages and the positive yearly fib-grid trend.
View charts on: AlphaWebTrader HTF Charts
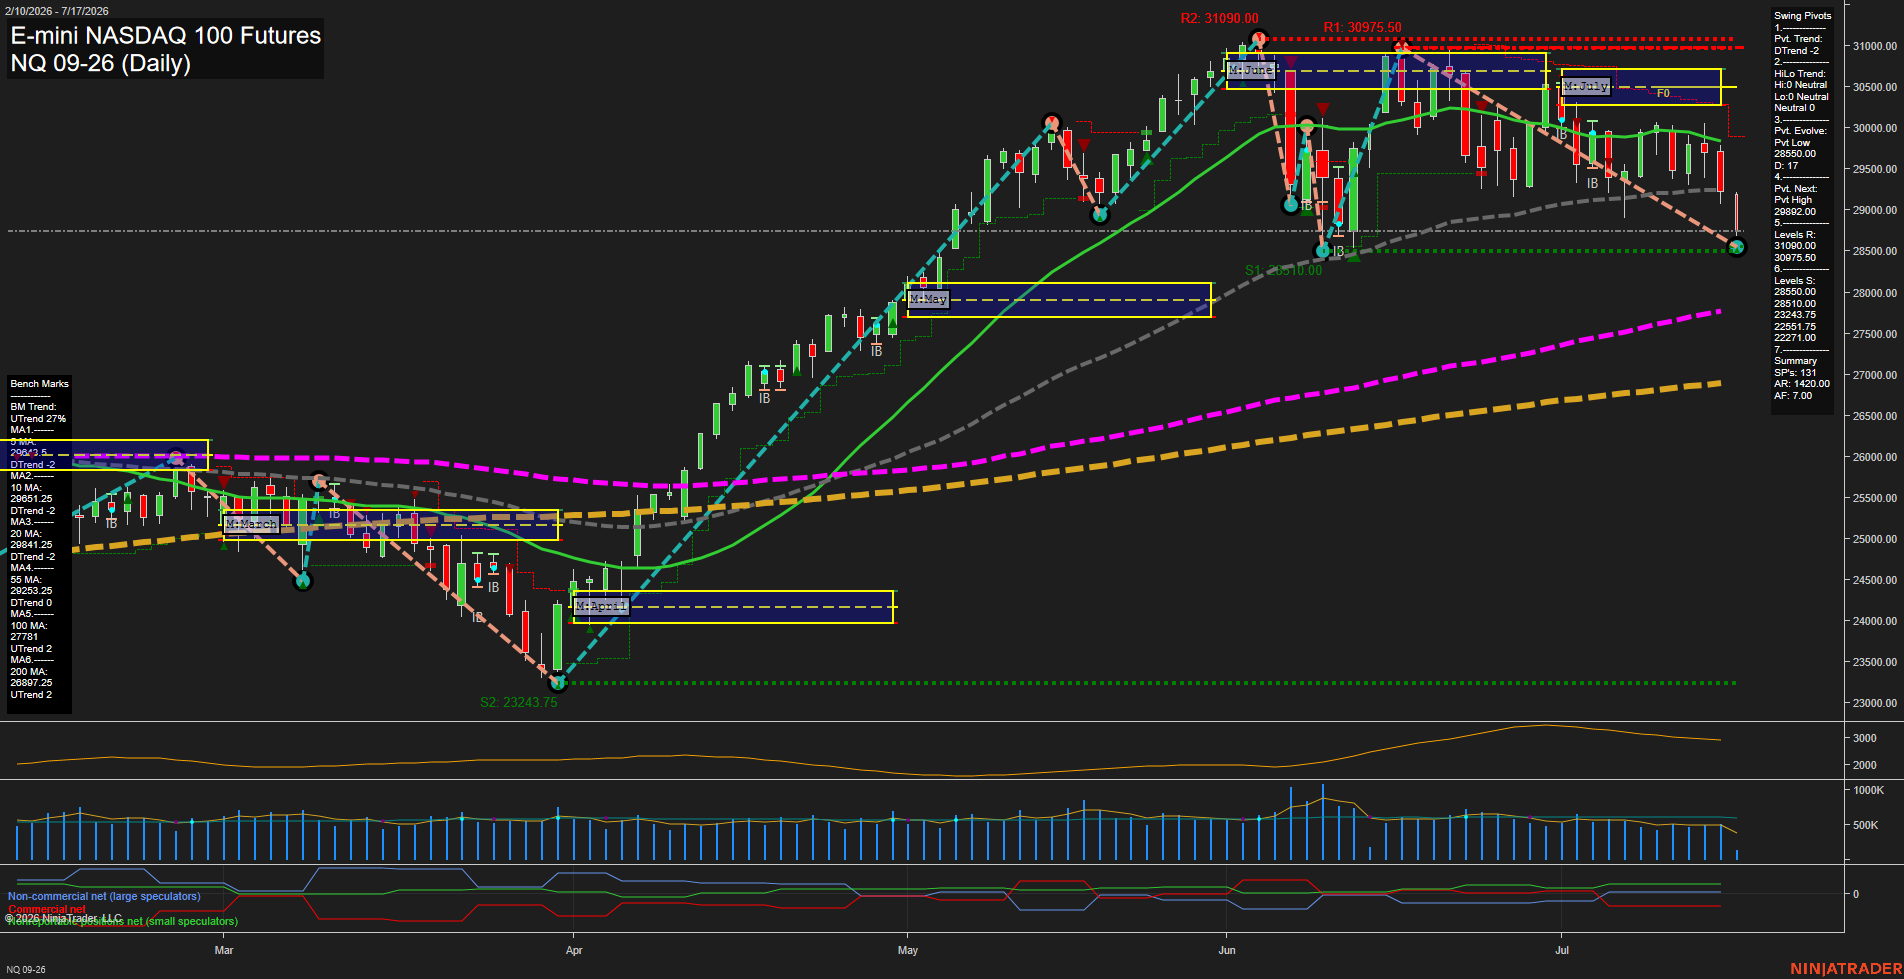
NQ Daily View
Overall Rating
- Short-Term: Bearish
- Intermediate-Term: Bearish
- Long-Term: Bullish.
Key Insights Summary
Daily price action has shifted into a fast downside swing, with large bars pressing the 28550 to 28510 pivot-support area after rejection from the 30975.5 to 31090 resistance zone. Short-term structure is a DTrend, price is below both the weekly and monthly Fib-grid centers, and all short-to-intermediate benchmark averages are declining. The larger 2026 trend remains constructive because price is still above rising 100-day and 200-day benchmarks, framing the current decline as a sharp countertrend retracement within the longer-term advance.
View charts on: AlphaWebTrader HTF Charts
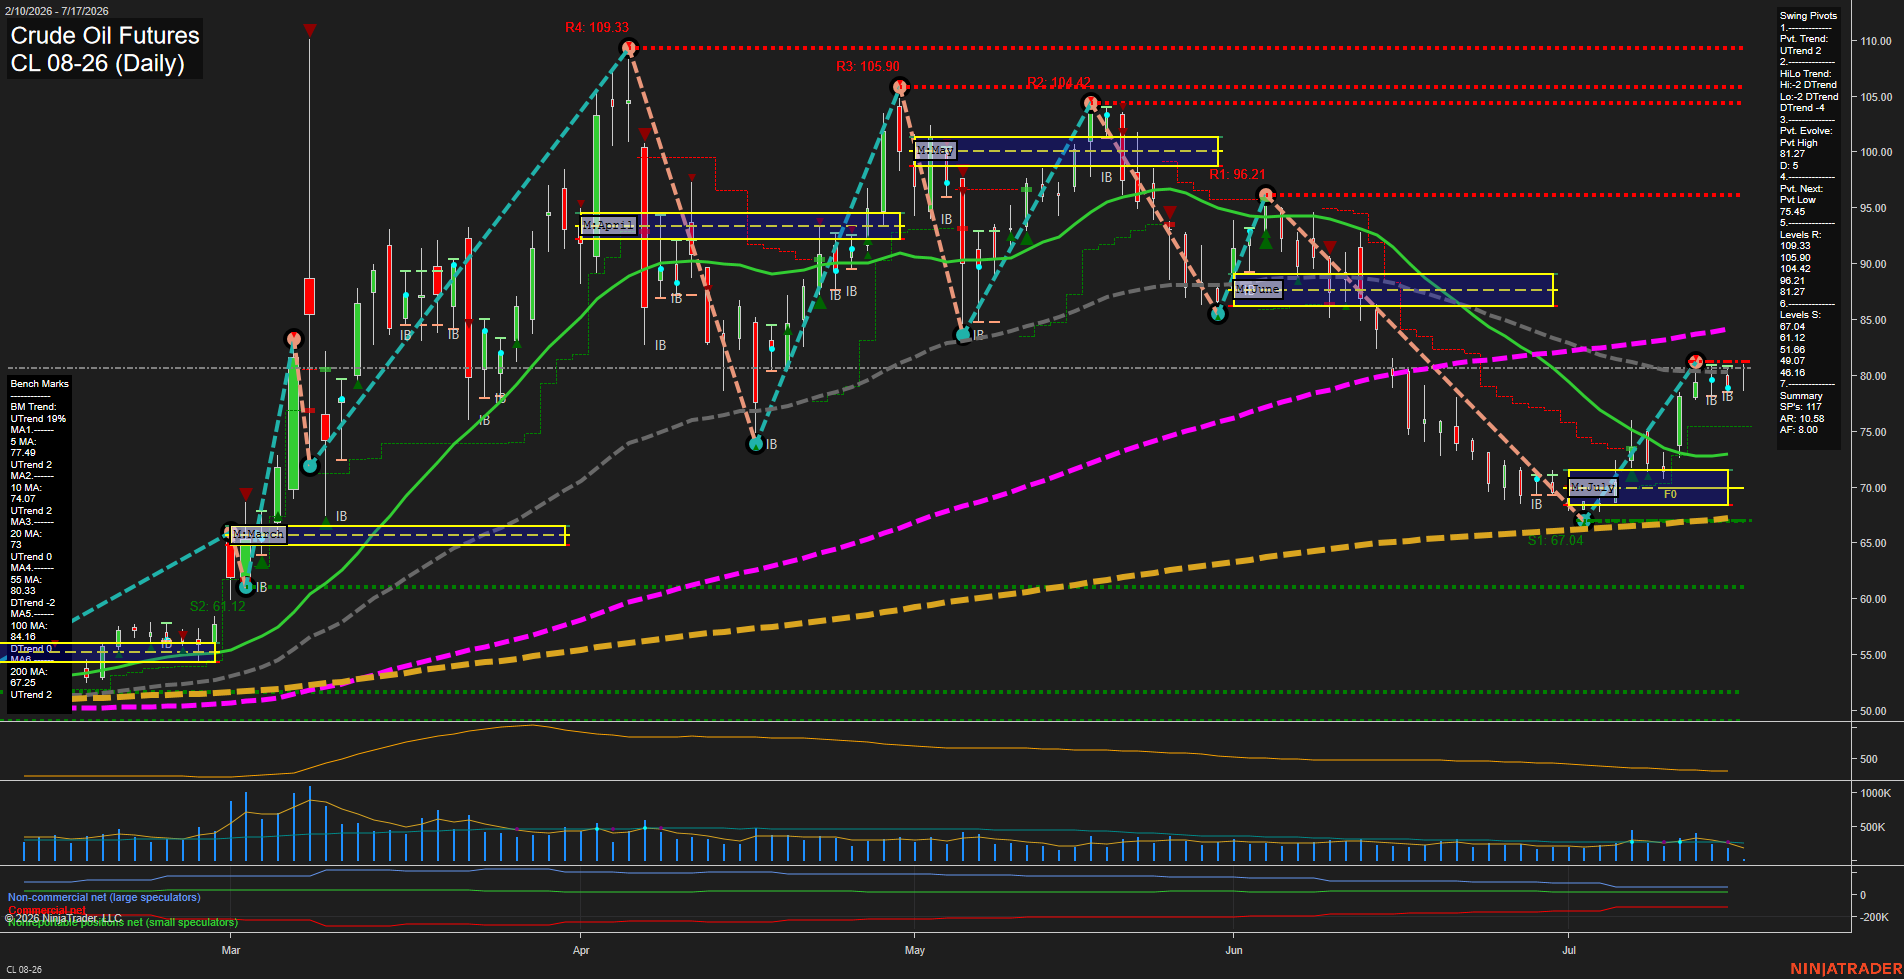
CL Daily View
Overall Rating
- Short-Term: Bullish
- Intermediate-Term: Neutral
- Long-Term: Neutral.
Key Insights Summary
Price has staged a sharp V-shaped recovery from the July low near 67.04 and is holding above the rising 5-, 10-, and 20-day benchmarks, supporting the short-term UTrend and positive weekly/monthly Fib-grid bias. The rebound has reached the declining 55-day average near 80.33 and remains below the 100-day average near 84.10, leaving the intermediate structure defined as a countertrend recovery within a broader HiLo DTrend. Small recent bars near 81 indicate slowing momentum and consolidation beneath the evolving 81.87 pivot high, while 75.45 is the next pivot-reversal reference. The major 200-day benchmark remains rising near 67.25, preserving constructive long-cycle support despite the intermediate-term overhead resistance structure.
View charts on: AlphaWebTrader HTF Charts
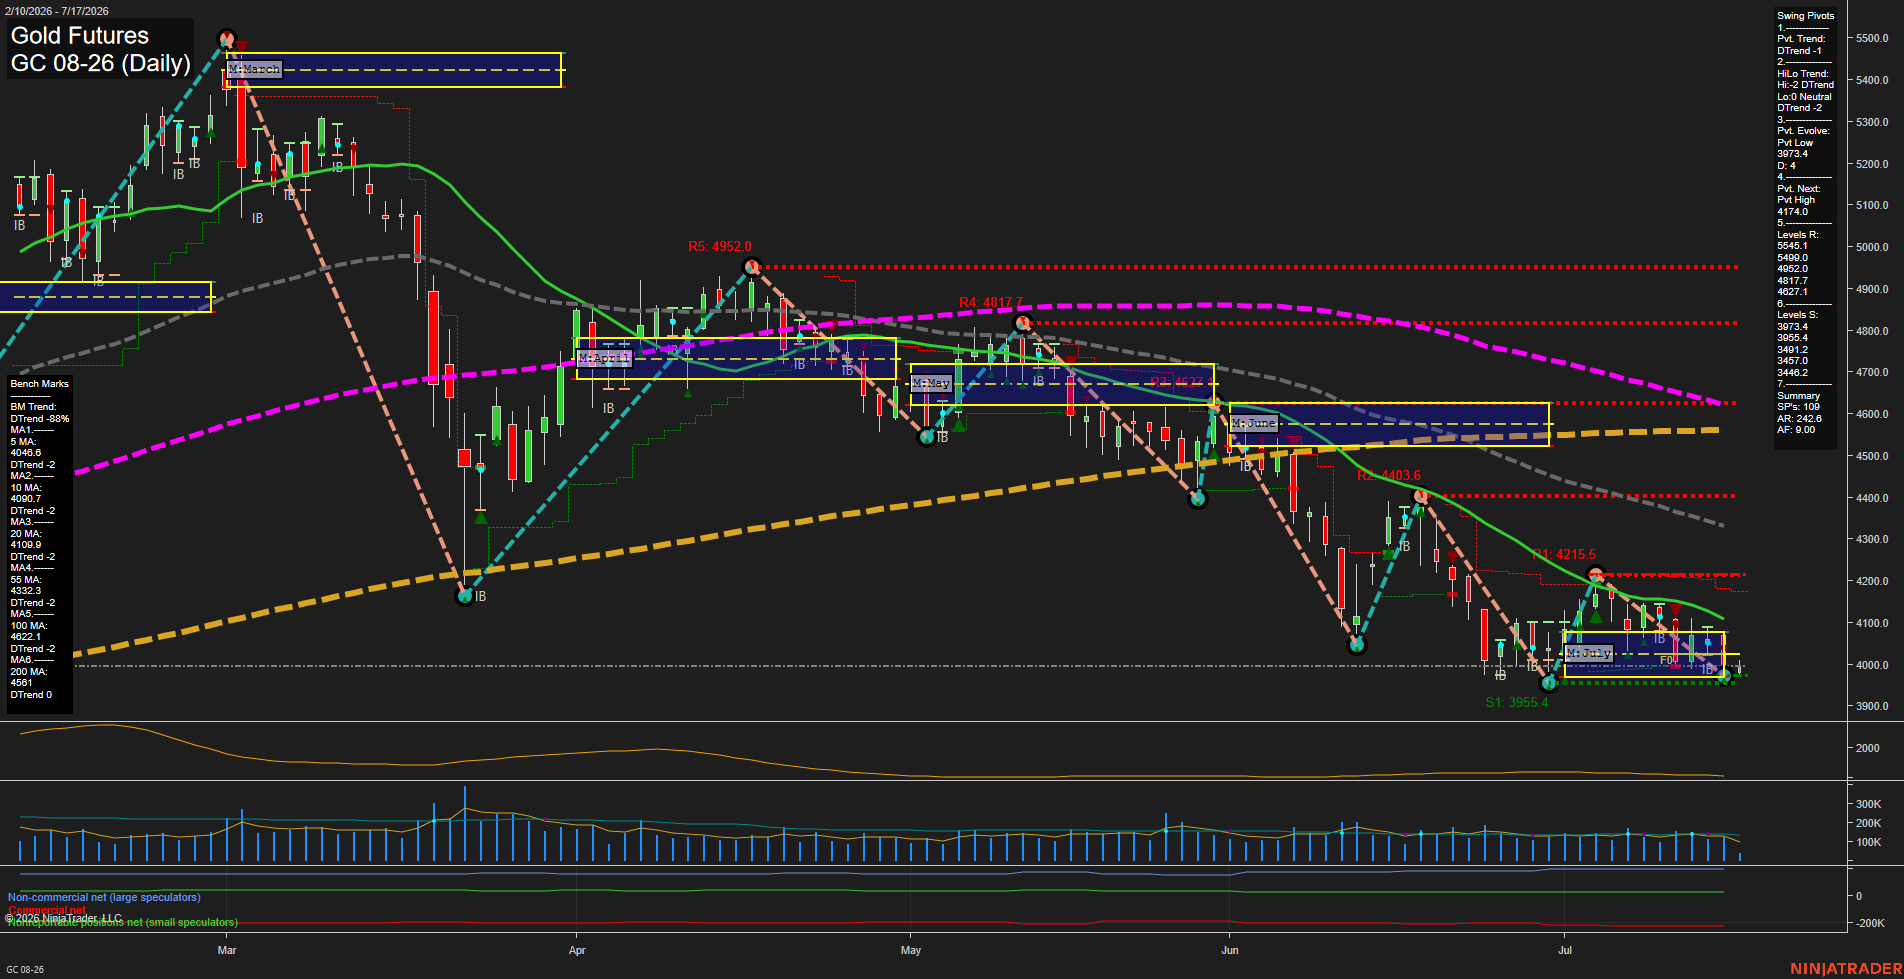
GC Daily View
Overall Rating
- Short-Term: Bearish
- Intermediate-Term: Bearish
- Long-Term: Bearish.
Key Insights Summary
Gold remains in a broad daily downtrend, with price trading beneath the declining 10, 20, 55, 100, and 200-day benchmarks. The July monthly grid is marginally positive above its F0% level, but this counter-trend condition has not changed the lower-high and lower-low pivot structure. Small daily bars and slowing momentum indicate consolidation near the 3955.4 to 3973.4 support zone, while 4174.0 is the next pivot reversal threshold and 4215.5 is nearby structural resistance. The short-term signal alignment is negative, and the intermediate and long-term benchmark structure remains decisively downward.
View charts on: AlphaWebTrader HTF Charts