
U.S. stocks closed lower as chip momentum faded, AI concerns, Middle East tensions, oil prices, tariffs and higher yields shaped market risk sentiment.
Fundamentals: U.S. equities finished cautiously lower after an early chip-sector rebound lost momentum, leaving investors focused on AI competition, major technology earnings and uncertain contract activity. Middle East tensions lifted crude and gasoline prices, while higher Treasury yields and a stronger dollar weighed on gold. New Canadian tariffs and rising hedging demand added to cross-asset volatility.
Technicals: U.S. market action showed mixed ETF performance, with Microsoft, Alphabet and IBIT higher while Apple and Tesla declined. Futures technical readings remained broadly constructive over longer horizons, though daily conditions were weaker in Nasdaq 100 and DAX contracts. S&P 500 and Dow futures were consolidating below recent highs, while Russell 2000 and E-mini S&P midcap futures held mixed near-term signals.
After Market Close daily snapshot: market news summary and sentiment, major ETFs, Magnificent 7 analysis, Indices Futures Higher Time Frame Analysis, and E-mini S&P500, Nasdaq 100, NYMEX Crude, Gold Futures Daily Chart analysis.
As of: July 20, 2026 05:00 CT
Market News Summary:
U.S. equities traded cautiously as a chip-share rebound faded amid AI concerns, Middle East tensions, higher oil prices, and new Canadian tariffs.
Primary Drivers & Risks:
- Primary Driver: AI trade and chip earnings
- Primary Risk: Middle East oil and tariffs
Tone:
Cautious, with elevated cross-asset volatility.
Stock Market / ETFs / Indices:
U.S. stocks edged lower, while Nasdaq 100 chip shares rebounded from the prior week’s selloff before losing momentum. The S&P 500 remained just below its all-time high, while technology fell 1.11% on Friday. Investor focus centered on Alphabet, Intel, and Texas Instruments earnings, AI competition from China, and uncertainty surrounding major AI contracts. Hedging demand and implied volatility increased across asset classes.
Geopolitical:
Escalating U.S.-Iran tensions and the collapse of an Iran ceasefire arrangement continued to unsettle markets. The U.S. also imposed additional 50% tariffs on selected Canadian goods, with energy among the exempt areas.
Oil / Energy:
Iran conflict risks pushed global oil prices and U.S. gasoline prices higher, with the national average regular gasoline price moving above $4 per gallon. U.S. Strategic Petroleum Reserve crude inventories fell by 5.1 million barrels to 311.4 million barrels, the lowest level since March 1983. Hormuz-related risk supported crude prices.
Gold / Metals:
Gold remained under pressure from higher Treasury yields and a firmer U.S. dollar, despite modest late-session gains from short covering and softer equities. Silver also firmed, while elevated oil prices capped the metals rebound. Commentary remained divided between near-term rate pressure and oversold conditions.
Fed / Financials:
Rising Treasury yields remained the dominant stated influence on gold and silver prices. Bonds and commodities were highlighted as key areas to monitor alongside equity-market conditions.
Macro / Other:
Higher fuel costs added an inflation-sensitive cross-current for markets. Trade restrictions on Canadian imports introduced another potential cost and supply-chain concern.
Conclusion:
AI sentiment, chip-sector price action, and approaching large-cap technology earnings drove index-futures attention. Oil strength tied to Middle East tensions added pressure to the risk backdrop.
Higher Treasury yields and the stronger dollar restrained precious metals despite a late-session stabilization. Canadian tariffs, elevated hedging demand, and a low Strategic Petroleum Reserve level added further market cross-currents.
Market News Sentiment
Market News Articles: 44
- Neutral: 50.00%
- Negative: 31.82%
- Positive: 18.18%
Sentiment Summary: Of 44 market news articles, 50% were neutral, 32% negative, and 18% positive, indicating a neutral-to-cautious news tone.
Conclusion: Negative coverage exceeded positive coverage, while neutral reporting remained the largest share.
GLD,Gold Articles: 10
- Negative: 50.00%
- Neutral: 30.00%
- Positive: 20.00%
Sentiment Summary: GLD/Gold coverage was predominantly negative, with 50% negative, 30% neutral, and 20% positive articles across 10 items.
Conclusion: Gold-related news tone was net negative, indicating a cautious sentiment backdrop for indices futures day traders.
USO,Oil Articles: 18
- Negative: 50.00%
- Neutral: 27.78%
- Positive: 22.22%
Sentiment Summary: USO/Oil coverage is predominantly negative (50%), with neutral articles at 28% and positive articles at 22%.
Conclusion: Oil-related news tone is net negative, which may be a relevant cross-market sentiment input for indices futures day traders.
Market Data Snapshot
ETF Snapshot of major stock market ETFs, Mag7, and others as of: July 20, 2026 05:00
Top Movers & Losers
- MSFT 402.29 Bullish 2.15% ▲
- GOOG 351.37 Bullish 1.52% ▲
- IBIT 36.89 Bullish 1.49% ▲
- IJH 74.93 Bearish -0.81% ▼
- AAPL 326.59 Bearish -2.14% ▼
- TSLA 369.57 Bearish -2.96% ▼
Major Index ETFs: SPY, QQQ, DIA, IWM, IJH
- QQQ 696.06 Bullish 0.10% ▲
- SPY 742.09 Bearish -0.16% ▼
- DIA 517.94 Bearish -0.55% ▼
- IWM 292.31 Bearish -0.59% ▼
- IJH 74.93 Bearish -0.81% ▼
Mixed index ETF action: QQQ was the most bullish mover at +0.10%, a marginal gain, while IJH was the most bearish mover at -0.81%. SPY was near-flat at -0.16%; DIA, IWM, and IJH showed broader Bearish pressure at -0.55%, -0.59%, and -0.81%, respectively.
Mag 7 Stocks: AAPL, MSFT, GOOG, AMZN, META, NVDA, TSLA
- MSFT 402.29 Bullish 2.15% ▲
- GOOG 351.37 Bullish 1.52% ▲
- AMZN 249.99 Bullish 1.12% ▲
- NVDA 203.28 Bullish 0.23% ▲
- META 645.85 Bearish -0.02% ▼
- AAPL 326.59 Bearish -2.14% ▼
- TSLA 369.57 Bearish -2.96% ▼
Mixed Mag7 snapshot: MSFT is the most bullish mover at +2.15%, followed by GOOG at +1.52% and AMZN at +1.12%. NVDA is marginally Bullish at +0.23%, while META is near-flat Bearish at -0.02%. AAPL is Bearish at -2.14%, and TSLA is the most bearish mover at -2.96%.
Cross-Market ETFs: TLT, GLD, USO, IBIT
- IBIT 36.89 Bullish 1.49% ▲
- USO 125.51 Bullish 1.25% ▲
- GLD 367.60 Bearish -0.22% ▼
- TLT 83.89 Bearish -0.75% ▼
Mixed cross-market context: IBIT is the most bullish mover at +1.49%, followed by USO at +1.25%. TLT is the most bearish mover at -0.75%, while GLD is marginally Bearish at -0.22%.
ETF, Mag7, and Cross-Market ETF Insights
Overall Tone
Mixed conditions prevailed, with selective Bullish strength in several Mag7 names and commodities offset by Bearish breadth across major equity ETFs, bonds, and key equity laggards.
Equity ETFs and Mag7:
Major Index ETFs were broadly Bearish outside marginally Bullish QQQ at +0.10%; SPY fell -0.16%, while small and mid-cap exposure lagged through IWM at -0.59% and IJH at -0.81%, the most bearish major equity ETF. Mag7 action was selective: MSFT led all provided instruments with +2.15%, followed by GOOG at +1.52% and AMZN at +1.12%, while TSLA was the most bearish mover overall at -2.96% and AAPL declined -2.14%.
Cross-Market ETFs:
Cross-market ETFs were Mixed, led by IBIT at +1.49% and USO at +1.25%, showing Bullish strength in bitcoin and oil exposure. GLD was modestly Bearish at -0.22%, while TLT was the most bearish cross-market ETF at -0.75%, diverging from the strength in USO and IBIT.
Futures Indices – Higher Time Frame Analysis
Summary of the current state of US Indices Futures based on higher time-frame (HTF) technical analysis as of: 2026-07-20: 17:00 CT.
US Indices Futures
- ES YSFG/MSFG/WSFG above F0%, UTrend; 7693.50 resistance, 7292.50 reversal pivot; short benchmarks down, major benchmarks rising.
- NQ YSFG/WSFG above F0%, MSFG below; DTrend below short benchmarks; 28408.25 support, 29728.75 reversal, 31090.00 resistance.
- YM YSFG/MSFG/WSFG above F0%, higher pivots; 53656-53866 resistance, 52117 support, 51104 reversal; major benchmarks rising.
- EMD YSFG/WSFG above F0%, MSFG below; 3892.4 resistance, 3834.7/3724.0 support, 3839.0 reversal; long benchmarks rising.
- RTY YSFG/WSFG above F0%, MSFG below; 3068.4 resistance, 3042.4/2947.8 support, 2836.0 reversal; short pivots DTrend.
- FDAX YSFG/WSFG above F0%, MSFG below; 26064 resistance, 25465 reversal, 24730 support; daily DTrend, long benchmarks rising.
Overall State
- Short-Term: Neutral
- Intermediate-Term: Bullish
- Long-Term: Bullish
Conclusion
Long-term alignment remains bullish across all listed indices, with YSFG and WSFG generally above F0% and 100/200-period benchmarks rising. ES and YM remain above all Fib centers, while NQ, EMD, RTY, and FDAX hold MSFG below F0%, correlating with daily corrective pivots. NQ and FDAX show the weakest short-term structure; ES and YM are consolidating below swing highs. Pivot support and reversal levels define the current pullback structures beneath recent highs.
Note: Intra-day counter-trend pullbacks or retracements may occur, HTF is context for informational usage and market structure. Glossary: Session Fib Grids periods of YSFG:’Yearly’, MSFG:’Monthly’, WSFG:’Weekly’
For full details visit: AlphaWebTrader Technicals
ES Daily View
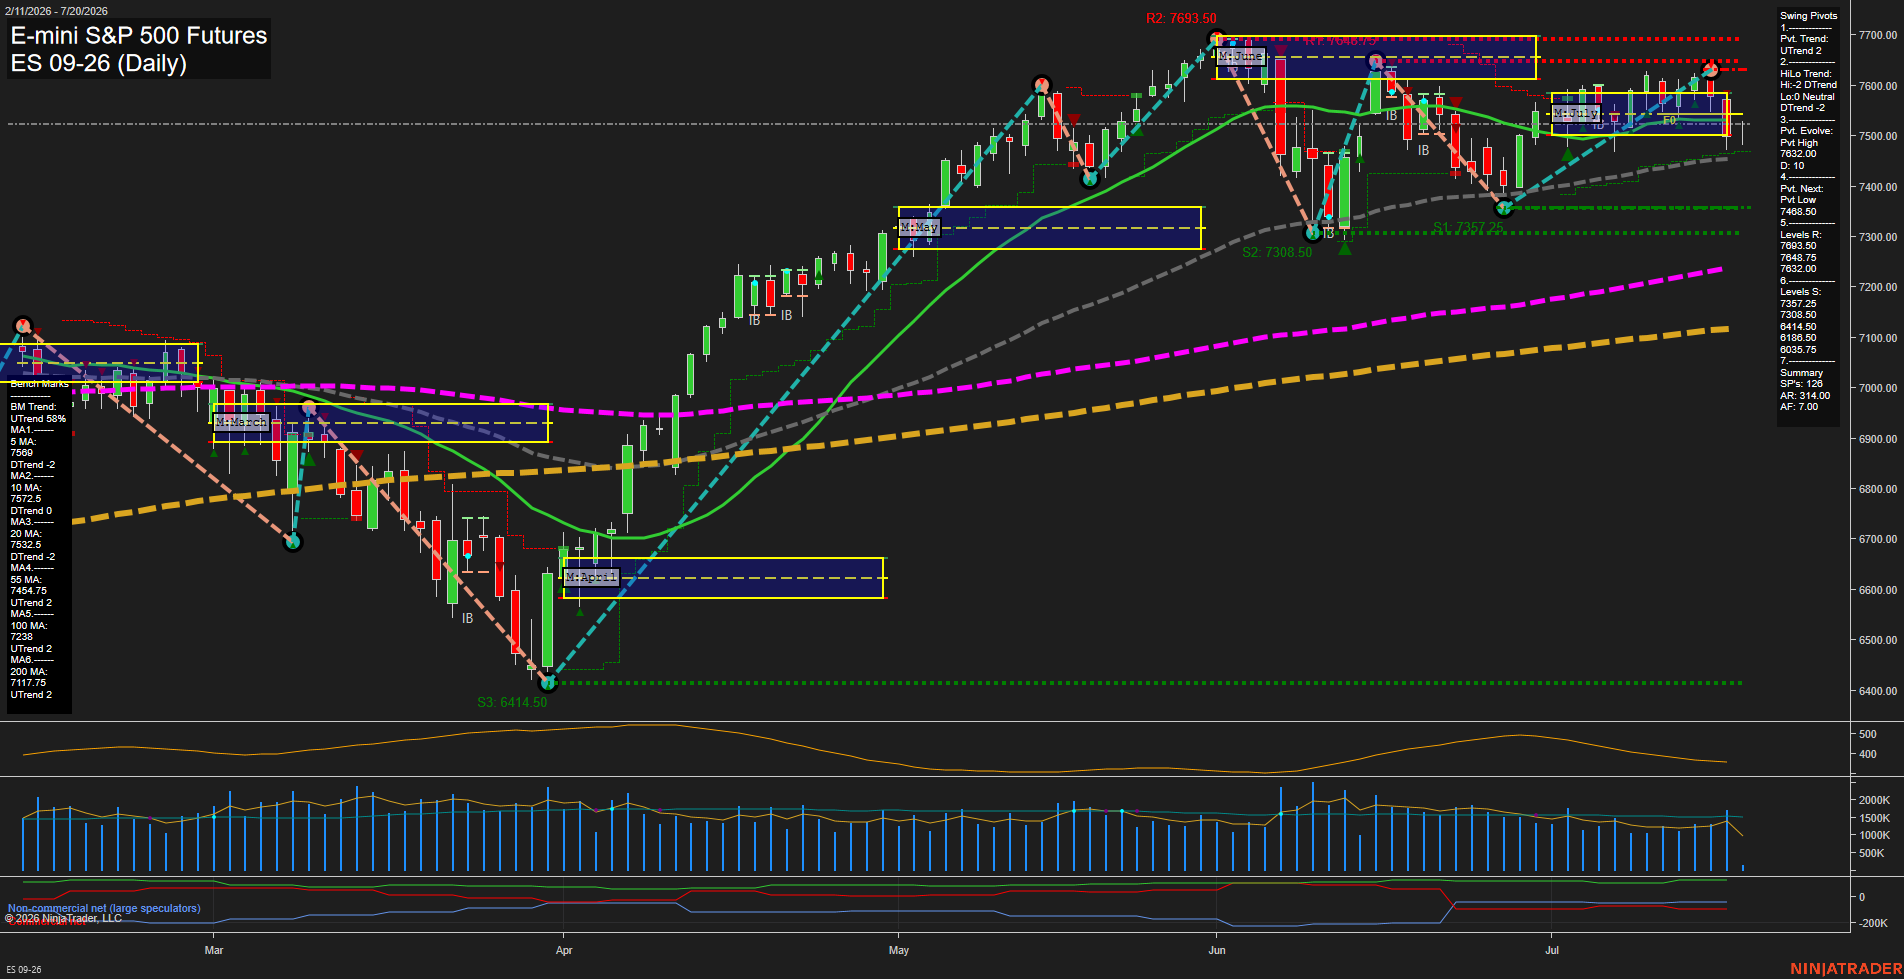
Overall Rating
- Short-Term: Bullish
- Intermediate-Term: Bullish
- Long-Term: Bullish.
Key Insights Summary
The daily structure remains broadly constructive, with price above the rising 55-, 100-, and 200-day benchmarks and both monthly and yearly Fib-grid trends pointed higher. Short-term action is consolidative and choppy beneath the 7632.00-7648.75 resistance cluster, while the declining 10- and 20-day averages reflect a recent pullback from the June high. The UTrend pivot condition remains intact, although the intermediate HiLo trend is still DTrend, defining the current action as a countertrend retracement within the larger advance. Support is concentrated near the 7468.50 pivot-reversal area, followed by 7357.25 and 7308.50; sustained trade above the monthly F0% area preserves the broader higher-low recovery pattern.
View charts on: AlphaWebTrader HTF Charts
NQ Daily View
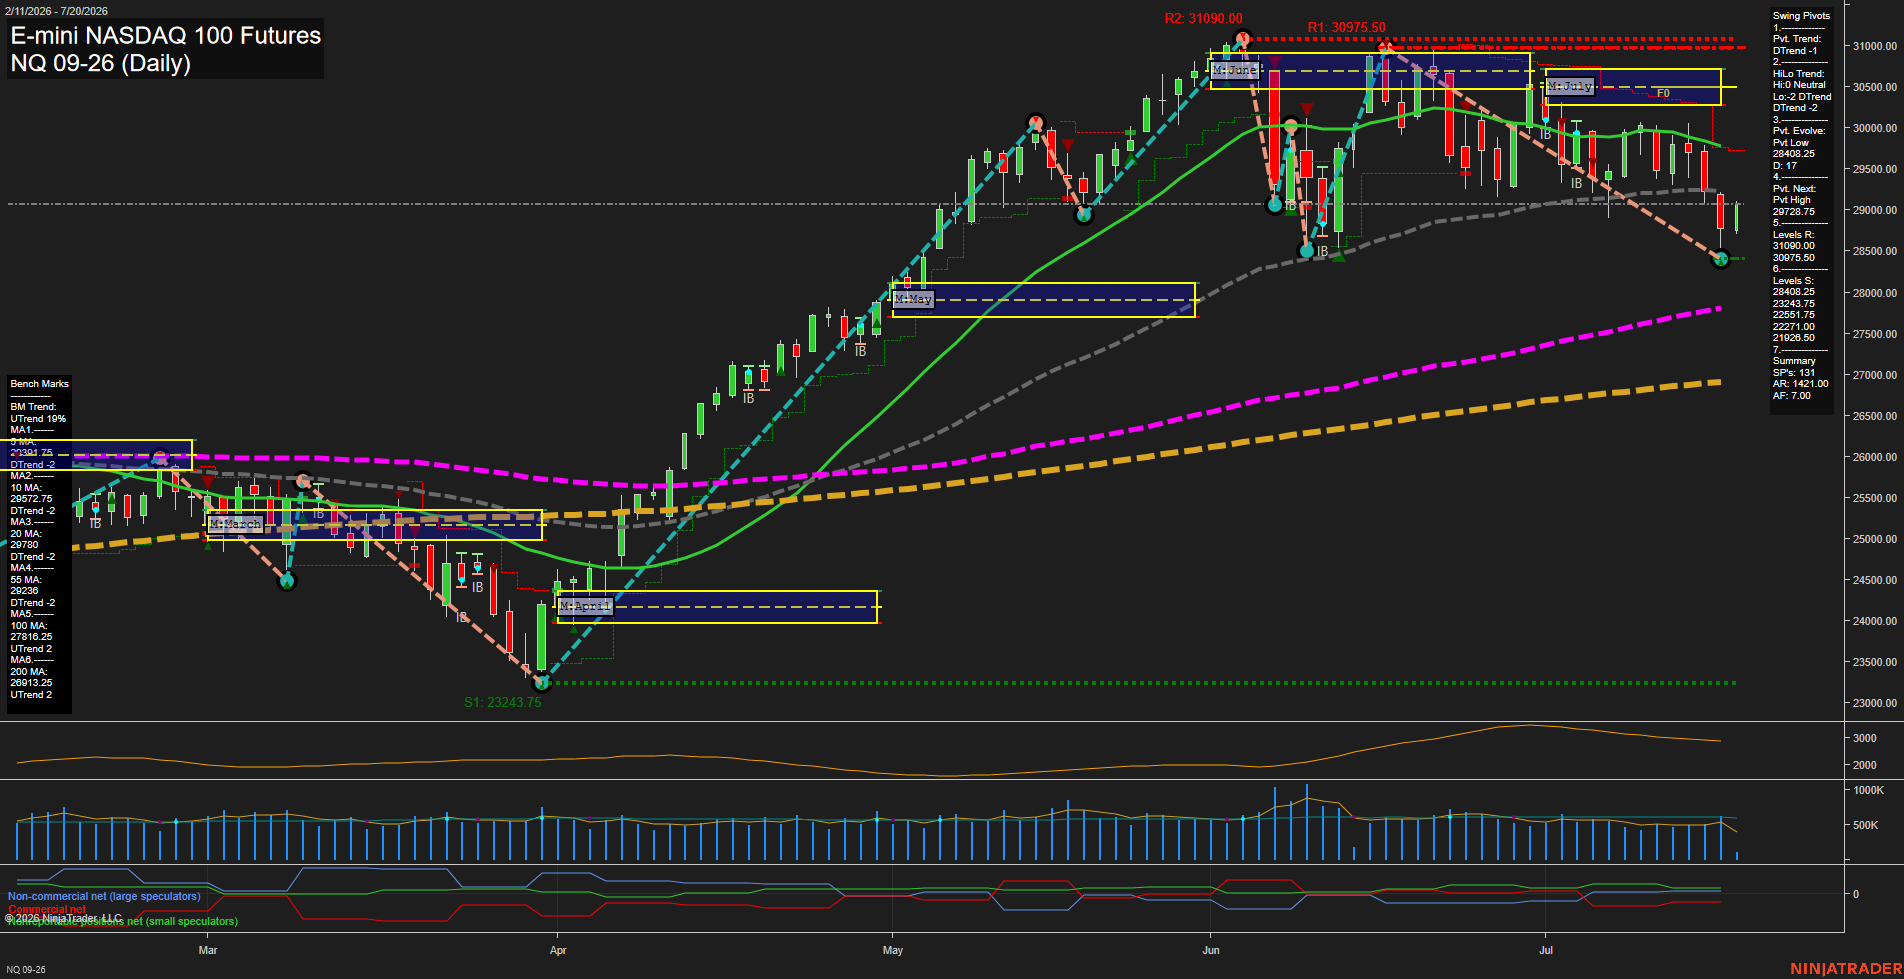
Overall Rating
- Short-Term: Bearish
- Intermediate-Term: Bearish
- Long-Term: Bullish.
Key Insights Summary
Price has undergone a sharp short-term retracement from the June highs, producing a DTrend pivot structure and trading beneath the 5-, 10-, 20-, and 55-day benchmarks. The weekly fib structure remains positive, while the July monthly grid is below its F0% area, reflecting a counter-trend decline within the broader annual uptrend. The 28408.25 pivot low is the active short-term structural reference, with 29728.75 defining the next upside pivot reversal level. Long-term benchmark alignment remains constructive as price holds above the rising 100- and 200-day averages, despite elevated daily range and fast downside momentum.
View charts on: AlphaWebTrader HTF Charts
CL Daily View
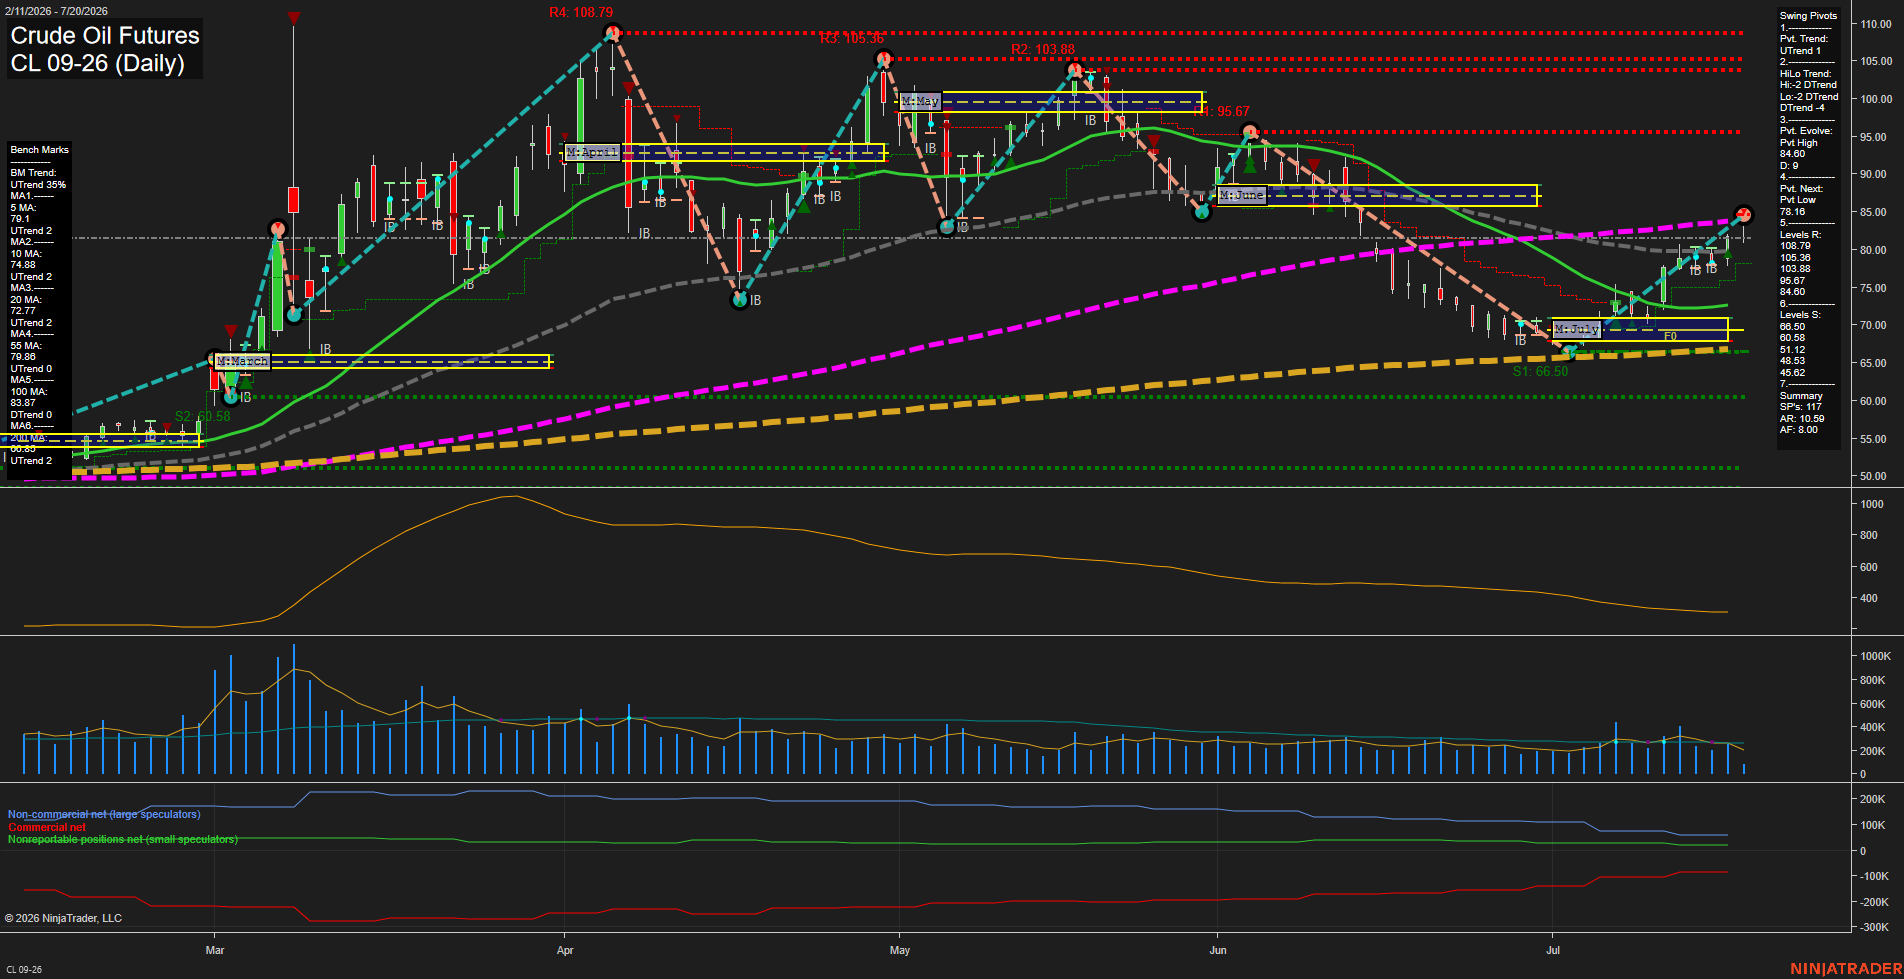
Overall Rating
- Short-Term: Bullish
- Intermediate-Term: Bullish
- Long-Term: Bullish.
Key Insights Summary
CL has produced a sharp V-style recovery from the early-July low area, reclaiming the 5-, 10-, 20-, and 55-day benchmarks while forming higher lows. Short-term pivot structure is positive, although price is testing the 84.60 pivot-high area and remains below the declining 100-day benchmark near 83.87 only marginally. The weekly grid remains below its F0% reference, creating a countertrend short-term backdrop within an otherwise upward monthly and yearly grid structure. The intermediate HiLo pivot trend remains down, reflecting the larger decline from the May-June highs, while the current rally has restored bullish near-term momentum. Volume participation is moderate and ATR has compressed from prior highs, consistent with a recovery phase rather than the earlier high-volatility selloff.
View charts on: AlphaWebTrader HTF Charts
GC Daily View
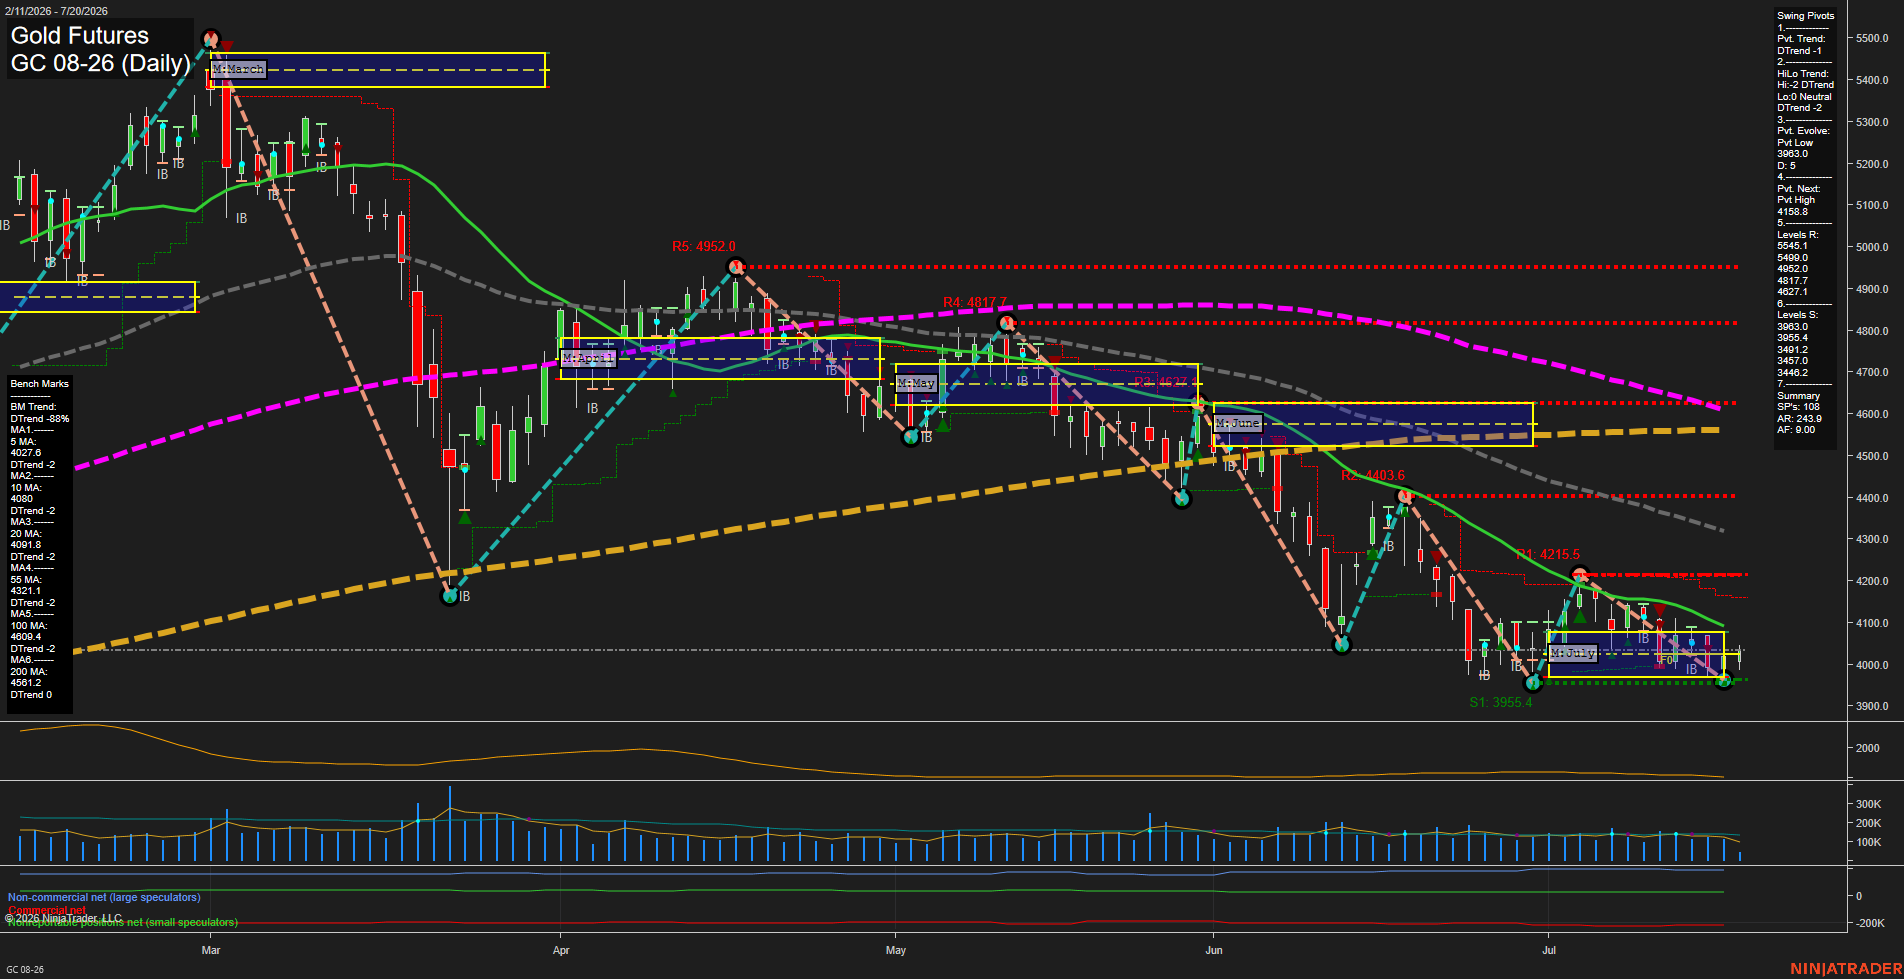
Overall Rating
- Short-Term: Bearish
- Intermediate-Term: Bearish
- Long-Term: Bearish.
Key Insights Summary
GC is consolidating tightly near the 3963-4029 support area following a sharp multi-month decline. The weekly and monthly Fib grids show a countertrend upward bias, but pivot structure remains in DTrend and price is below the 10, 20, 55, 100, and 200 day benchmarks. Small daily bars and subdued momentum reflect compression after the selloff; 4158.8 defines the next pivot reversal threshold, while 3963.0 and 3955.4 remain the nearby swing support cluster. The broader structure continues to show lower highs and lower lows, with the recent WSFG and MSFG long signals representing a short-term rebound within a still-bearish intermediate and long-term price cycle.
View charts on: AlphaWebTrader HTF Charts