U.S. stock futures hold a bullish pre-market structure across ES, NQ, YM, RTY, FDAX and EMD as oil eases, gold softens and Fed remarks loom.
Fundamentals: U.S. stock index futures are higher in pre-market trading as markets react to shifting U.S.-Iran peace developments, stronger semiconductor shares, and lower oil prices. Gold is softer, Treasury yields are mixed, and traders are also watching Fed messaging, valuation commentary, and the Tuesday CB Consumer Confidence release.
Technicals: U.S. index futures enter the NYSE pre-market session with broadly bullish weekly and daily structure across ES, NQ, YM, RTY, FDAX and EMD. Prior-session ETF leaders included TSLA, AAPL and IWM, while USO, NVDA and IBIT finished lower. The setup review focuses on benchmark alignment, swing pivots and recent price action across major futures and ETFs.
Pre-Market Trading 360° view Market Radar of: holidays, earnings, eco-news, market-news summary, news sentiment, prior session major ETFs, MAG7, Higher Time Frame Analysis Indices Futures Summary, and E-mini S&P500, Nasdaq 100, NYMEX Crude, Gold Futures Daily Chart analysis.
As of: May 26, 2026 07:16 CT
Earnings Radar
Monitoring for earnings releases by the Magnificent 7, AI-tech-related firms, and major financial institutions.
- SNOW Release: 2026-05-27 T:AMC
- CRM Release: 2026-05-27 T:AMC
Conclusion: SNOW and CRM both report on 2026-05-27 after the close, placing a near-term earnings event directly ahead of the next session. These releases can draw attention to large-cap software and broader tech sentiment, and market momentum and volume can slow ahead of major earnings releases.
For full details visit: Yahoo Earnings Calendar
EcoNews Radar U.S. Events
| Day | Time | Impact | Event |
|---|---|---|---|
| Tue | 10:00 | Medium | CB Consumer Confidence |
| Thu | 08:30 | High | Core PCE Price Index m/m |
| Thu | 08:30 | High | Prelim GDP q/q |
| Thu | 08:30 | Medium | Prelim GDP Price Index q/q |
| Thu | 08:30 | Medium | Unemployment Claims |
| Thu | 10:00 | Medium | New Home Sales |
| Thu | 12:00 | Low | Crude Oil Inventories |
EcoNews Summary
Thursday is the key macro session, with two high-impact releases at 08:30 USD time: Core PCE Price Index m/m and Prelim GDP q/q. Core PCE tracks consumer inflation pressures and is a major Federal Reserve inflation gauge, while GDP measures the pace of economic growth and shapes broad rate and risk sentiment. Tuesday’s 10:00 CB Consumer Confidence is a medium-impact read on household sentiment, but it sits below the Thursday data in market importance.
Event Notes:
- Tuesday 10:00 – USD CB Consumer Confidence: A survey of household views on business conditions, labor market prospects, and spending. Traders monitor it for signs of demand strength and broader risk appetite.
- Thursday 08:30 – USD Core PCE Price Index m/m: The Federal Reserve’s preferred inflation measure excluding food and energy. It gauges underlying price pressure and carries strong influence on rates, equities, and index futures.
- Thursday 08:30 – USD Prelim GDP q/q: The first quarterly estimate of U.S. economic growth. It measures the pace of overall activity and matters for growth expectations, policy outlook, and cross-asset volatility.
- Thursday 08:30 – USD GDP Price Index q/q: A broad inflation component within GDP that captures price changes across the economy. Traders watch it for additional inflation context alongside the growth headline.
Conclusion:
The single most important event of the week is Thursday at 08:30, led by USD Core PCE Price Index m/m. With PCE and GDP released at the same time, this session carries the highest market-moving risk, and momentum often slows ahead of major events such as PCE and GDP before volatility rises at release. News at the 10:00 cycle, including Tuesday’s Consumer Confidence, also acts as a common catalyst for reversals or continuations.
For full details visit: Forex Factory EcoNews
Market News Summary:
Equity futures, energy, gold, and rates are being driven by shifting U.S.-Iran peace developments, with stronger stock index futures and softer oil prices trading alongside mixed signals in metals and bonds.
Primary Drivers & Risks:
- Primary Driver: U.S.-Iran peace progress
- Primary Risk: Renewed Middle East escalation
Tone:
Risk-on in equities, with cross-asset volatility still elevated.
Stock Market / ETFs / Indices:
U.S. stock index futures climbed to record highs, with Dow futures up 250 points and broad strength tied to peace-talk optimism and gains in AI-linked semiconductor names. Intraday commentary also pointed to record highs and stronger opening conditions despite volatile energy markets.
Geopolitical:
Markets are reacting to U.S.-Iran negotiations, military strikes, truce developments, and potential reopening of the Strait of Hormuz. Headlines also highlighted peace pricing in futures and renewed tension that reduced some optimism.
Oil / Energy:
Oil prices moved sharply on U.S.-Iran headlines, including a 7% drop on possible deal progress and a later rebound as tensions rose again. Brent and WTI remained sensitive to Strait of Hormuz risk, while natural gas strength was noted in a separate forecast.
Gold / Metals:
Gold traded lower as traders weighed U.S.-Iran deal developments, after earlier strength above $4,550 and commentary on a broader bull case tied to sovereign liquidations and dovish central bank policy. Silver and platinum also showed upside momentum, while Russian sovereign gold reserves fell to a 24-year low.
Fed / Financials:
Fed Governor Christopher Waller said rates should remain steady amid continued inflation, while another headline noted Kevin Warsh’s arrival as Fed Chair drew little market reaction. Treasury yields also moved lower after the holiday break, even as a separate note flagged rising yields and a narrowing stock risk premium.
Macro / Other:
Market P/E ratios have fallen over the past three months, and one note said the earnings-yield premium over bonds has narrowed. Corporate profit strength and bond-market moves were also cited, alongside consumer trade-down behavior in restaurant spending.
Conclusion:
Primary drivers remain U.S.-Iran peace progress and the related impact on equities, oil, and safe-haven demand. Stock futures are firm, while oil and gold are more sensitive to each headline on negotiations and military activity.
Secondary influences include Fed-rate messaging, Treasury yield moves, and valuation commentary on stocks versus bonds. Semiconductor strength and broad corporate profit trends support the equity tone, while any renewed Middle East escalation keeps cross-asset volatility elevated.
Market News Sentiment
Market News Articles: 17
- Positive: 41.18%
- Neutral: 35.29%
- Negative: 23.53%
Sentiment Summary: Market news sentiment is mixed but slightly positive, with 41% positive, 35% neutral, and 24% negative coverage across 17 articles.
Conclusion: The news flow shows a modest positive bias with a substantial neutral share, indicating no strong one-sided tone in the current headlines.
GLD,Gold Articles: 9
- Positive: 66.67%
- Negative: 22.22%
- Neutral: 11.11%
Sentiment Summary: Gold-related articles are mostly positive, with 67% positive, 22% negative, and 11% neutral coverage.
Conclusion: The news tone is positive overall, with negative and neutral coverage representing a smaller share.
USO,Oil Articles: 11
- Neutral: 45.45%
- Negative: 36.36%
- Positive: 18.18%
Sentiment Summary: USO oil article sentiment is mostly neutral at 45%, with negative coverage at 36% and positive coverage at 18%.
Conclusion: The news flow is mixed and slightly neutral-to-negative, with no strong directional bias in the article sentiment.
Market Data Snapshot
ETF Snapshot of major stock market ETFs, Mag7, and others as of: May 26, 2026 07:16
Top Movers & Losers
- TSLA 426.01 Bullish 1.95% ▲
- AAPL 308.82 Bullish 1.26% ▲
- IWM 285.12 Bullish 0.93% ▲
- USO 140.92 Bearish -1.14% ▼
- NVDA 215.33 Bearish -1.90% ▼
- IBIT 42.96 Bearish -2.36% ▼
Major Index ETFs: SPY, QQQ, DIA, IWM, IJH
- IWM 285.12 Bullish 0.93% ▲
- IJH 73.50 Bullish 0.82% ▲
- DIA 506.12 Bullish 0.60% ▲
- QQQ 717.54 Bullish 0.42% ▲
- SPY 745.64 Bullish 0.39% ▲
Bullish tone across the index ETF basket, led by IWM at +0.93% as the most bullish mover, followed by IJH at +0.82% and DIA at +0.60%; QQQ at +0.42% and SPY at +0.39% were the least positive movers, keeping the group broadly firm but modest in magnitude.
Mag 7 Stocks: AAPL, MSFT, GOOG, AMZN, META, NVDA, TSLA
- TSLA 426.01 Bullish 1.95% ▲
- AAPL 308.82 Bullish 1.26% ▲
- META 610.26 Bullish 0.47% ▲
- MSFT 418.57 Bearish -0.12% ▼
- AMZN 266.32 Bearish -0.80% ▼
- GOOG 379.38 Bearish -1.07% ▼
- NVDA 215.33 Bearish -1.90% ▼
Mag7 is Mixed: TSLA leads the group with +1.95%, followed by AAPL at +1.26% and META at +0.47%; MSFT is near-flat at -0.12%, while AMZN at -0.80%, GOOG at -1.07%, and NVDA at -1.90% show the downside, with NVDA the most bearish mover.
Cross-Market ETFs: TLT, GLD, USO, IBIT
- TLT 84.68 Bullish 0.55% ▲
- GLD 413.82 Bearish -0.76% ▼
- USO 140.92 Bearish -1.14% ▼
- IBIT 42.96 Bearish -2.36% ▼
Mixed cross-market tone: TLT was the most bullish mover at +0.55%, while IBIT was the most bearish mover at -2.36%. GLD also moved lower at -0.76%, and USO was down -1.14%.
ETF, Mag7, and Cross-Market ETF Insights
Overall Tone
Mixed to mildly Bullish, with equities holding up but leadership rotating and cross-market risk cues staying uneven.
Equity ETFs and Mag7:
Major index ETFs were broadly Bullish but modest, led by IWM +0.93% and IJH +0.82%, while SPY +0.39% and QQQ +0.42% were near-flat. Mag7 performance was selective: TSLA was the most bullish mover at +1.95%, followed by AAPL +1.26% and META +0.47%, while NVDA was the most bearish mover at -1.90%, with GOOG -1.07% and AMZN -0.80% also lower. Overall, equities were not fully aligned, with small- and mid-cap ETFs firmer than large-cap growth and chip leadership.
Cross-Market ETFs:
Cross-market flows were Mixed and more defensive than equities, with TLT up +0.55% and GLD down only modestly at -0.76%. USO was the most bearish mover in the group at -1.14%, and IBIT was the most bearish overall at -2.36%. Compared with the equity tape, these moves show commodity and crypto weakness alongside a mild bid in Treasuries, while hedging demand in gold remained limited.
Futures Indices – Higher Time Frame Analysis
Summary of the current state of US Indices Futures based on higher time-frame (HTF) technical analysis as of: 2026-05-26: 07:16 CT.
US Indices Futures
- ES, YSFG/MSFG/WSFG above F0%, benchmarks stacked higher, pivots in UTrend, fresh highs, resistance above prior shelf, support at rising benchmark cluster.
- NQ, YSFG/MSFG/WSFG above F0%, benchmarks bullish and rising, pivots in UTrend, fresh highs near 29995, resistance at breakout highs, support at prior pullback zones.
- YM, YSFG/MSFG/WSFG above equilibrium, benchmarks stacked bullish, pivots in UTrend, new highs at 51209, resistance near upper yearly structure, support at rising averages.
- EMD, YSFG/MSFG above bias levels, WSFG constructive, benchmarks mostly bullish, pivots evolving higher, resistance 3737-3767, support at spring low recovery zone.
- RTY, YSFG/MSFG/WSFG above F0/NTZ, benchmarks fully stacked higher, pivots in UTrend, highs near 2922.7, resistance at recent swing high, support at breakout steps higher.
- FDAX, YSFG/MSFG/WSFG above midlines, benchmarks aligned higher, pivots in UTrend, resistance 25494-25854, support at rising benchmark and recovery zones.
Overall State
- Short-Term: Bullish
- Intermediate-Term: Bullish
- Long-Term: Bullish
Conclusion
ES, NQ, YM, RTY, and FDAX remain in synchronized higher-timeframe UTrend structures, with YSFG, MSFG, and WSFG generally above F0% or equilibrium and benchmark averages stacked higher. ES and NQ show the clearest upside expansion at fresh highs, YM confirms broad large-cap strength, RTY shows strong small-cap continuation, and FDAX remains aligned with the same trend-continuation profile. EMD is constructive on HTF but remains nearer short-term transition, with daily HiLo still neutral under resistance. Across the group, higher highs and higher lows, rising benchmark support, and breakout acceptance above prior resistance define the dominant HTF structure.
Note: Intra-day counter-trend pullbacks or retracements may occur, HTF is context for informational usage and market structure. Glossary: Session Fib Grids periods of YSFG:’Yearly’, MSFG:’Monthly’, WSFG:’Weekly’
For full details visit: AlphaWebTrader Technicals
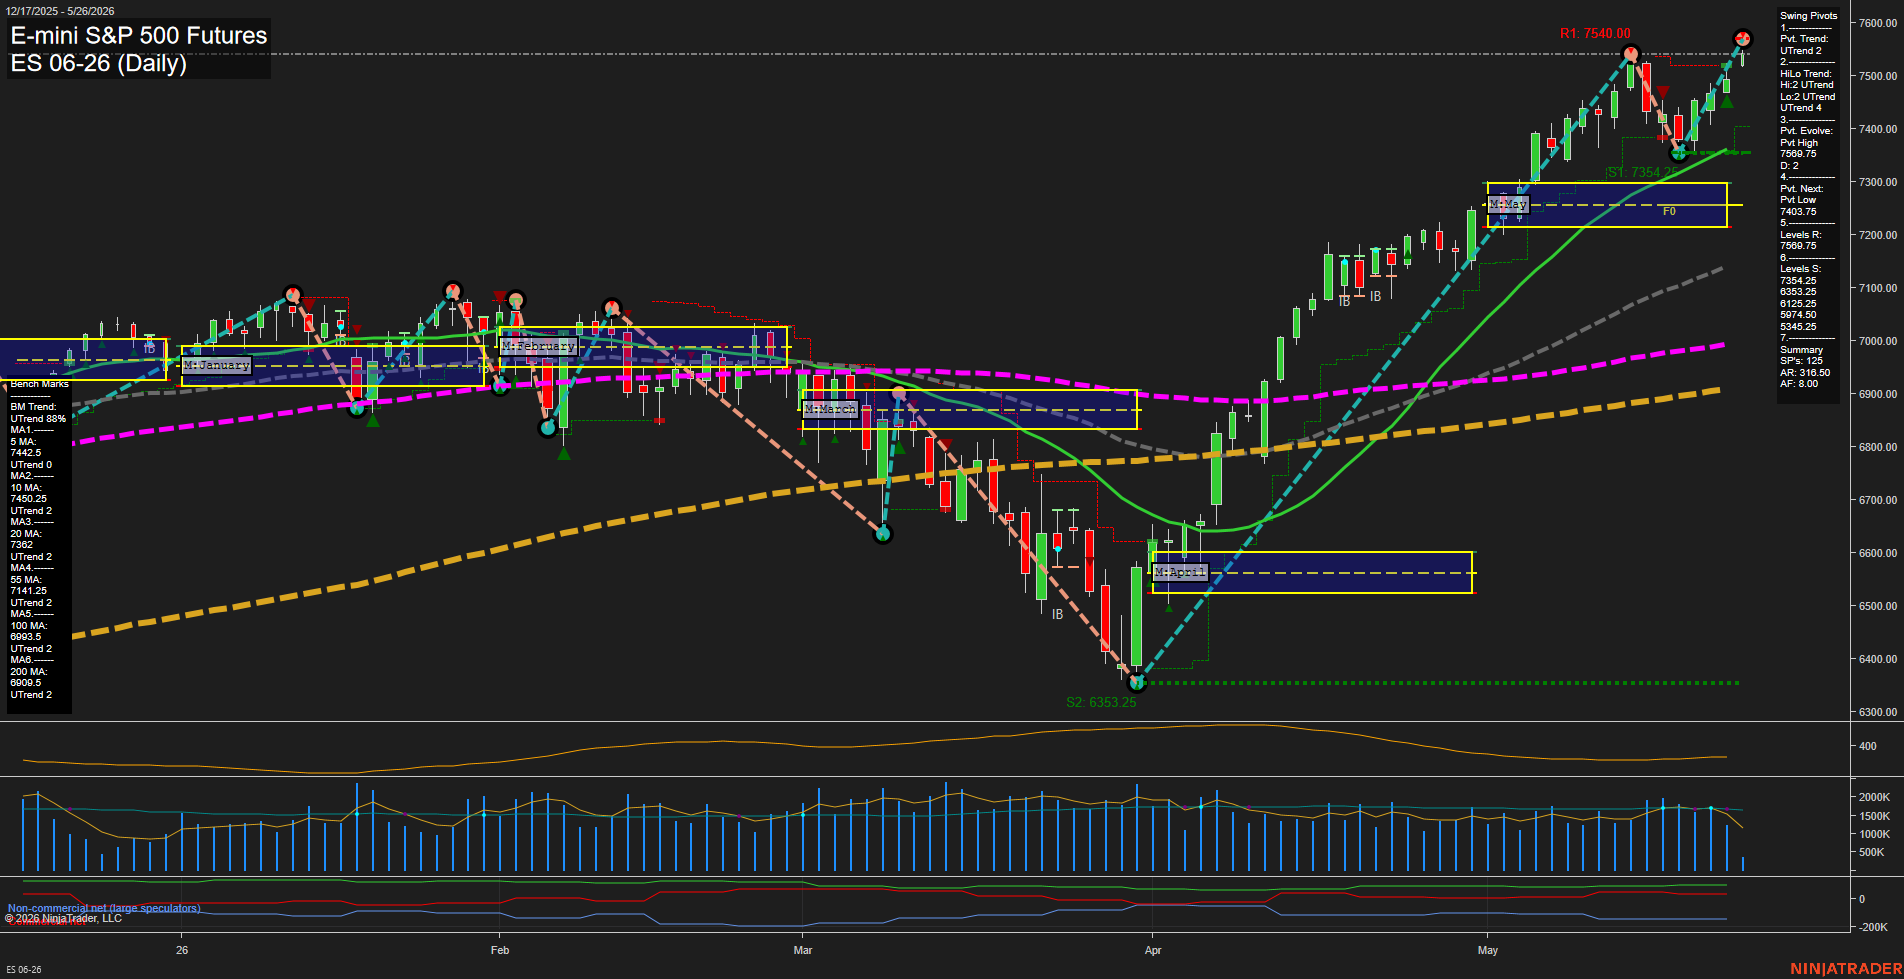
ES Daily View
Overall Rating
- Short-Term: Bullish
- Intermediate-Term: Bullish
- Long-Term: Bullish.
Key Insights Summary
The daily structure remains strongly constructive after the April base and May breakout, with price pressing new highs above all major benchmark averages and holding well above the weekly, monthly, and yearly fib grid midpoints. Swing pivots remain in UTrend, and the sequence of higher highs and higher lows confirms persistent upside continuation rather than a mean-reversion phase. Momentum is strong, bar expansion is large, and the recent push through the prior resistance shelf near the upper NTZ reflects a clean trend continuation with little sign of distribution. Longer-term context is also favorable, as the 55, 100, and 200-day benchmarks all slope higher beneath price, reinforcing a broad bullish trend regime.
View charts on: AlphaWebTrader HTF Charts
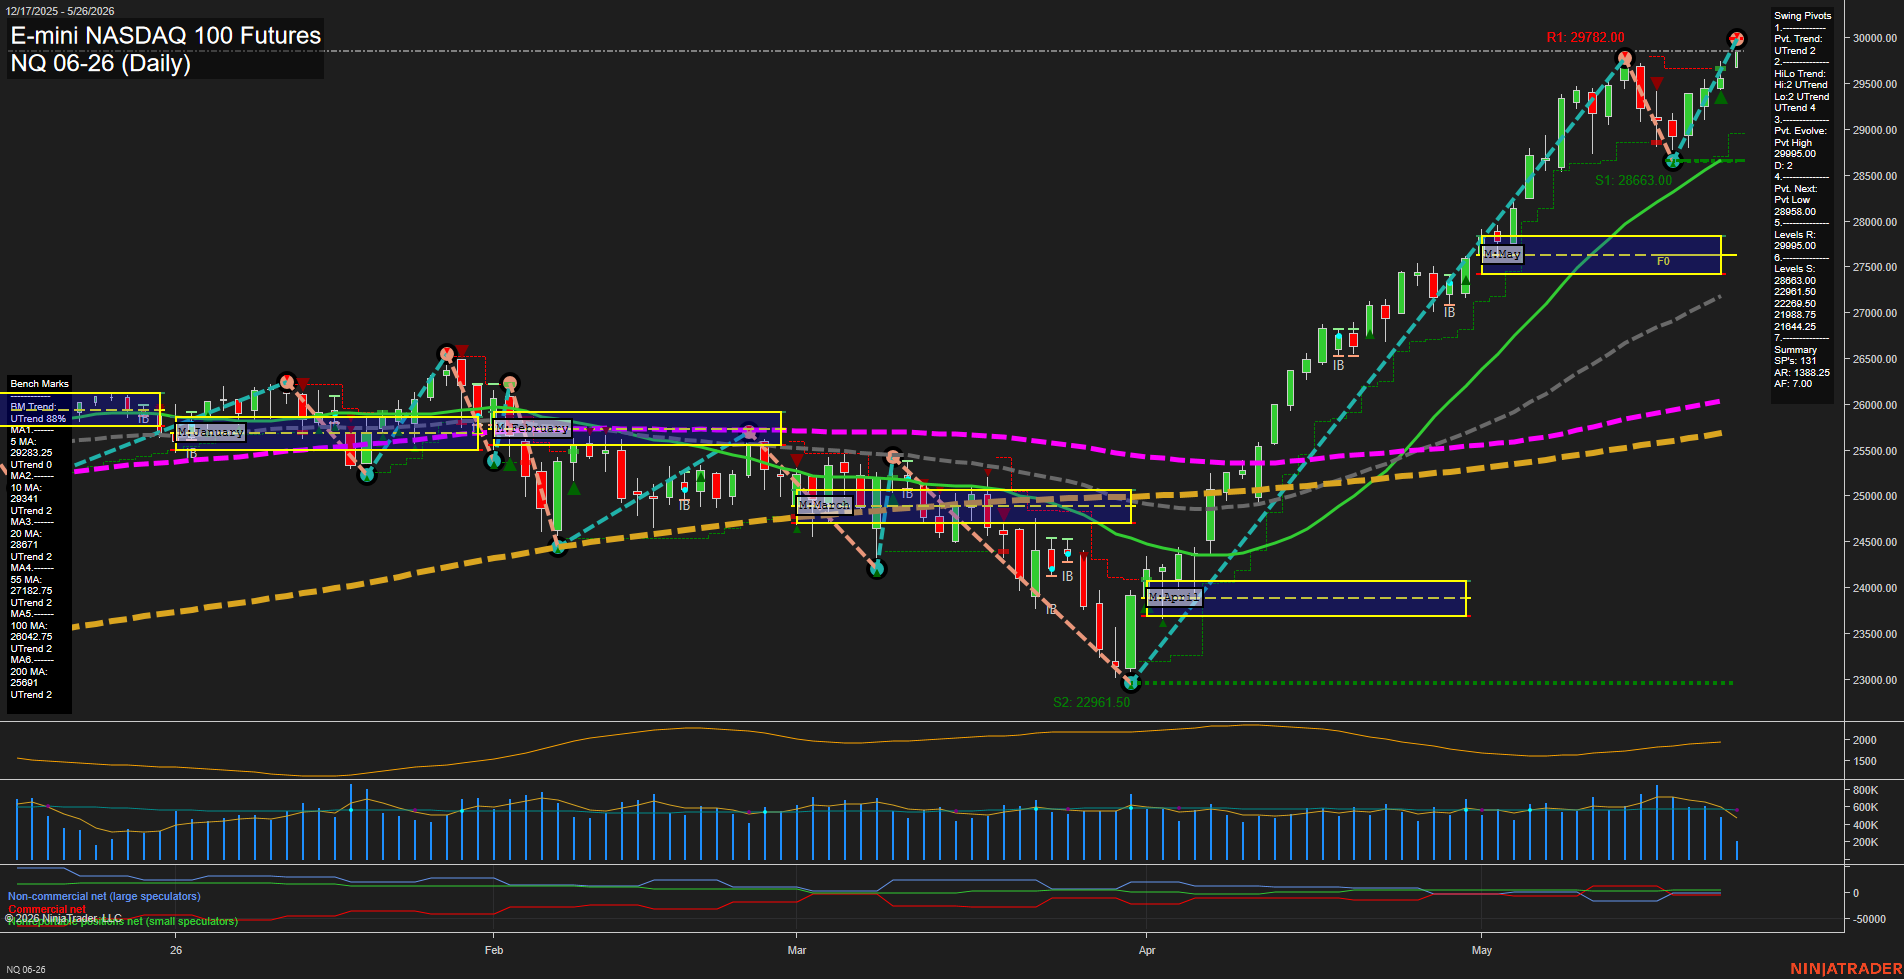
NQ Daily View
Overall Rating
- Short-Term: Bullish
- Intermediate-Term: Bullish
- Long-Term: Bullish.
Key Insights Summary
The daily structure remains in a strong upward swing with price pressing into fresh highs near 29995 after a powerful May advance. Swing pivot trend and HiLo trend are both aligned in UTrend, and price remains above the weekly, monthly, and yearly session fib grids, confirming broad upside control. All benchmark moving averages are rising or firmly supported below price, with the 20-day, 55-day, 100-day, and 200-day trends all pointing higher, reinforcing a mature but still intact uptrend. Recent candles show continued expansion near the highs, reflecting fast momentum and strong trend persistence after the April base and May breakout. The pattern is consistent with trend continuation, higher highs, and higher lows, with prior inside-bar pauses resolved back to the upside.
View charts on: AlphaWebTrader HTF Charts
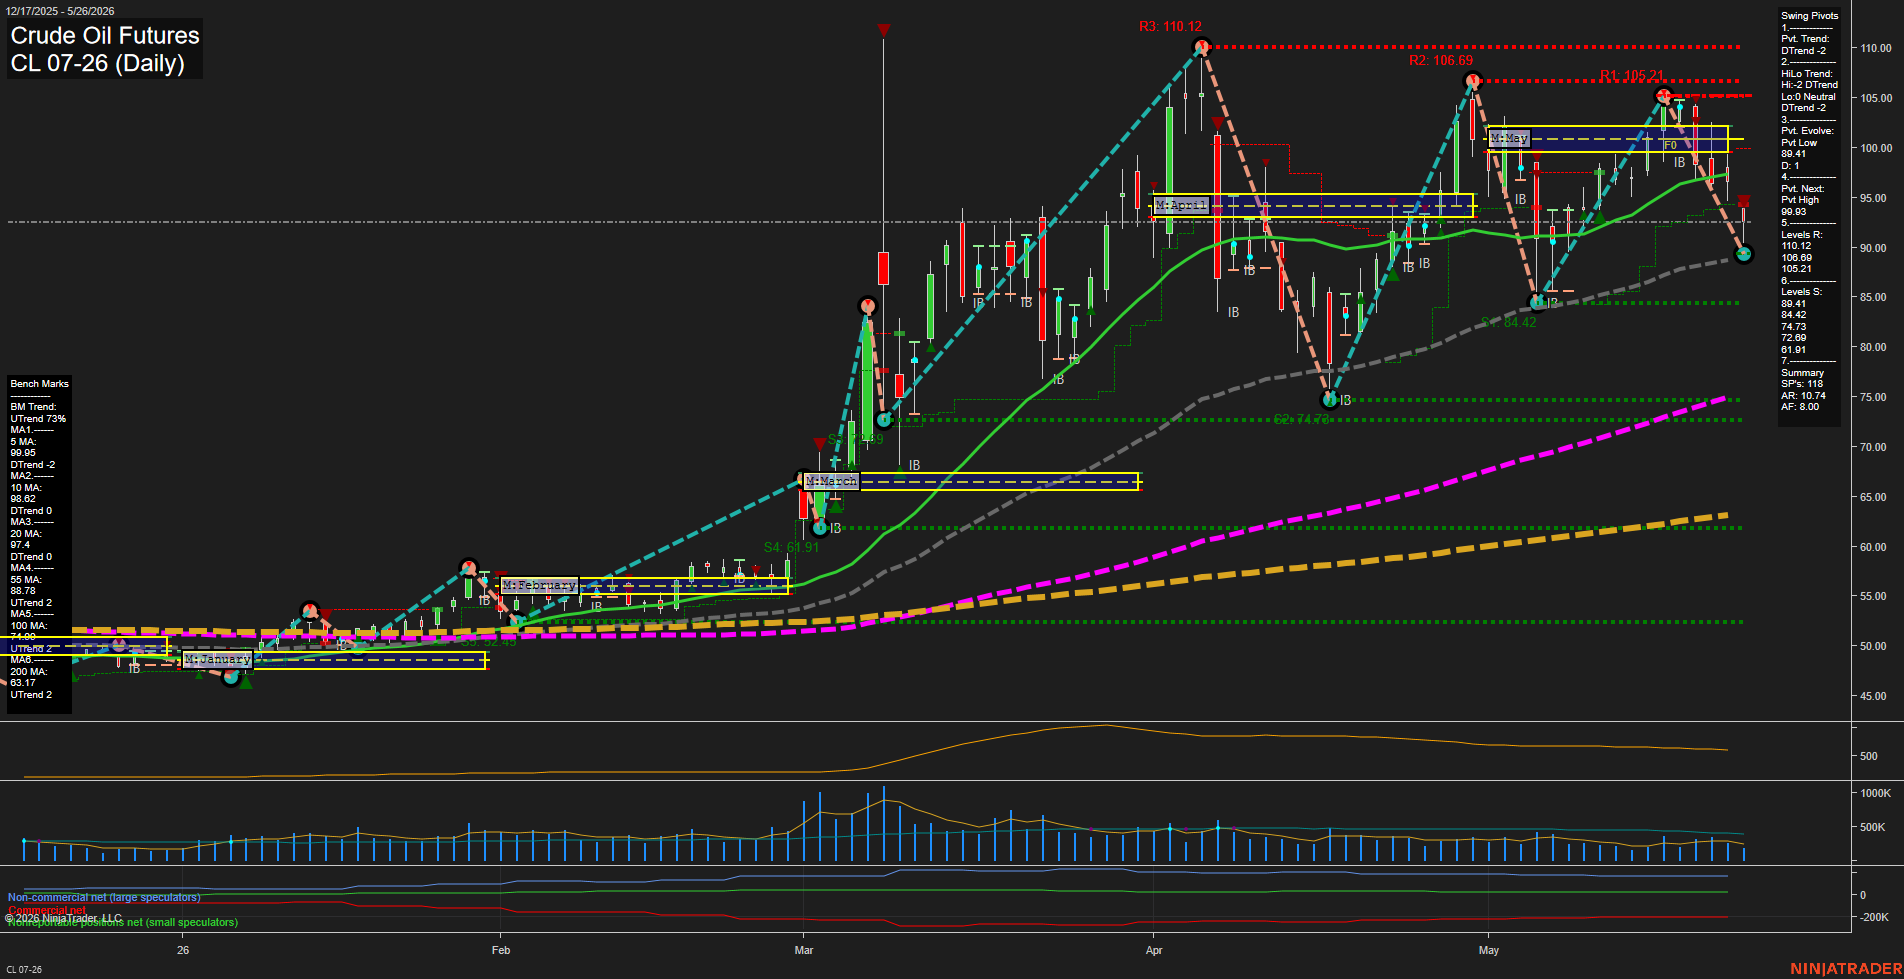
CL Daily View
Overall Rating
- Short-Term: Bearish
- Intermediate-Term: Bearish
- Long-Term: Bullish.
Key Insights Summary
Crude oil is pressing into a short-term bearish phase after a sharp selloff from the early-May rejection zone near 105-110, with the latest price sitting at the active pivot low area around 89.41. The daily structure shows a clear sequence of lower highs and lower lows in the near term, while the WSFG and MSFG both remain below their F0%/NTZ centers and are aligned downside. The swing pivot matrix also confirms DTrend across both short-term and intermediate-term measures, with the next upside pivot still well overhead near 99.93. Benchmarks are mixed: the 5/10/20-day averages are rolling over, but the 55/100/200-day averages remain in broader uptrend alignment, keeping the long-term backdrop constructive despite the recent weakness. The chart reflects a large-range, high-volatility swing environment with repeated tests and rejections across the 99-105 supply band and a current focus on whether the 89-84 support zone holds or gives way into a deeper retracement.
View charts on: AlphaWebTrader HTF Charts
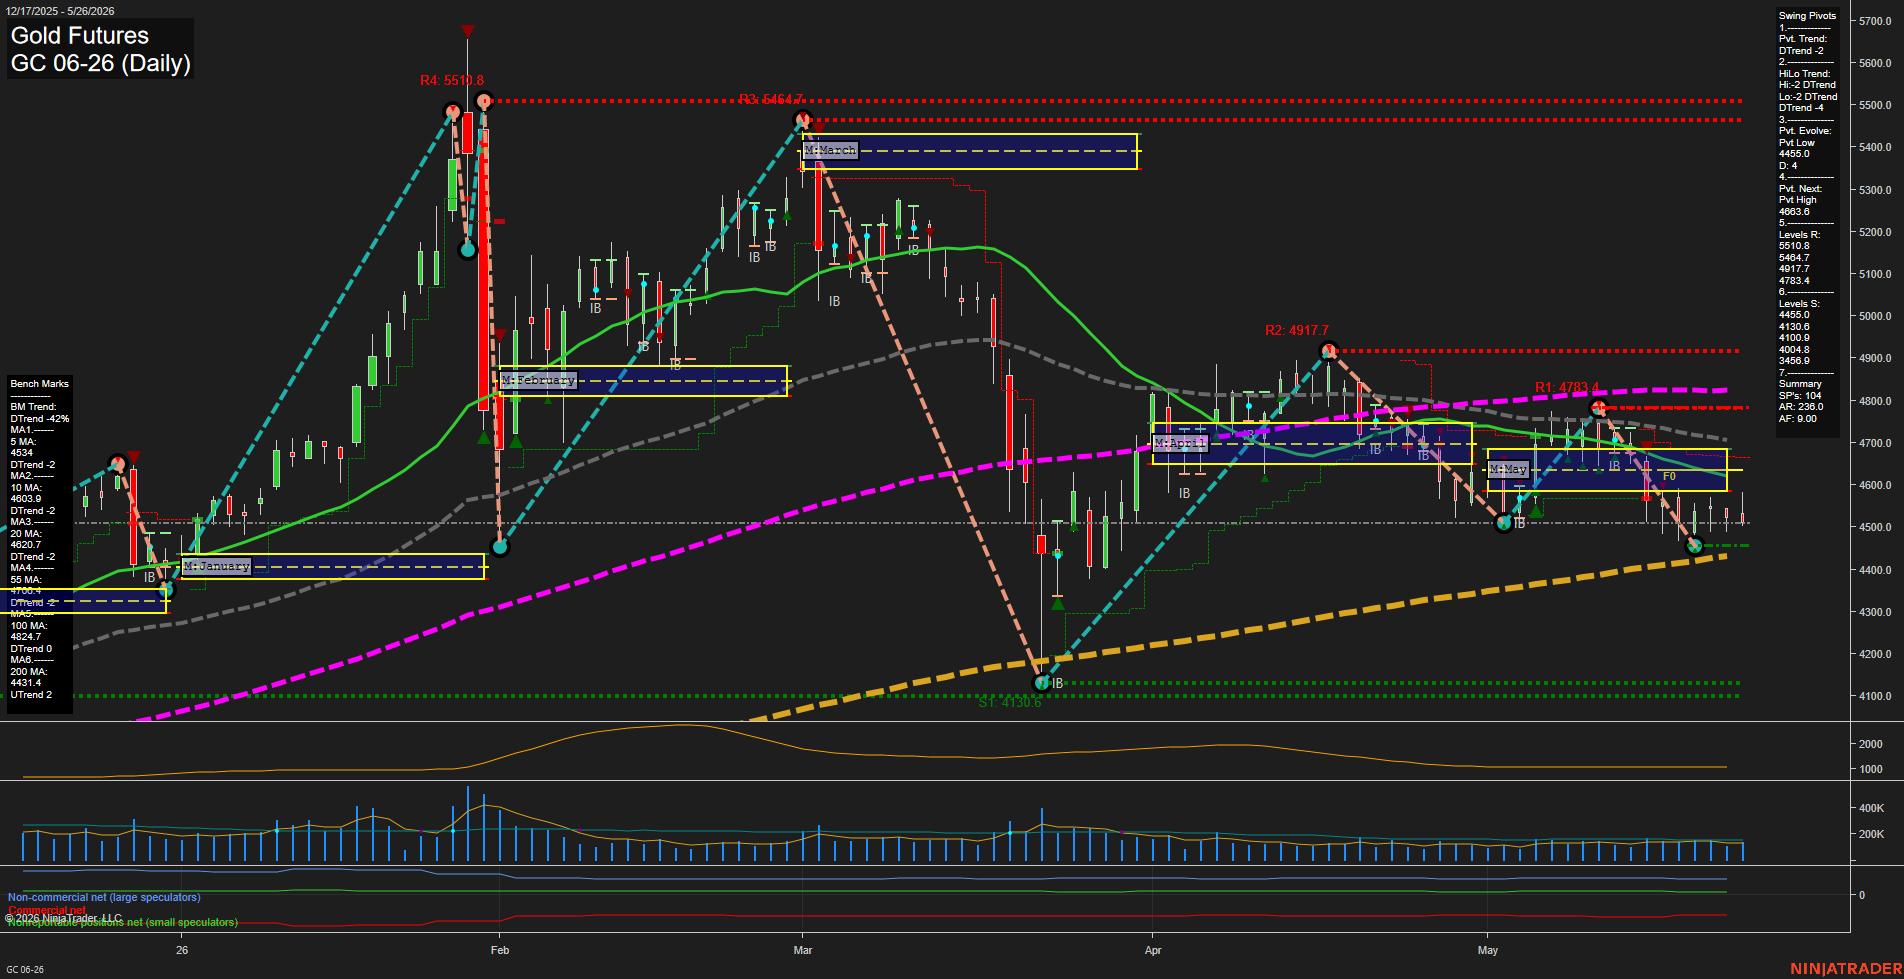
GC Daily View
Overall Rating
- Short-Term: Bearish
- Intermediate-Term: Bearish
- Long-Term: Neutral.
Key Insights Summary
Gold futures are in a broad downtrend with price trading below the weekly, monthly, and yearly session Fib grid midpoint zones, and the pivot structure remains aligned to the downside with lower highs and lower lows. The recent rebound failed to sustain above the upper pivot resistance cluster, while the market is now rotating back toward the 4455 support area and the 200-day benchmark neighborhood. Momentum is subdued relative to the prior swing expansion, and the daily structure shows a corrective retracement inside a larger bearish sequence rather than a clean reversal. Volume has moderated versus prior spikes, matching a more compressed, rotational tape after the prior selloff and rebound phases.
View charts on: AlphaWebTrader HTF Charts