S&P 500, Nasdaq, Dow, Russell 2000, emerging-market and DAX futures face a pivotal week of Fed, inflation, Big Tech earnings and Hormuz risks.
Fundamentals: Index futures begin a data-heavy week shaped by the Federal Reserve decision, GDP, Core PCE and wage data, alongside earnings from Microsoft, Meta, Apple and Amazon. Markets are also monitoring Strait of Hormuz developments, oil supply risks, Treasury yields and technical weakness in the S&P 500, while heightened KOSPI swings highlight broader equity sensitivity.
Technicals: U.S. index futures enter Sunday with short-term weakness across the S&P 500 and Nasdaq, while longer-term moving-average and pivot structures remain broadly constructive. Dow and Russell 2000 futures show mixed intermediate conditions, emerging markets retain bullish alignment, and DAX futures are managing a sharp pullback within a larger uptrend.
Market Week Ahead – Trading 360° view Market Radar for: holidays, earnings, eco-news, market-news summary, news sentiment, and major ETFs, MAG7, Higher Time Frame Analysis Indices Futures Summary, and ETF SPY S&P500, QQQ Tech, USO Oil, GLD Gold Weekly Chart analysis
As of: July 26, 2026 06:15 CT
Earnings Radar
Monitoring for earnings releases by the Magnificent 7, AI-tech-related firms, and major financial institutions.
- AAPL Release: 2026-07-30 T:AMC
- AMZN Release: 2026-07-30 T:AMC
- META Release: 2026-07-29 T:AMC
- MSFT Release: 2026-07-29 T:AMC
Conclusion: S&P 500 and Nasdaq futures face concentrated earnings-event risk from MSFT and META after the July 29 close, followed by AAPL and AMZN after the July 30 close. Market momentum and volume can slow ahead of these major tech releases, with index repricing concentrated in post-close and following-session reactions.
For full details visit: Yahoo Earnings Calendar
EcoNews Radar U.S. Events
| Day | Time | Impact | Event |
|---|---|---|---|
| Tue | 10:00 | Medium | CB Consumer Confidence |
| Wed | 10:30 | Low | Crude Oil Inventories |
| Wed | 14:00 | High | Federal Funds Rate |
| Wed | 14:00 | High | FOMC Statement |
| Wed | 14:30 | High | FOMC Press Conference |
| Thu | 08:30 | High | Advance GDP q/q |
| Thu | 08:30 | High | Core PCE Price Index m/m |
| Thu | 08:30 | Medium | Advance GDP Price Index q/q |
| Thu | 08:30 | Medium | Unemployment Claims |
| Fri | 08:30 | Medium | Employment Cost Index q/q |
| Fri | 10:00 | Medium | Revised UoM Consumer Sentiment |
| Fri | 10:00 | Medium | Revised UoM Inflation Expectations |
EcoNews Summary
The week centers on Wednesday’s Federal Reserve policy decision and communications, followed by Thursday’s Advance GDP and Core PCE inflation data. These releases provide key context on monetary policy, economic growth, and inflation conditions for index futures markets.
Event Notes:
- Wednesday 14:00 – Federal Funds Rate: The Federal Reserve’s policy-rate decision. Traders monitor the decision for changes in the benchmark rate and the monetary-policy stance affecting financing conditions, valuations, and economic activity.
- Wednesday 14:00 – FOMC Statement: The Federal Open Market Committee’s written policy announcement. It details the policy decision, economic assessment, and forward guidance language that shapes interpretation of the rate decision.
- Wednesday 14:30 – FOMC Press Conference: The Federal Reserve Chair’s press conference following the policy announcement. Questions and remarks provide additional context on the Committee’s outlook, inflation assessment, and policy framework.
- Thursday 08:30 – Advance GDP q/q: The first estimate of quarterly U.S. gross domestic product growth. It measures the pace of broad economic activity and is monitored for evidence on growth momentum.
- Thursday 08:30 – Core PCE Price Index m/m: A monthly inflation measure excluding food and energy components. It is monitored as a measure of underlying consumer-price pressures within the Federal Reserve’s preferred inflation framework.
Conclusion:
The single most important event is Wednesday’s 14:00 Federal Funds Rate decision, supported by the FOMC Statement and 14:30 press conference. Market momentum and volume often slow ahead of major FOMC, PCE, and GDP releases, with increased volatility at release time. Thursday’s GDP and Core PCE data then add growth and underlying inflation context after the Federal Reserve communications.
For full details visit: Forex Factory EcoNews
Market News Summary:
Index futures enter a data-heavy week amid Hormuz tensions, rate sensitivity, technical weakness, and major technology earnings.
Primary Drivers & Risks:
- Primary Driver: Fed, macro data, and tech earnings
- Primary Risk: Hormuz disruption and equity volatility
Tone:
Cautious, with geopolitical and policy-event sensitivity.
Stock Market / ETFs / Indices:
The S&P 500 fell 0.79% following the Strait of Hormuz blockade, while a technical report cited a break below support near 7,420 and new monthly lows. Korea’s KOSPI has shown unusually large swings, linked to index concentration and retail use of leveraged ETFs. U.S. stock sentiment also faces earnings from Microsoft, Meta, Apple, and Amazon.
Geopolitical:
Military action and the Hormuz blockade have increased market unease. Iran peace talks continue, while potential tariffs add another source of uncertainty.
Oil / Energy:
WTI and Brent face elevated supply-risk attention because of Hormuz and Red Sea tanker traffic. Separate gold-market coverage noted that crude had eased after its prior advance.
Gold / Metals:
Gold paused after a sharp decline as rising rate-hike odds supported the dollar and weighed on bullion. FOMC communications, oil, Treasury yields, Core PCE, and wage data are central inputs for gold’s five-week trading range.
Fed / Financials:
A stronger-than-anticipated U.S. economy has reinforced higher-for-longer rate concerns. The Fed’s midweek decision, Core PCE, GDP, and wage data are key scheduled market events; rising yields and dollar strength have pressured gold.
Macro / Other:
Retirement-focused coverage highlighted concern over portfolio vulnerability to an ill-timed market decline among underfunded Gen X investors approaching retirement.
Conclusion:
Fed policy, U.S. inflation and growth data, and major technology earnings are the principal scheduled drivers for index futures. Hormuz-related developments remain a major cross-asset catalyst.
Technical weakness in the S&P 500 and extreme KOSPI volatility underscore elevated equity sensitivity. Crude supply concerns, higher-rate expectations, and tariff uncertainty remain important cross-currents.
Market News Sentiment
Market News Articles: 8
- Neutral: 62.50%
- Negative: 37.50%
Sentiment Summary: Market news sentiment is 63% neutral and 38% negative across 8 articles, indicating limited positive coverage.
Conclusion: The news flow is predominantly neutral with a notable negative component for indices futures day traders.
GLD,Gold Articles: 2
- Negative: 50.00%
- Neutral: 50.00%
Sentiment Summary: Gold-related coverage was evenly split between negative and neutral sentiment, with 50% each across 2 articles.
Conclusion: The snapshot indicates no positive sentiment signal from gold coverage for indices futures day traders.
USO,Oil Articles: 2
- Negative: 50.00%
- Neutral: 50.00%
Sentiment Summary: USO and oil coverage is evenly split, with 50% negative and 50% neutral sentiment across 2 articles.
Conclusion: Oil-related news tone is balanced between negative and neutral, providing no clear directional sentiment signal for indices futures.
SPY Weekly View
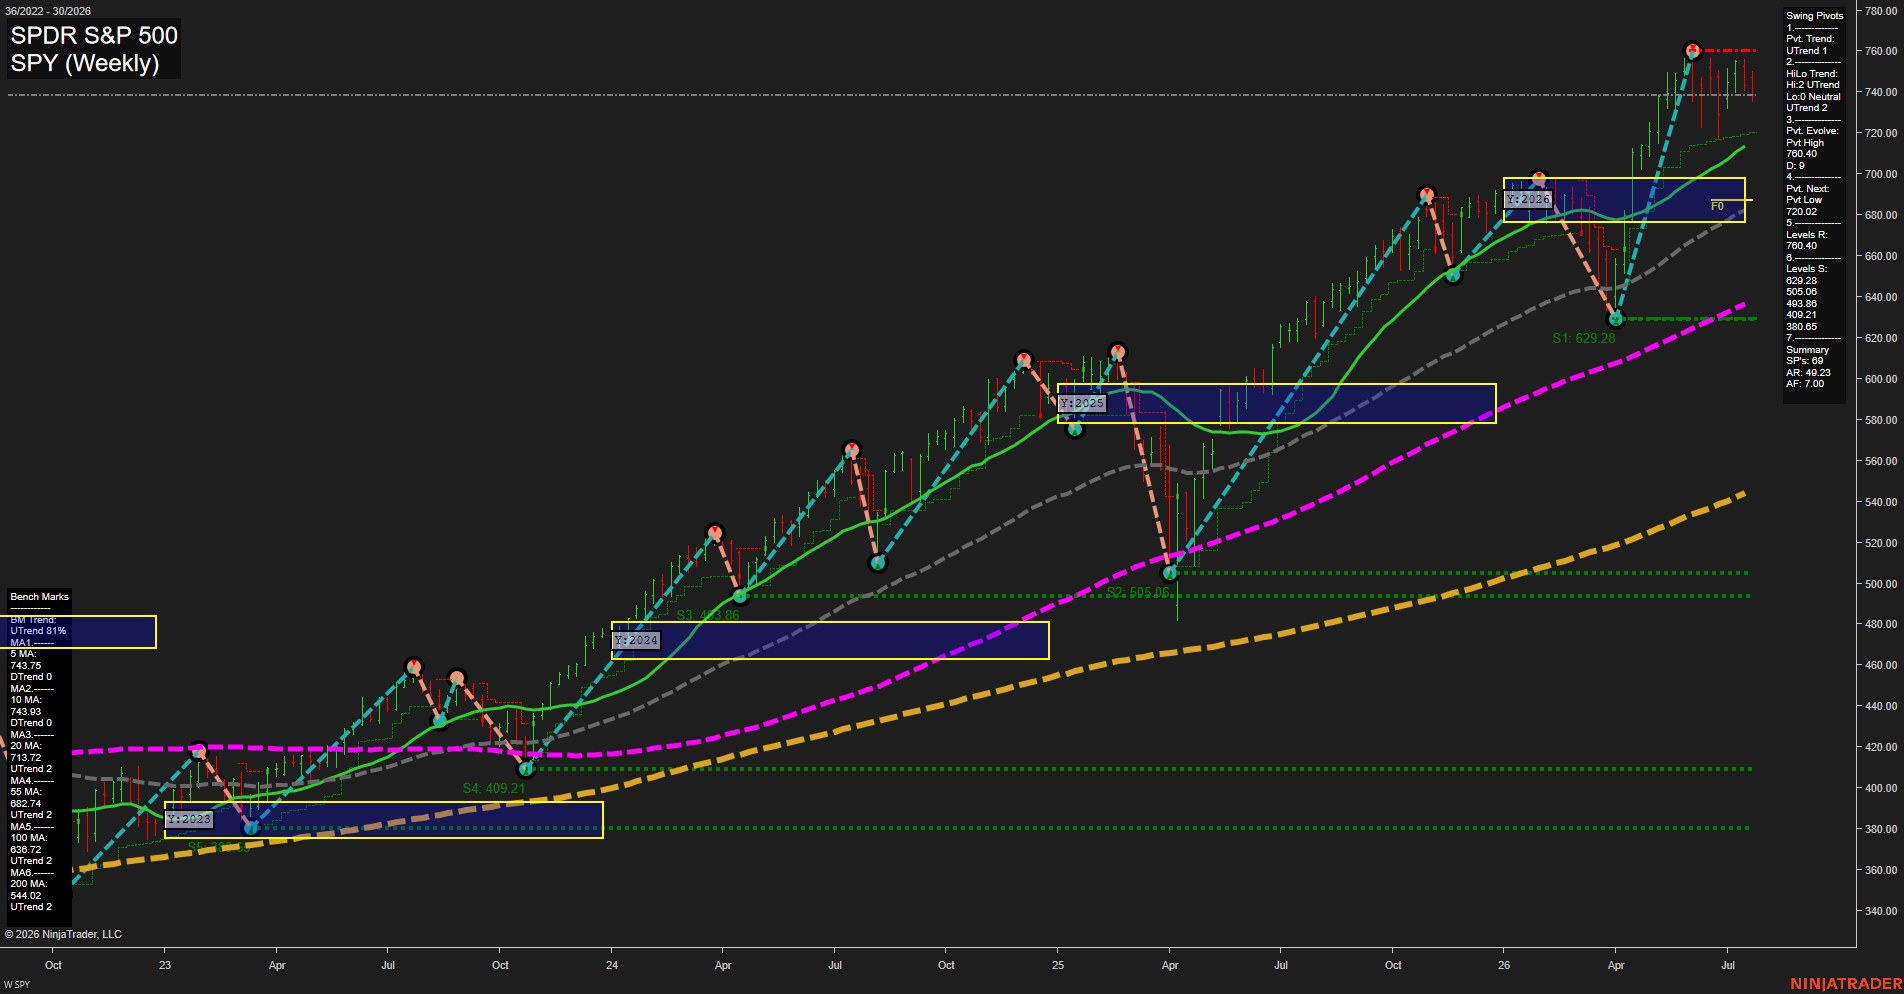
Overall Rating
- Short-Term: Neutral
- Intermediate-Term: Bullish
- Long-Term: Bullish.
Key Insights Summary
Weekly structure remains broadly constructive for an index-futures swing-trader perspective: price is consolidating beneath the 760.40 pivot-high resistance after a sharp recovery from the 629.28 swing low. The small weekly bars and declining 5- and 10-period benchmarks characterize short-term compression and slower momentum, while price remains materially above rising 20-, 55-, 100-, and 200-period benchmarks. The intermediate and major trends retain higher-high and higher-low characteristics; 720.02 defines the nearby pivot-reversal threshold, with 760.40 marking the dominant overhead test level.
View charts on: AlphaWebTrader HTF Charts
QQQ Weekly View
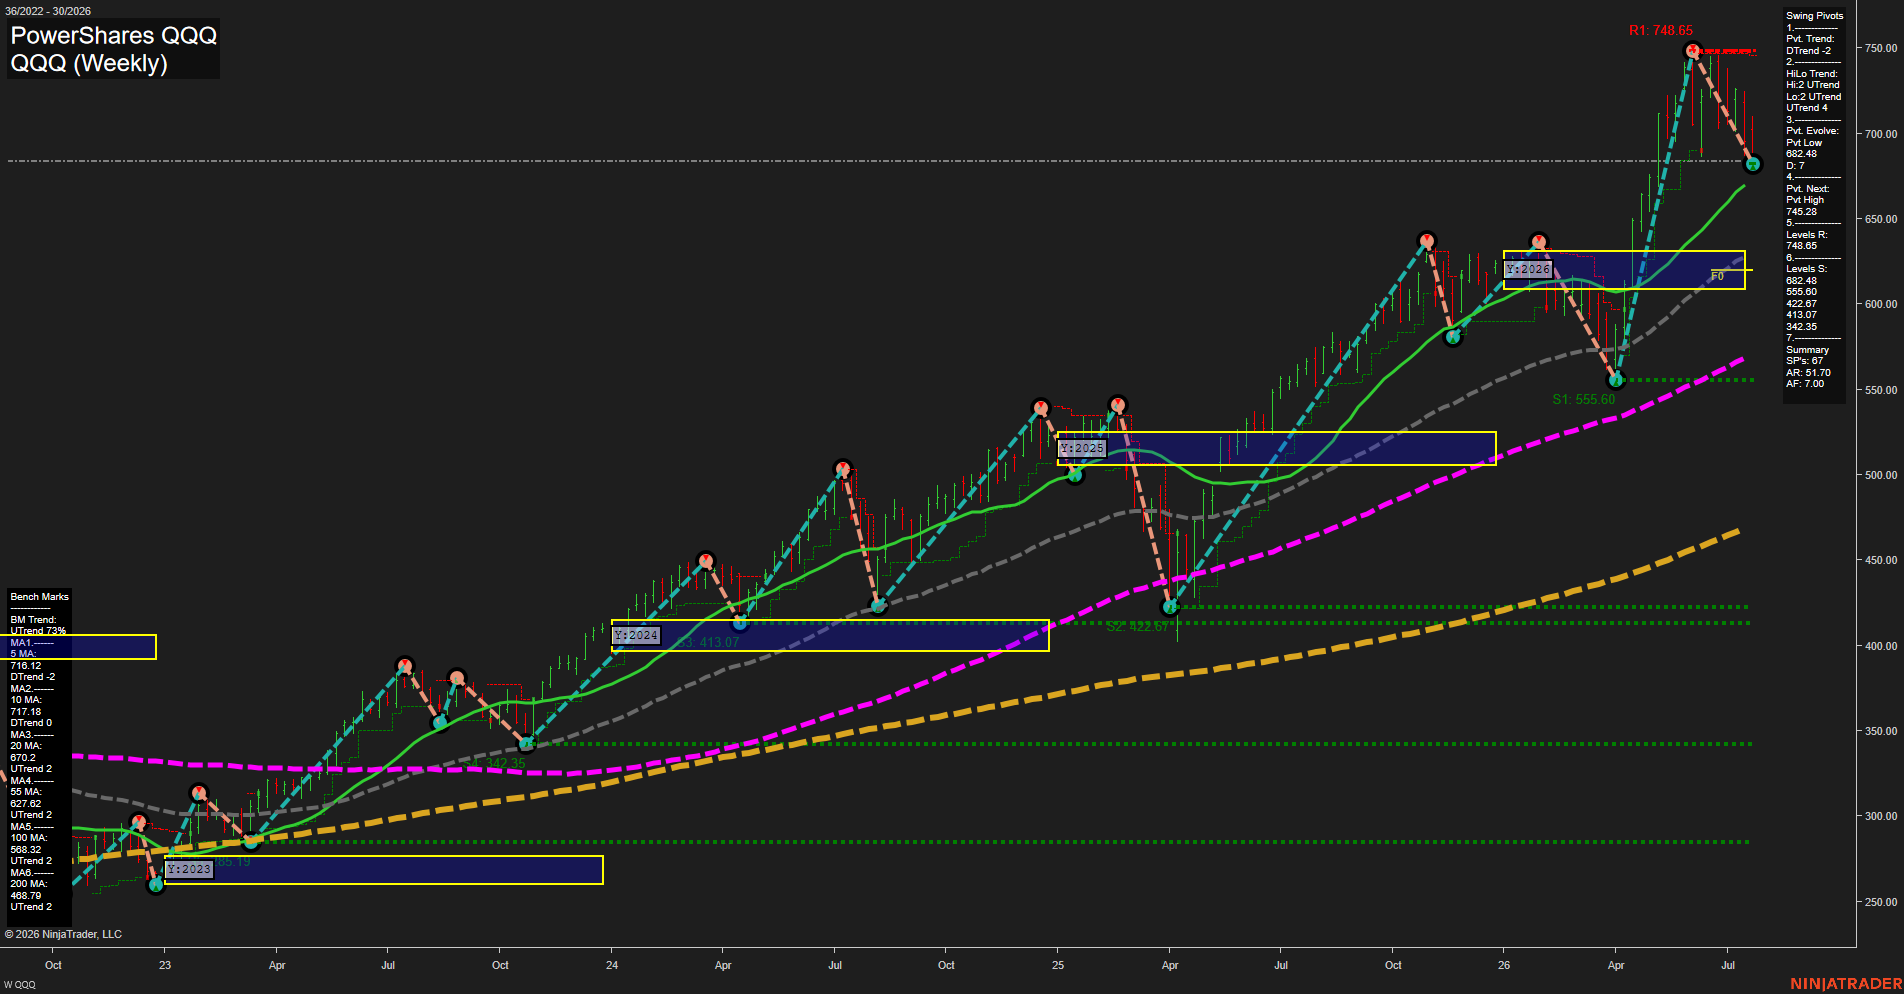
Overall Rating
- Short-Term: Bearish
- Intermediate-Term: Bullish
- Long-Term: Bullish.
Key Insights Summary
QQQ’s futures-equivalent swing structure is in a short-term corrective phase following rejection from the 748.65 pivot high. The current 682.48 pivot low is the immediate structural reference, while the declining 5- and 10-week benchmarks confirm near-term downside momentum. Intermediate and long-term structure remains constructive: the higher-high/higher-low trend is intact, price remains above rising 20-, 55-, 100-, and 200-week benchmarks, and the yearly grid position remains above its NTZ. The chart reflects a volatile retracement within a broader bullish cycle, with 745.28-748.65 defining the overhead swing-resistance zone and 670.55, then 627.62, marking major moving-average reference levels beneath price.
View charts on: AlphaWebTrader HTF Charts
USO Weekly View
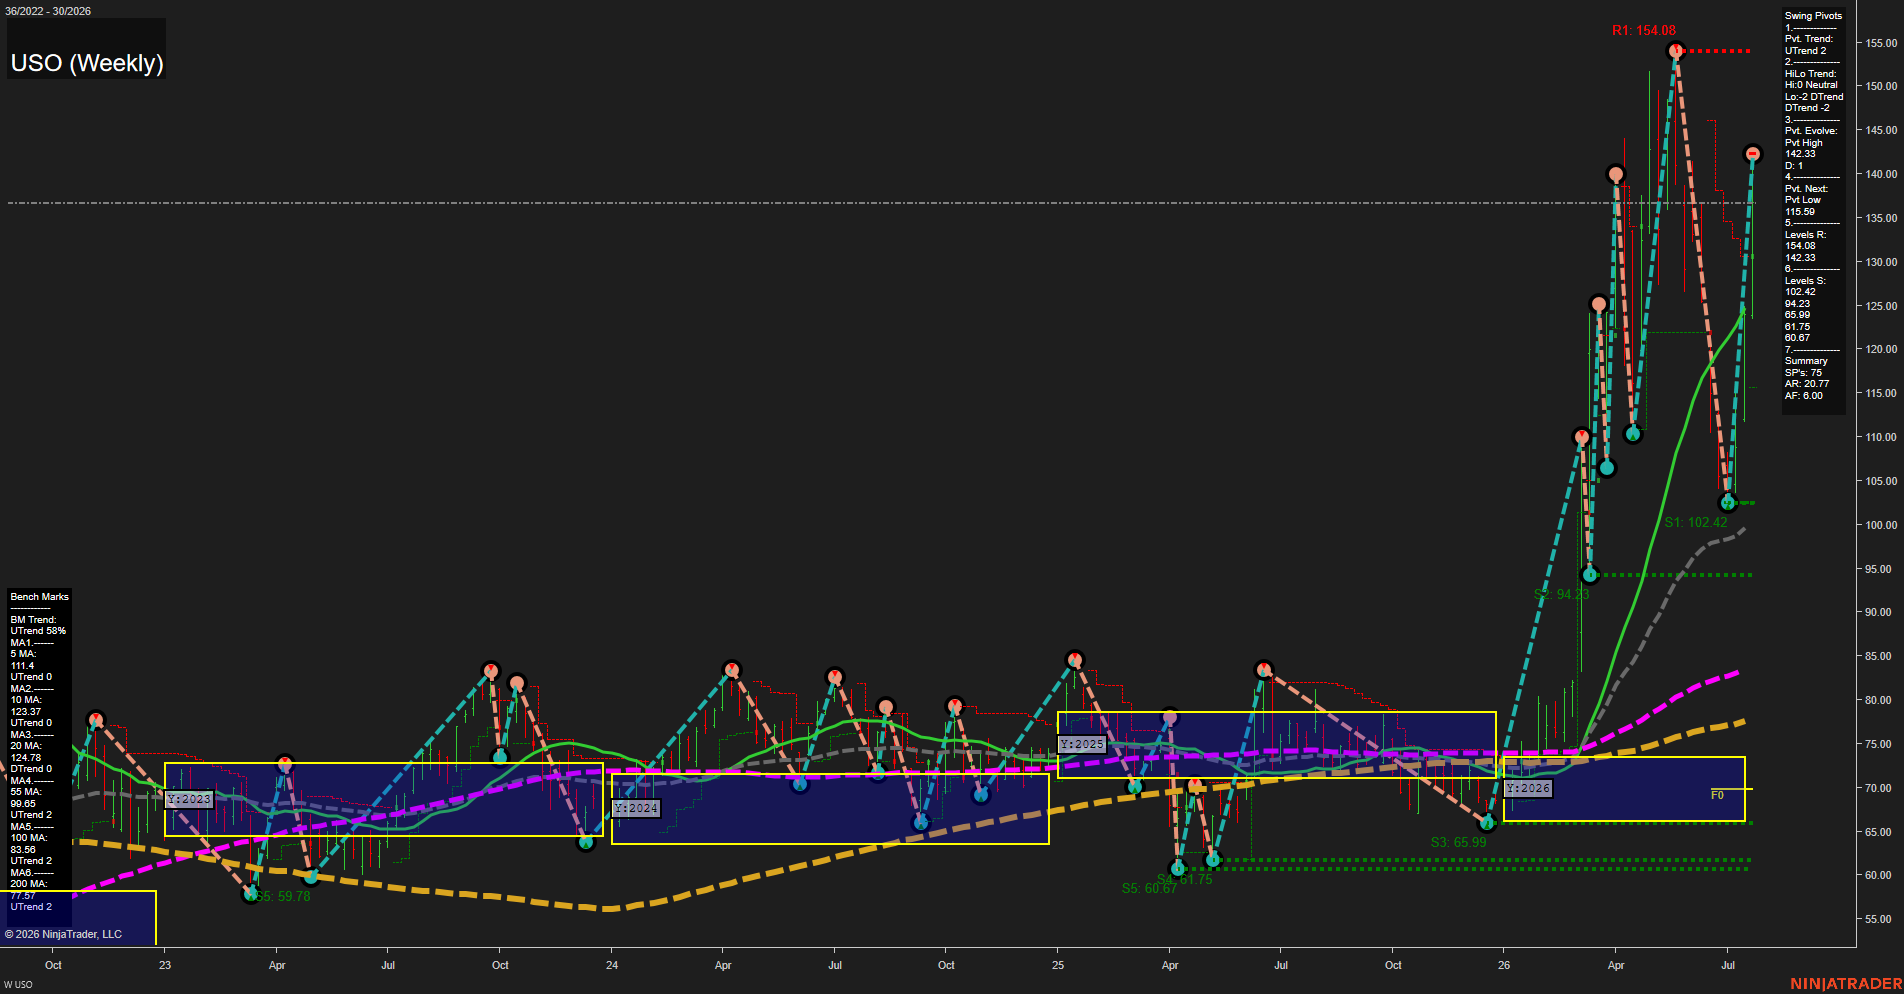
Overall Rating
- Short-Term: Bullish
- Intermediate-Term: Bullish
- Long-Term: Bullish.
Key Insights Summary
USO displays an exceptionally strong, high-volatility upside expansion from the 2026 yearly NTZ near the low-70s. Price is materially extended above every weekly benchmark and has established a short-term UTrend, although the intermediate HiLo structure remains DTrend following the sharp April-to-May retracement. The recent recovery is V-shaped and has reclaimed the 20, 55, 100, and 200-week benchmarks. The 142.33 pivot high is the immediate structural ceiling, with 154.08 the higher resistance level; 115.59 is the pivot-reversal reference, while 102.42 and 94.23 define the principal lower support zone.
View charts on: AlphaWebTrader HTF Charts
GLD Weekly View
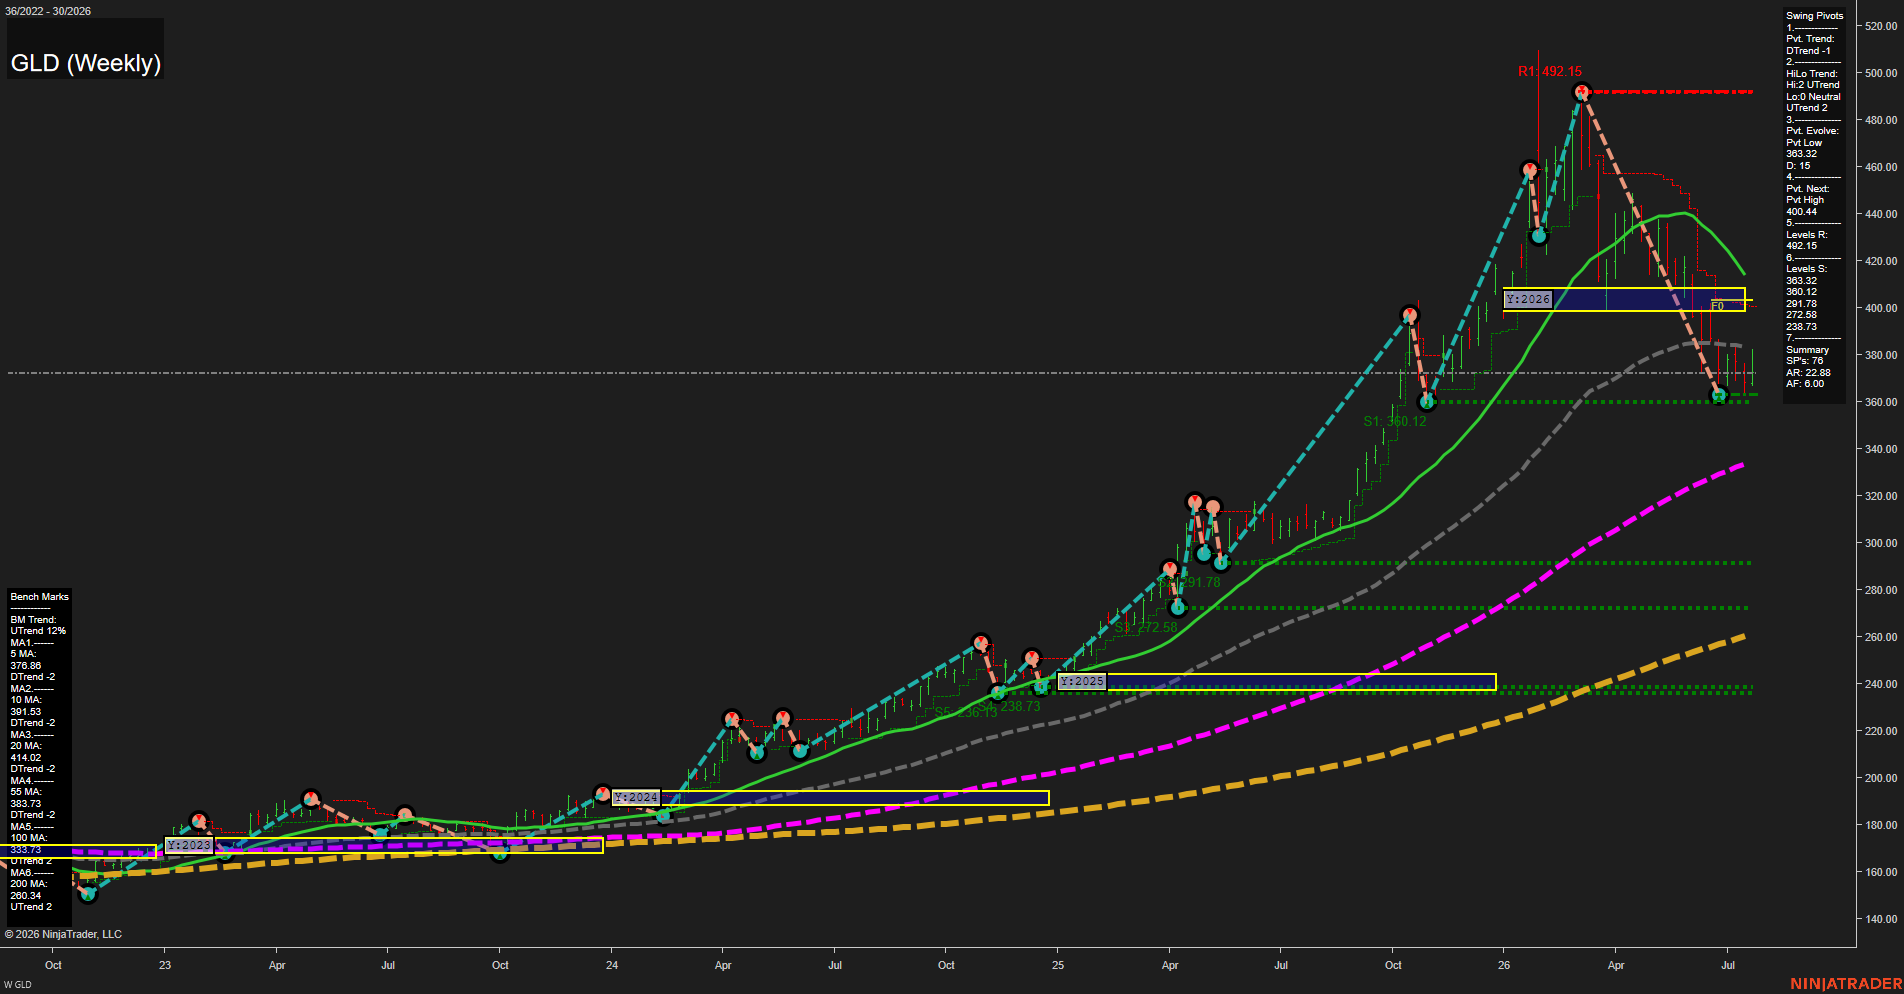
Overall Rating
- Short-Term: Bearish
- Intermediate-Term: Neutral
- Long-Term: Bullish.
Key Insights Summary
GLD reflects a sharp futures-style corrective swing from the 492.15 pivot high into the 360.12 support area, followed by a volatile rebound to 373.52. Short-term structure remains bearish: price is below the declining 5-, 10-, and 20-week benchmarks, the active pivot trend is DTrend, and 400.44 defines the next pivot-high reversal threshold. Intermediate structure is mixed, with the HiLo trend still UTrend and the 55-week benchmark rising, but price remains beneath that average. The broader bull-cycle structure remains intact above rising 100- and 200-week benchmarks, while the yearly Fib grid has shifted to a below-NTZ position. The current pattern is a high-volatility pullback within a larger uptrend, with 360.12 as the key swing-low reference and 400.44 followed by 492.15 defining the overhead recovery structure.
View charts on: AlphaWebTrader HTF Charts