NYSE pre-market radar tracks ETF movers and futures across major indices as record highs, AI leadership, China rules, oil and Fed focus shape sentiment.
Fundamentals: NYSE pre-market action is set against record highs in the S&P 500 and Nasdaq, supported by AI-led leadership, positive earnings momentum, and higher index targets from major banks. At the same time, China AI regulation concerns, Middle East tensions, oil-price swings, and Fed-linked inflation focus keep event risk elevated.
Technicals: NYSE pre-market radar summarizes prior-session ETF movers and current futures structure across ES, NQ, YM, RTY, and FDAX. The setup shows broad bullish alignment in several indices, with benchmark averages stacked higher and pivot trends still constructive, while some areas remain mixed on the short-term session view.
Pre-Market Trading 360° view Market Radar of: holidays, earnings, eco-news, market-news summary, news sentiment, prior session major ETFs, MAG7, Higher Time Frame Analysis Indices Futures Summary, and E-mini S&P500, Nasdaq 100, NYMEX Crude, Gold Futures Daily Chart analysis.
As of: May 27, 2026 07:16 CT
Earnings Radar
Monitoring for earnings releases by the Magnificent 7, AI-tech-related firms, and major financial institutions.
- SNOW Release: 2026-05-27 T:AMC
- CRM Release: 2026-05-27 T:AMC
Conclusion: SNOW and CRM report after the close on 2026-05-27, adding a same-session catalyst for broad-market sentiment through software and large-cap tech exposure. Market momentum and volume can slow ahead of major earnings releases, especially in major tech names.
For full details visit: Yahoo Earnings Calendar
EcoNews Radar U.S. Events
| Day | Time | Impact | Event |
|---|---|---|---|
| Thu | 08:30 | High | Core PCE Price Index m/m |
| Thu | 08:30 | High | Prelim GDP q/q |
| Thu | 08:30 | Medium | Prelim GDP Price Index q/q |
| Thu | 08:30 | Medium | Unemployment Claims |
| Thu | 10:00 | Medium | New Home Sales |
| Thu | 12:00 | Low | Crude Oil Inventories |
EcoNews Summary
Thursday carries the week’s highest market focus with two high-impact U.S. releases at 08:30: Core PCE Price Index m/m, a key inflation gauge for consumer spending trends, and Prelim GDP q/q, the broad measure of economic growth. A 10:00 New Home Sales release adds a housing-sector read, while 12:00 Crude Oil Inventories provides a petroleum supply update that can influence energy-sensitive market sentiment.
Event Notes:
- Thursday 08:30 Core PCE Price Index m/m: Measures month-over-month changes in consumer prices excluding food and energy; traders monitor it because it is a key inflation input for policy expectations and rate-sensitive index pricing.
- Thursday 08:30 Prelim GDP q/q: Measures the initial estimate of quarterly economic growth; traders watch it for clues on overall demand, business activity, and the strength of the U.S. economy.
- Thursday 08:30 Prelim GDP Price Index q/q: Measures price changes within the GDP report; traders use it to separate growth from inflation pressures in the same release window.
- Thursday 08:30 Unemployment Claims: Measures the number of new filings for jobless benefits; traders monitor it for labor-market momentum and signs of changing economic conditions.
- Thursday 10:00 New Home Sales: Measures the annualized number of newly built homes sold; traders track it for housing-sector strength and its link to consumer demand and financing conditions.
- Thursday 12:00 Crude Oil Inventories: Measures weekly changes in U.S. crude stockpiles; traders watch it for petroleum supply shifts, energy-price pressure, and downstream inflation sentiment.
Conclusion:
Thursday is the most important day of the week, led by the 08:30 Core PCE Price Index m/m and Prelim GDP q/q releases. Market momentum and volume often slow ahead of major events such as PCE and GDP, with increased volatility at release time. The 10:00 New Home Sales update sits in the usual intraday catalyst window, and the 12:00 Crude Oil Inventories report remains relevant for energy and crude-supply headlines. The single most important event is Thursday 08:30 Core PCE Price Index m/m.
For full details visit: Forex Factory EcoNews
Market News Summary:
U.S. equities remain at record levels on AI strength, while China regulation fears, Middle East tensions, and energy-price swings add cross-currents for index futures.
Primary Drivers & Risks:
- Primary Driver: AI-led equity strength
- Primary Risk: Geopolitical and inflation shocks
Tone:
Constructive, but with elevated event risk.
Stock Market / ETFs / Indices:
The S&P 500 and Nasdaq closed at record highs, with positive breadth and AI optimism supporting the move. Goldman Sachs raised its S&P 500 target, Morgan Stanley pointed to buying opportunities, and large-cap chip names were notable leaders. China stocks fell on AI regulation fears, while market commentary also highlighted low cash allocations and record margin debt.
Geopolitical:
U.S.-Iran tensions and a fragile Middle East truce remained central market inputs. Headlines pointed to renewed hostilities, cease-fire concerns, and uncertainty around access through the Strait of Hormuz.
Oil / Energy:
Oil prices pulled back as traders assessed progress in U.S.-Iran talks and the prospect of reopening Hormuz. A strategist warned markets were underpricing energy supply risk, while another update noted strong U.S. production and healthy storage keeping energy prices tied to fundamentals.
Gold / Metals:
Gold rose on safe-haven flows tied to Middle East tensions, then later came under pressure as the truce reduced geopolitical risk premiums. Silver also softened, with both metals influenced by Fed signals and inflation data.
Fed / Financials:
Dallas Fed President Lorie Logan commented on the need to reduce oil and natural-gas use if Hormuz stays closed. Markets also remained focused on PCE inflation data and the Federal Reserve’s policy backdrop.
Macro / Other:
China industrial profits rose sharply in April, adding a positive macro note from abroad. Other market coverage highlighted mixed global index conditions, a strong quarter in corporate earnings momentum, and continued concentration in bullish performance.
Conclusion:
Primary support for index futures comes from record-high U.S. equities and broad AI-related strength. Positive earnings momentum, upgraded S&P 500 targets, and leadership from semiconductors reinforce the bullish backdrop.
Secondary pressures center on China regulation fears, Middle East instability, and oil-market uncertainty. Inflation risk, Fed commentary, and the elevated use of leverage add cross-currents that can intensify intraday volatility.
Market News Sentiment
Market News Articles: 39
- Positive: 48.72%
- Neutral: 30.77%
- Negative: 20.51%
Sentiment Summary: News flow is mildly positive overall, with 49% positive, 31% neutral, and 21% negative articles across 39 market news items.
Conclusion: The article mix shows a net positive tone with a sizable neutral share and a smaller negative portion.
GLD,Gold Articles: 10
- Positive: 50.00%
- Negative: 30.00%
- Neutral: 20.00%
Sentiment Summary: Gold-related coverage is moderately positive, with 50% positive, 30% negative, and 20% neutral articles across 10 items.
Conclusion: The news flow shows a positive bias in gold sentiment, with a meaningful negative share that keeps the overall tone mixed.
USO,Oil Articles: 12
- Negative: 50.00%
- Positive: 41.67%
- Neutral: 8.33%
Sentiment Summary: USO oil article coverage is mixed, with 50% negative, 42% positive, and 8% neutral sentiment across 12 articles.
Conclusion: The tone is slightly negative overall, with negative coverage outweighing positive coverage.
Market Data Snapshot
ETF Snapshot of major stock market ETFs, Mag7, and others as of: May 27, 2026 07:16
Top Movers & Losers
- IWM 290.51 Bullish 1.89% ▲
- TSLA 433.59 Bullish 1.78% ▲
- QQQ 730.28 Bullish 1.78% ▲
- AMZN 265.29 Bearish -0.39% ▼
- MSFT 416.03 Bearish -0.61% ▼
- USO 137.00 Bearish -2.78% ▼
Major Index ETFs: SPY, QQQ, DIA, IWM, IJH
- IWM 290.51 Bullish 1.89% ▲
- QQQ 730.28 Bullish 1.78% ▲
- IJH 74.65 Bullish 1.56% ▲
- SPY 750.59 Bullish 0.66% ▲
- DIA 505.25 Bearish -0.17% ▼
Mixed breadth across indices: IWM led as the most bullish mover at +1.89%, followed by QQQ at +1.78%, IJH at +1.56%, and SPY at +0.66%, while DIA was the most bearish mover and near-flat at -0.17%.
Mag 7 Stocks: AAPL, MSFT, GOOG, AMZN, META, NVDA, TSLA
- TSLA 433.59 Bullish 1.78% ▲
- GOOG 384.84 Bullish 1.44% ▲
- META 612.34 Bullish 0.34% ▲
- AAPL 308.33 Bearish -0.16% ▼
- NVDA 214.86 Bearish -0.22% ▼
- AMZN 265.29 Bearish -0.39% ▼
- MSFT 416.03 Bearish -0.61% ▼
Mag7 is Mixed: TSLA led the group with +1.78%, followed by GOOG at +1.44% and META at +0.34%, while AAPL was near-flat at -0.16%, NVDA at -0.22%, AMZN at -0.39%, and MSFT was the most bearish mover at -0.61%.
Cross-Market ETFs: TLT, GLD, USO, IBIT
- TLT 85.10 Bullish 0.50% ▲
- IBIT 42.99 Bullish 0.07% ▲
- GLD 414.00 Bullish 0.04% ▲
- USO 137.00 Bearish -2.78% ▼
Mixed cross-market tone: TLT is the most bullish mover at +0.50%, while USO is the most bearish mover at -2.78%. IBIT is marginally higher at +0.07% and GLD is near-flat at +0.04%.
ETF, Mag7, and Cross-Market ETF Insights
Overall Tone
Mixed-to-Bullish risk-on tone, with equities broadly positive while cross-market signals are more split and energy is clearly defensive.
Equity ETFs and Mag7:
Major index ETFs are mostly higher, led by IWM at +1.89%, QQQ at +1.78%, and IJH at +1.56%, while SPY is more restrained at +0.66%. DIA is marginally lower at -0.17%, suggesting some rotation rather than full uniform strength across the large-cap complex. Mag7 is selective, with TSLA at +1.78% and GOOG at +1.44% leading, while MSFT at -0.61% is the most bearish mover in the combined equity set.
Cross-Market ETFs:
Cross-market ETFs are mixed to slightly positive, with TLT up +0.50% and GLD essentially flat at +0.04%, while IBIT is also near flat at +0.07%. USO stands out as the clear outlier at -2.78%, separating energy weakness from the otherwise firmer risk backdrop. The most bullish cross-market mover is TLT at +0.50%, and the most bearish is USO at -2.78%.
Futures Indices – Higher Time Frame Analysis
Summary of the current state of US Indices Futures based on higher time-frame (HTF) technical analysis as of: 2026-05-27: 07:16 CT.
US Indices Futures
- ES YSFG/MSFG/WSFG all above F0%/NTZ, benchmarks bullishly stacked, UTrend pivots, highs near 7569.75, support at 7062.25 and prior swing bases.
- NQ YSFG/MSFG/WSFG above F0%, benchmarks rising and aligned, UTrend pivots, fresh highs near 30297, support at 27749 and 22961.50.
- YM YSFG/MSFG above F0%, WSFG below midpoint, benchmarks bullishly stacked, pivots UTrend, resistance near 51209, support around 45052 and prior consolidation.
- EMD YSFG/MSFG/WSFG above F0%/NTZ, benchmarks rising, UTrend pivots, highs near 3767.3, support at 2572.8 and prior recovery lows.
- RTY YSFG/MSFG/WSFG above F0%, benchmarks bullishly stacked, UTrend pivots, highs near 2950, support from breakout zones beneath current price.
- FDAX YSFG/MSFG/WSFG above midpoint, benchmarks bullishly stacked, UTrend pivots, highs near 25494, resistance 25656 and 25854, support from 25494 lower into 22057.
Overall State
- Short-Term: Bullish
- Intermediate-Term: Bullish
- Long-Term: Bullish
Conclusion
HTF structure across ES, NQ, EMD, RTY, and FDAX remains aligned with upward session-fib bias, bullish benchmark stacking, and UTrend swing pivots. YM is the main mixed component, with weekly short-term fib position below midpoint while monthly and yearly structure remain constructive. Across the index set, price is holding above YSFG/MSFG/WSFG reference zones where reported, with higher highs, higher lows, and breakout continuation above prior swing levels defining the dominant correlation. Key reference areas are the ES 7569.75 high with 7062.25 support, NQ 30297 with 27749 below, YM 51209 resistance with 45052 support, EMD 3767.3 with 2572.8 support, RTY 2950 with layered breakout support, and FDAX 25494 with 25656 and 25854 overhead.
Note: Intra-day counter-trend pullbacks or retracements may occur, HTF is context for informational usage and market structure. Glossary: Session Fib Grids periods of YSFG:’Yearly’, MSFG:’Monthly’, WSFG:’Weekly’
For full details visit: AlphaWebTrader Technicals
ES Daily View
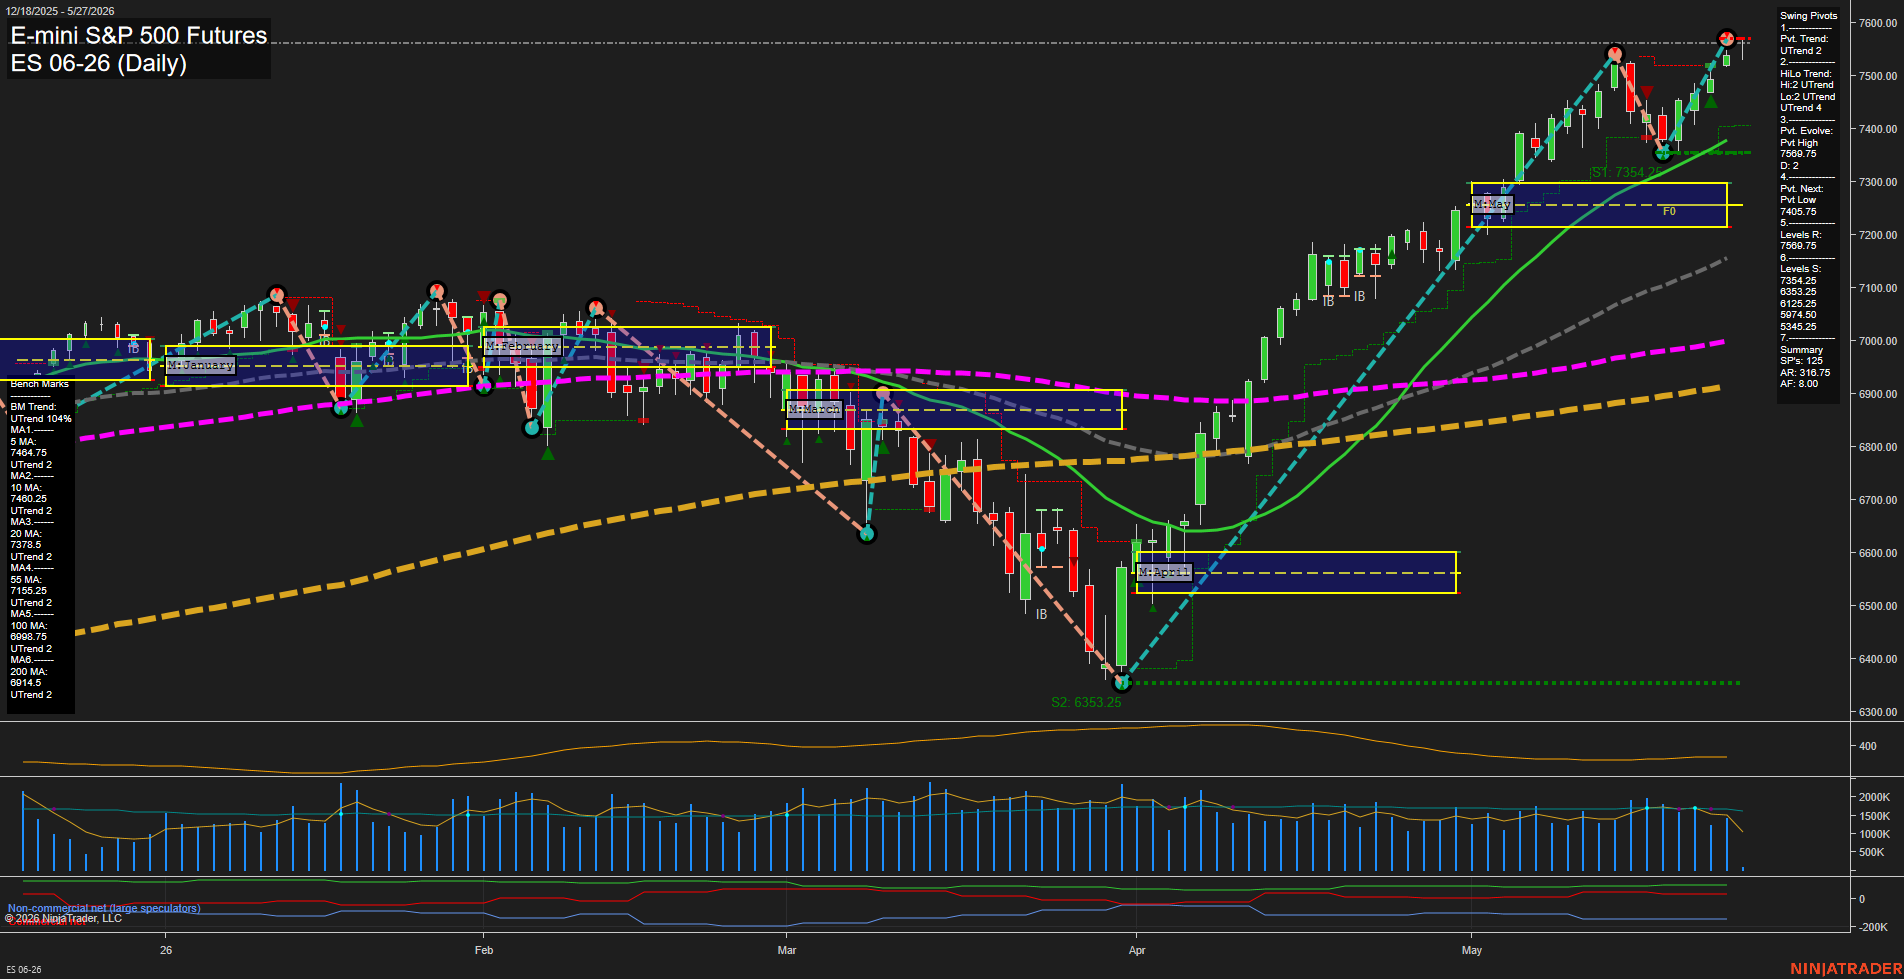
Overall Rating
- Short-Term: Bullish
- Intermediate-Term: Bullish
- Long-Term: Bullish.
Key Insights Summary
The daily structure remains firmly trend-positive, with price pushing above the prior swing high at 7569.75 and holding well above all benchmark moving averages. The benchmark stack is fully aligned in bullish order, with the 5/10-day averages above the 20, 55, 100, and 200-day measures, confirming strong trend continuation across short, intermediate, and long horizons. Swing pivot trend reads UTrend on both the pivot and hi/lo metrics, while the recent advance off the April low shows a clean rally sequence with higher highs and higher lows. The monthly and weekly session fib grids both keep price above the f0%/NTZ line, reinforcing upward bias. Recent trade signals also remain consistent with upside continuation, reflecting strength after the May breakout and follow-through toward the upper end of the current swing range.
View charts on: AlphaWebTrader HTF Charts
NQ Daily View
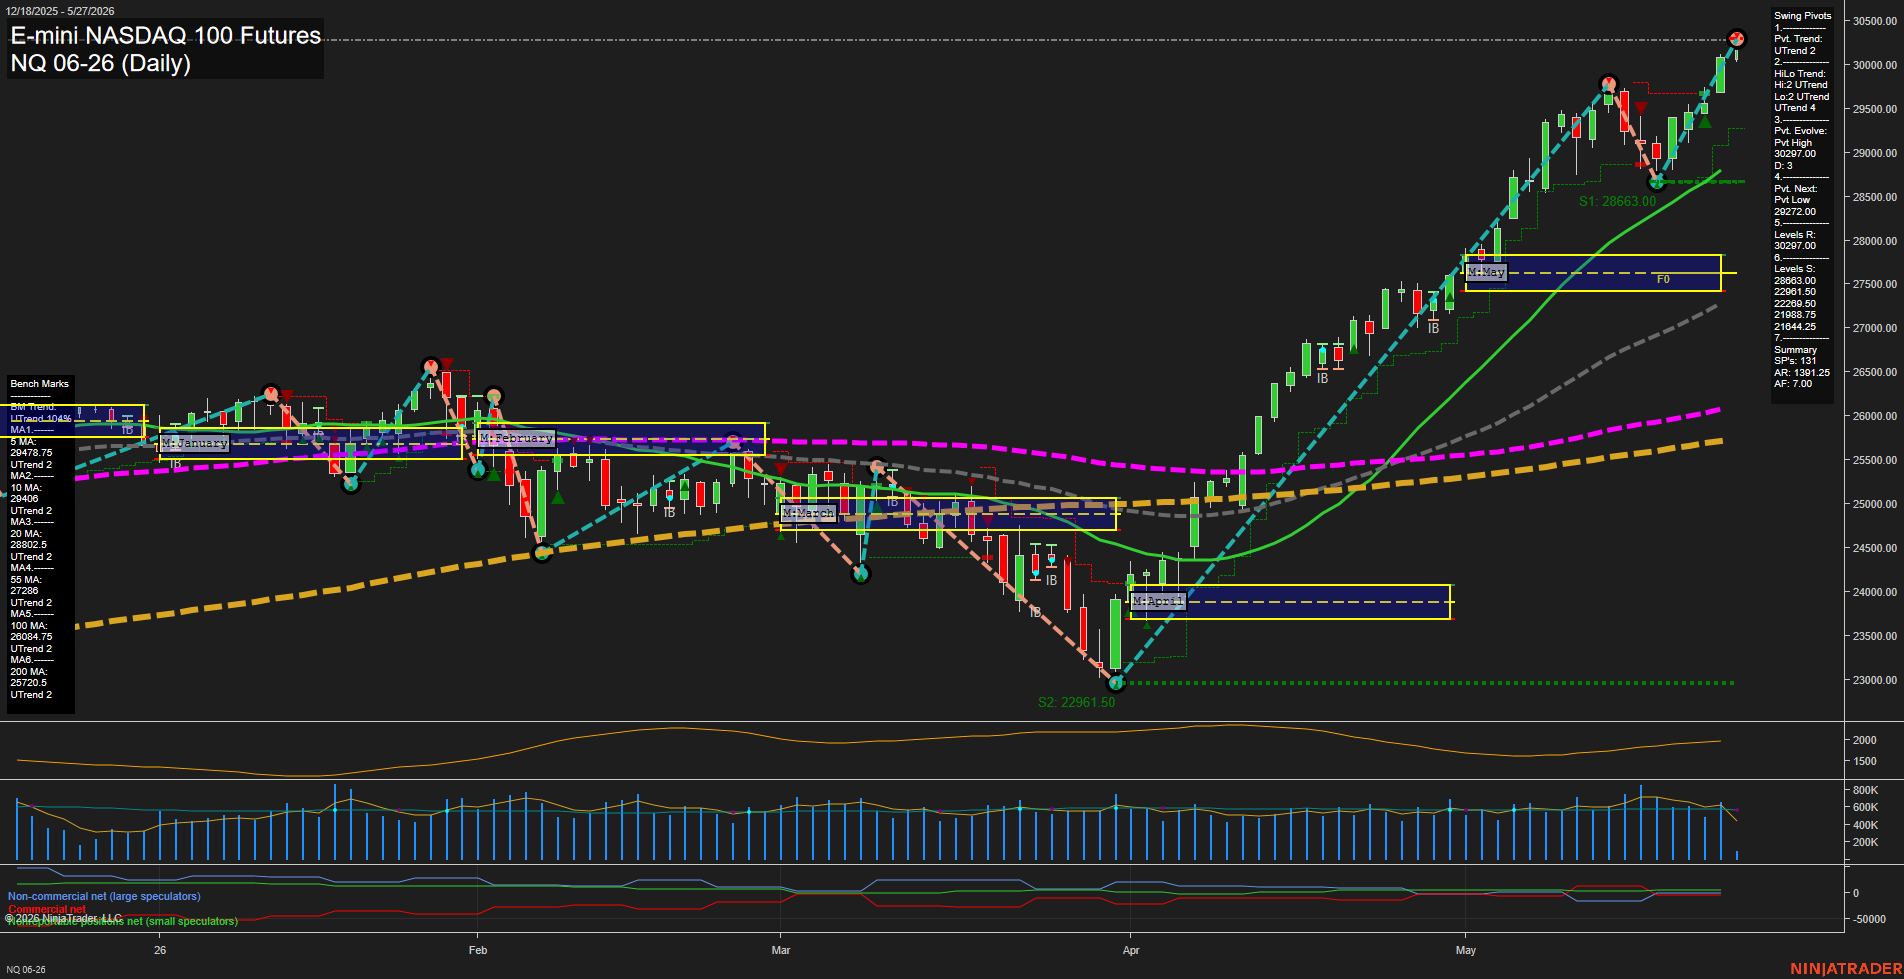
Overall Rating
- Short-Term: Bullish
- Intermediate-Term: Bullish
- Long-Term: Bullish.
Key Insights Summary
Strong upside continuation is dominant across all time frames, with price pressing into fresh highs above the monthly F0%/NTZ zone and holding well above the full benchmark stack. Swing pivots remain in UTrend, and the latest structure shows an impulsive breakout leg following a sharp V-shaped recovery from the April base near 22961.50. The benchmark averages are all aligned upward, confirming sustained trend expansion, while the elevated ATR and strong volume profile reflect an active momentum phase rather than a quiet consolidation. The current tape is characterized by higher highs, higher lows, and persistent trend continuation after brief pullback/retest behavior.
View charts on: AlphaWebTrader HTF Charts
CL Daily View
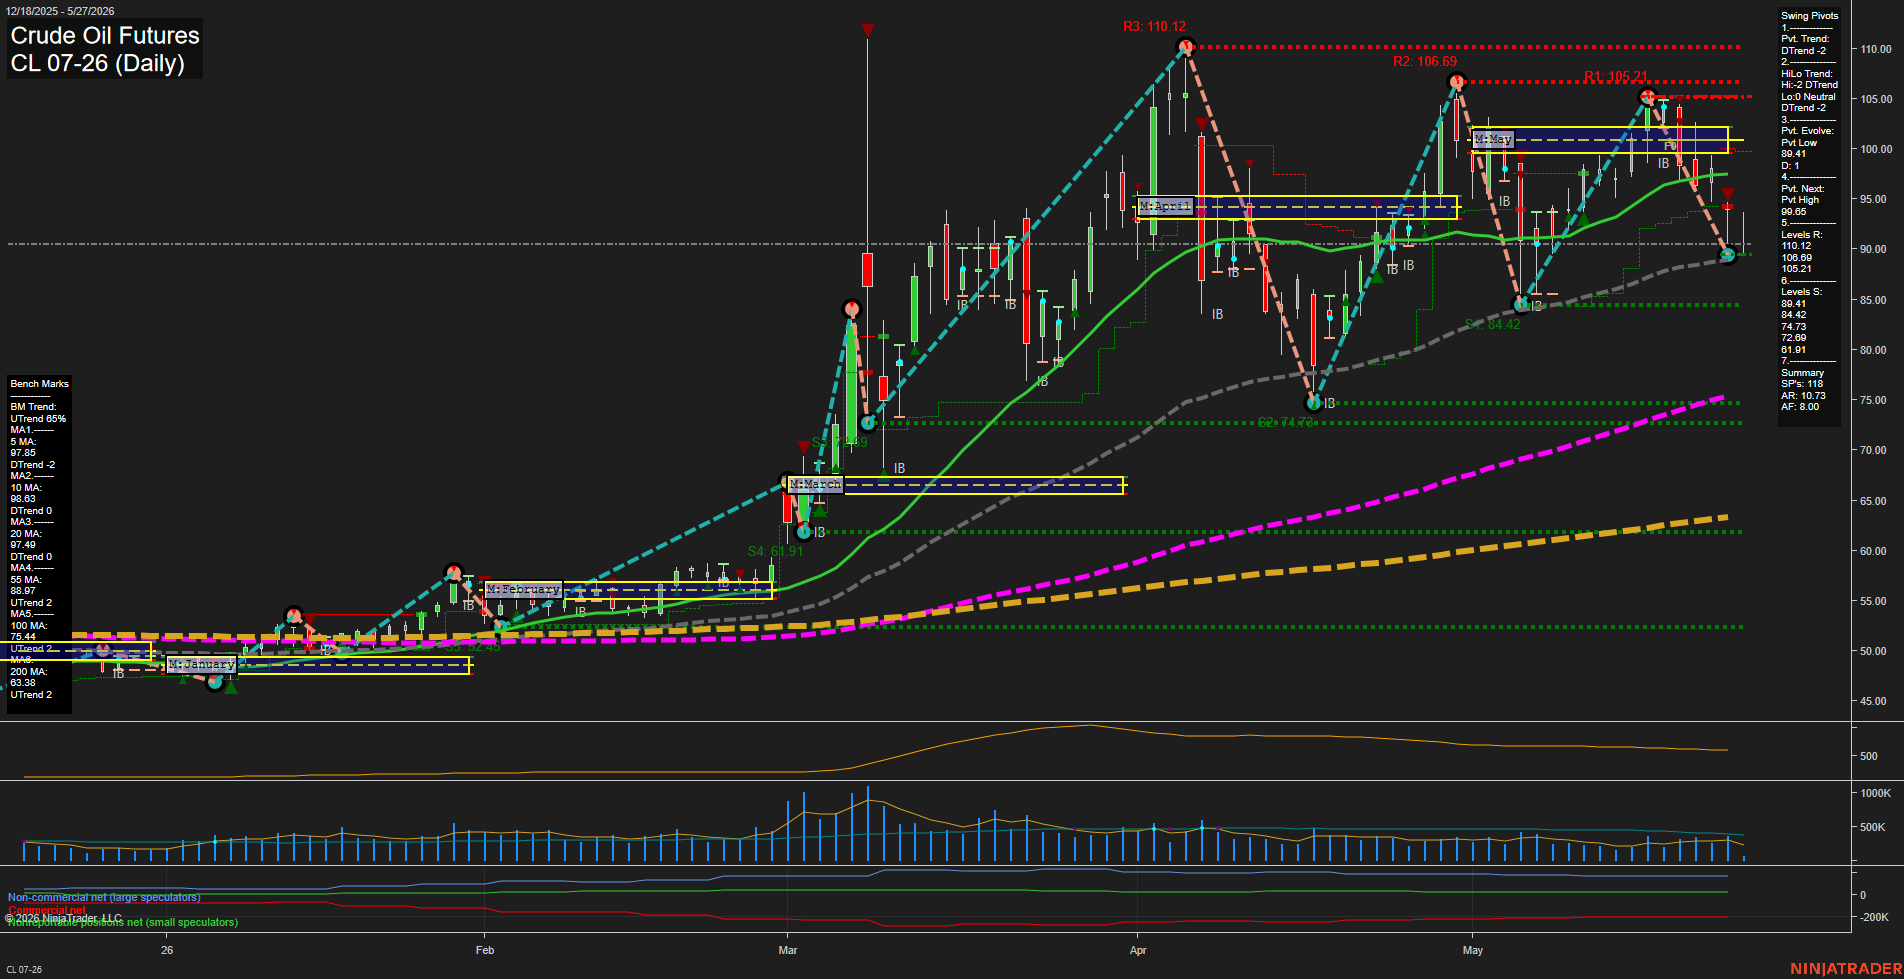
Overall Rating
- Short-Term: Bearish
- Intermediate-Term: Bearish
- Long-Term: Bullish.
Key Insights Summary
Crude oil is in a broad two-speed structure: the short and intermediate frames remain pressured with price trading below both the weekly and monthly fib grids, while the yearly frame is still constructive because price remains above the annual NTZ. The daily swing pivot state is DTrend with lower pivot structure still active, and the benchmark alignment shows near-term averages rolling lower even as the 55-, 100-, and 200-day averages stay higher in an uptrend sequence. Recent price action has been large and fast, with sharp rallies and equally sharp retracements creating a choppy swing environment marked by inside bars, rejection wicks, and repeated tests of nearby resistance and support. The most recent trade signals reinforce the short bias in the near and intermediate horizons, while the higher-timeframe trend remains upward unless the longer support structure gives way.
View charts on: AlphaWebTrader HTF Charts
GC Daily View
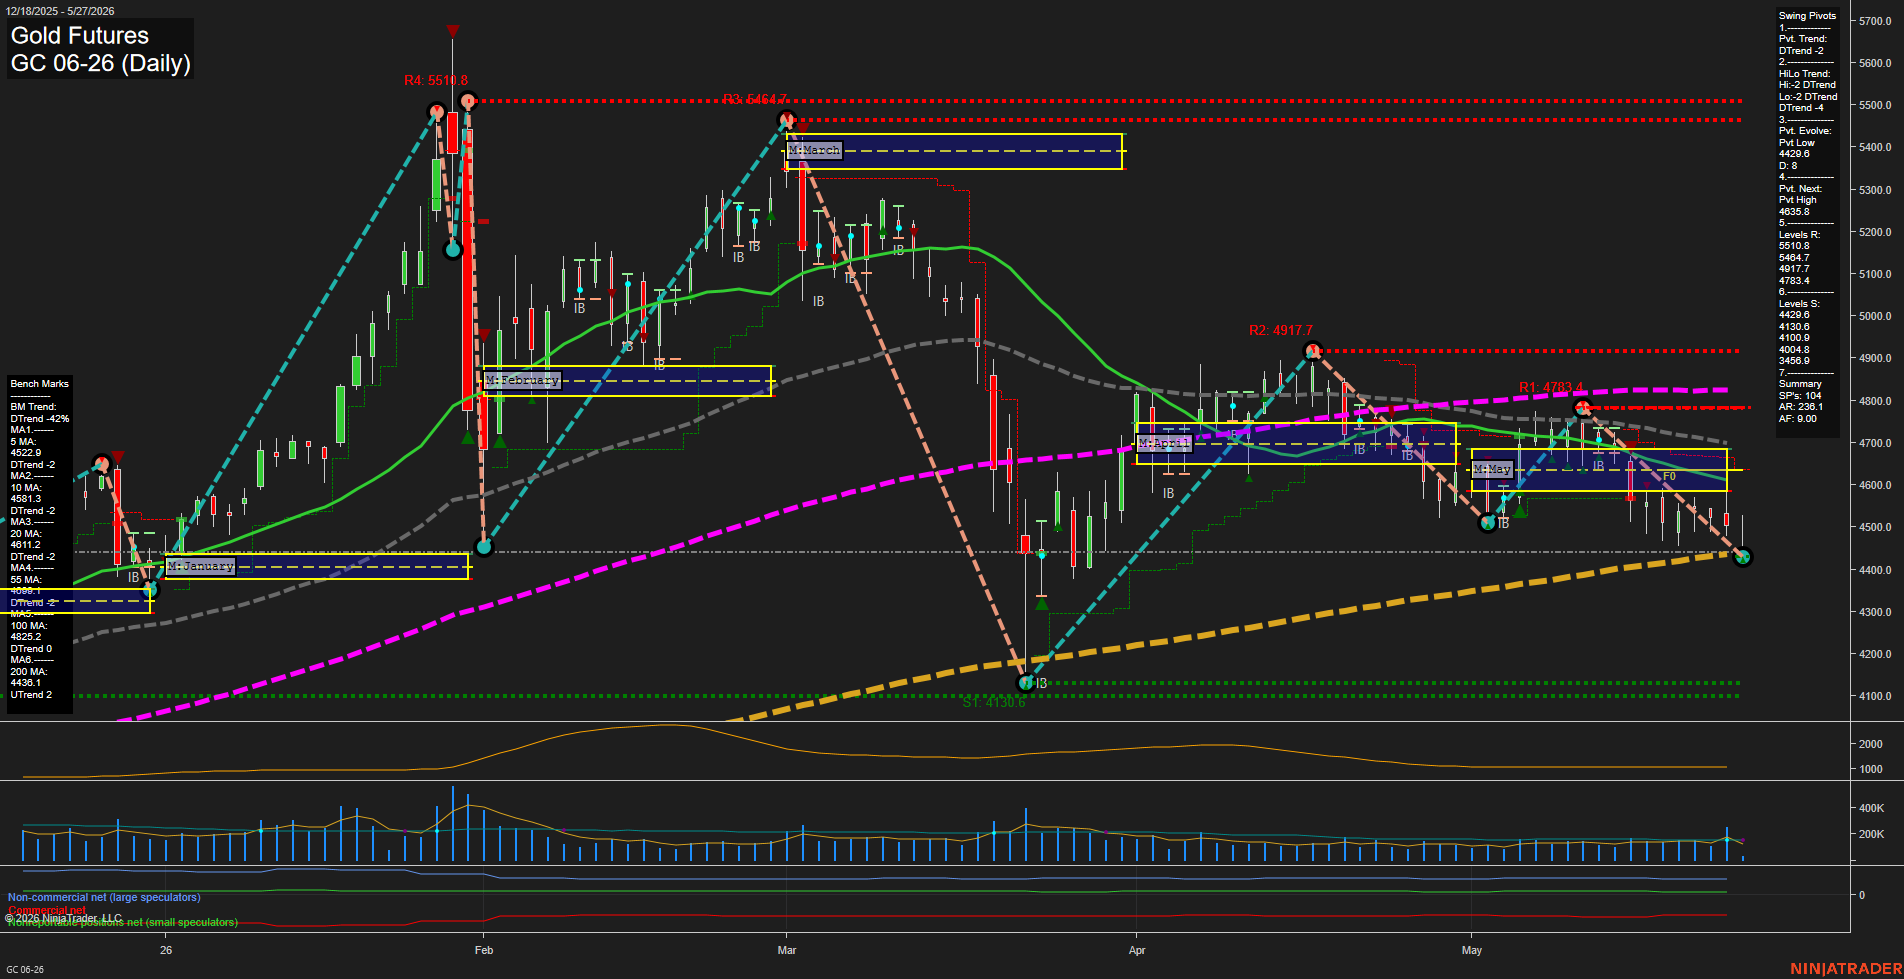
Overall Rating
- Short-Term: Bearish
- Intermediate-Term: Bearish
- Long-Term: Bearish.
Key Insights Summary
Gold futures are in a broad daily down phase with price pressing below the weekly, monthly, and yearly F0%/NTZ centers, confirming persistent weakness across multiple swing horizons. The current bar structure shows expanding downside momentum, with price trading under the 5, 10, 20, and 55-day benchmarks and failing to reclaim the 4500-4600 area that now acts as overhead supply. Swing pivot structure remains in DTrend, and the most recent pivot sequence continues to define lower highs and lower lows, with 4429.6 standing as the active pivot low and 4685.8 as the next opposing pivot high. The recent signal cluster is aligned with downside continuation, while the only notable longer-term counterweight is the 200-day benchmark sitting near the current market, reflecting a mixed but still pressure-heavy backdrop.
View charts on: AlphaWebTrader HTF Charts