
U.S. stocks ended the week at record highs as AI strength, easing oil prices, and lower Iran tensions outweighed mixed Fed and macro headlines.
Fundamentals: U.S. equities closed the week at record levels, led by AI-related strength, solid earnings, and easing oil prices. Lower geopolitical stress around Iran supported risk sentiment, while gold held firm on dip buying and crude extended a steep monthly decline. Fed comments and upcoming jobs data remained in focus.
Technicals: U.S. markets finished with a mixed close in the ETF leaderboard, as MSFT, GLD and DIA led gains while TSLA, NVDA and GOOG finished lower. Broader futures analysis for ES, NQ, YM, RTY, EMD and FDAX showed bullish short-, intermediate- and long-term structures, with prices holding above key fib midlines and benchmark moving averages.
After Market Close daily snapshot: market news summary and sentiment, major ETFs, Magnificent 7 analysis, Indices Futures Higher Time Frame Analysis, and E-mini S&P500, Nasdaq 100, NYMEX Crude, Gold Futures Daily Chart analysis.
As of: May 29, 2026 05:00 CT
Market News Summary:
U.S. equities finished the week at record levels as AI strength offset renewed macro and geopolitical cross-currents, while oil extended a sharp monthly drop and gold firmed on dips.
Primary Drivers & Risks:
- Primary Driver: AI-led equity strength
- Primary Risk: Iran deal and oil swings
Tone:
Risk-on in equities, with energy and policy headlines adding volatility.
Stock Market / ETFs / Indices:
U.S. stocks closed at record highs, with the S&P 500, Nasdaq Composite, and Dow all posting strong weekly and monthly gains. Gains were driven by AI optimism, strong earnings, easing oil prices, and reduced geopolitical stress.
Geopolitical:
Markets reacted to U.S.-Iran ceasefire and deal chatter, with President Trump saying a final determination on Iran is coming. Easing tensions in the Middle East supported stocks and pressured oil prices.
Oil / Energy:
Crude prices fell sharply, with Brent and U.S. oil down about 20% in May. Headlines pointed to U.S.-Iran peace hopes, while other reports noted supply disruptions, low inventories, and steady U.S. crude production at 13.7 million barrels per day.
Gold / Metals:
Gold rebounded as buyers defended dips, aided by weaker oil and a softer dollar. Later reports pointed to gold and silver trading with focus on U.S. labor data and Federal Reserve policy.
Fed / Financials:
San Francisco Fed President Mary Daly pushed back on urgency around rate cuts or hikes, while upcoming U.S. jobs and ISM data stayed in focus for rate expectations. Elevated long-term yields remained tied to higher oil prices and Fed caution.
Macro / Other:
Wall Street regulator headlines included a proposal to scrap Biden-era climate disclosure rules. U.S. and Mexico also concluded an initial trade round covering autos, steel, aluminum, and economic security.
Conclusion:
Primary drivers were AI-related equity leadership, easing oil prices, and lower geopolitical stress around Iran. Those factors supported record closes in U.S. indices and broad monthly gains.
Secondary drivers included mixed Fed commentary, upcoming labor and ISM data, and ongoing cross-currents from energy supply risks. Gold held firm on dip buying, while oil volatility remained elevated amid conflicting supply and geopolitics narratives.
Market News Sentiment
Market News Articles: 32
- Positive: 53.12%
- Neutral: 28.12%
- Negative: 18.75%
Sentiment Summary: Market news is moderately positive, with 53% positive articles, 28% neutral articles, and 19% negative articles across 32 stories.
Conclusion: The overall tone is constructive, with positive coverage exceeding neutral and negative coverage.
GLD,Gold Articles: 9
- Positive: 55.56%
- Neutral: 33.33%
- Negative: 11.11%
Sentiment Summary: Gold-related coverage is mostly positive at 56%, with 33% neutral and 11% negative across 9 articles.
Conclusion: The news tone for GLD and gold is moderately favorable, with positive articles exceeding neutral and negative coverage.
USO,Oil Articles: 15
- Negative: 53.33%
- Positive: 40.00%
- Neutral: 6.67%
Sentiment Summary: USO and oil news sentiment is slightly negative, with 53% negative, 40% positive, and 7% neutral coverage across 15 articles.
Conclusion: The article mix reflects a mildly bearish tone in oil-related headlines, with negative coverage outweighing positive coverage.
Market Data Snapshot
ETF Snapshot of major stock market ETFs, Mag7, and others as of: May 29, 2026 05:00
Top Movers & Losers
- MSFT 450.24 Bullish 5.45% ▲
- GLD 417.12 Bullish 1.05% ▲
- DIA 510.78 Bullish 0.74% ▲
- TSLA 435.79 Bearish -1.43% ▼
- NVDA 211.14 Bearish -1.45% ▼
- GOOG 376.43 Bearish -2.51% ▼
Major Index ETFs: SPY, QQQ, DIA, IWM, IJH
- DIA 510.78 Bullish 0.74% ▲
- QQQ 738.31 Bullish 0.37% ▲
- SPY 756.48 Bullish 0.25% ▲
- IJH 74.60 Bullish 0.20% ▲
- IWM 290.43 Bearish -0.55% ▼
Mixed tape across major index ETFs: DIA led the group as the most bullish mover at +0.74%, while IWM was the most bearish mover at -0.55%. QQQ +0.37%, SPY +0.25%, and IJH +0.20% were modestly positive.
Mag 7 Stocks: AAPL, MSFT, GOOG, AMZN, META, NVDA, TSLA
- MSFT 450.24 Bullish 5.45% ▲
- AAPL 312.06 Bearish -0.14% ▼
- META 632.51 Bearish -0.44% ▼
- AMZN 270.64 Bearish -1.23% ▼
- TSLA 435.79 Bearish -1.43% ▼
- NVDA 211.14 Bearish -1.45% ▼
- GOOG 376.43 Bearish -2.51% ▼
Mixed Mag7 tone: MSFT led as the most bullish mover at +5.45%, while GOOG was the most bearish mover at -2.51%. AAPL was near-flat at -0.14%, with META at -0.44%, AMZN at -1.23%, TSLA at -1.43%, and NVDA at -1.45%.
Cross-Market ETFs: TLT, GLD, USO, IBIT
- GLD 417.12 Bullish 1.05% ▲
- IBIT 41.63 Bullish 0.17% ▲
- TLT 85.76 Bullish 0.02% ▲
- USO 129.09 Bearish -1.29% ▼
Mixed tone: GLD led the group as the most bullish mover at +1.05%, while USO was the most bearish mover at -1.29%. IBIT was marginally bullish at +0.17%, and TLT was essentially flat at +0.02%.
ETF, Mag7, and Cross-Market ETF Insights
Overall Tone
Mixed to mildly Bullish, with the major index ETFs and select large caps holding a constructive tone while leadership remains selective and several high-beta names are clearly Mixed to Bearish.
Equity ETFs and Mag7:
Major index ETFs were broadly aligned on the Bullish side, led by DIA +0.74%, QQQ +0.37%, SPY +0.25%, and IJH +0.20%, while IWM was the main laggard at -0.55%. In Mag7, MSFT stood out as the strongest mover at +5.45%, offset by Bearish moves in GOOG -2.51%, NVDA -1.45%, TSLA -1.43%, AMZN -1.23%, META -0.44%, and AAPL -0.14%. The mix suggests the index complex is holding up better than the growth cohort, with the most bullish mover MSFT +5.45% and the most bearish mover GOOG -2.51%.
Cross-Market ETFs:
Cross-market ETFs were mostly Mixed, with GLD the strongest at +1.05%, TLT essentially flat at +0.02%, IBIT slightly higher at +0.17%, and USO the clear laggard at -1.29%. Relative to equities, the tone shows some hedging demand in GLD alongside a soft energy tape in USO, while TLT and IBIT were near-flat to mildly Bullish. The most bullish mover was GLD +1.05% and the most bearish mover was USO -1.29%.
Futures Indices – Higher Time Frame Analysis
Summary of the current state of US Indices Futures based on higher time-frame (HTF) technical analysis as of: 2026-05-29: 17:00 CT.
US Indices Futures
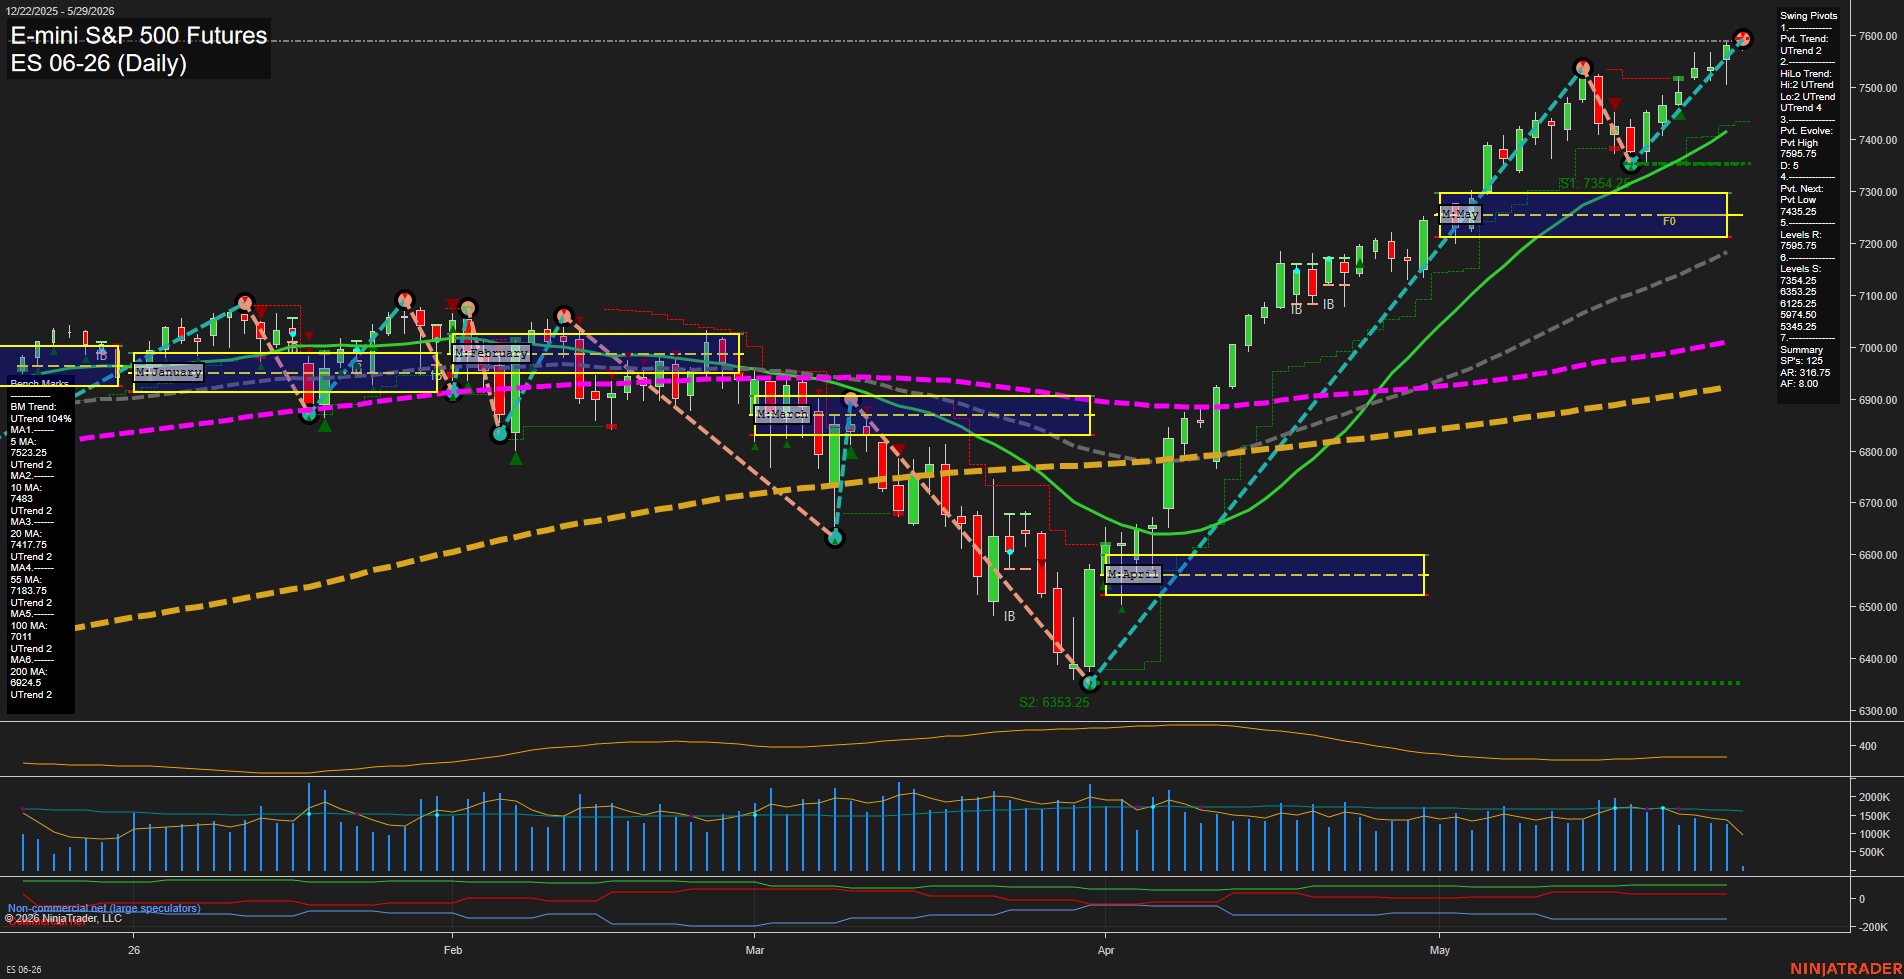
- ES Weekly/Daily Bullish, above YSFG/MSFG/WSFG midlines, bullish MA stack, swing pivots UTrend; resistance 7595.75, support from prior consolidation and 6353.25.
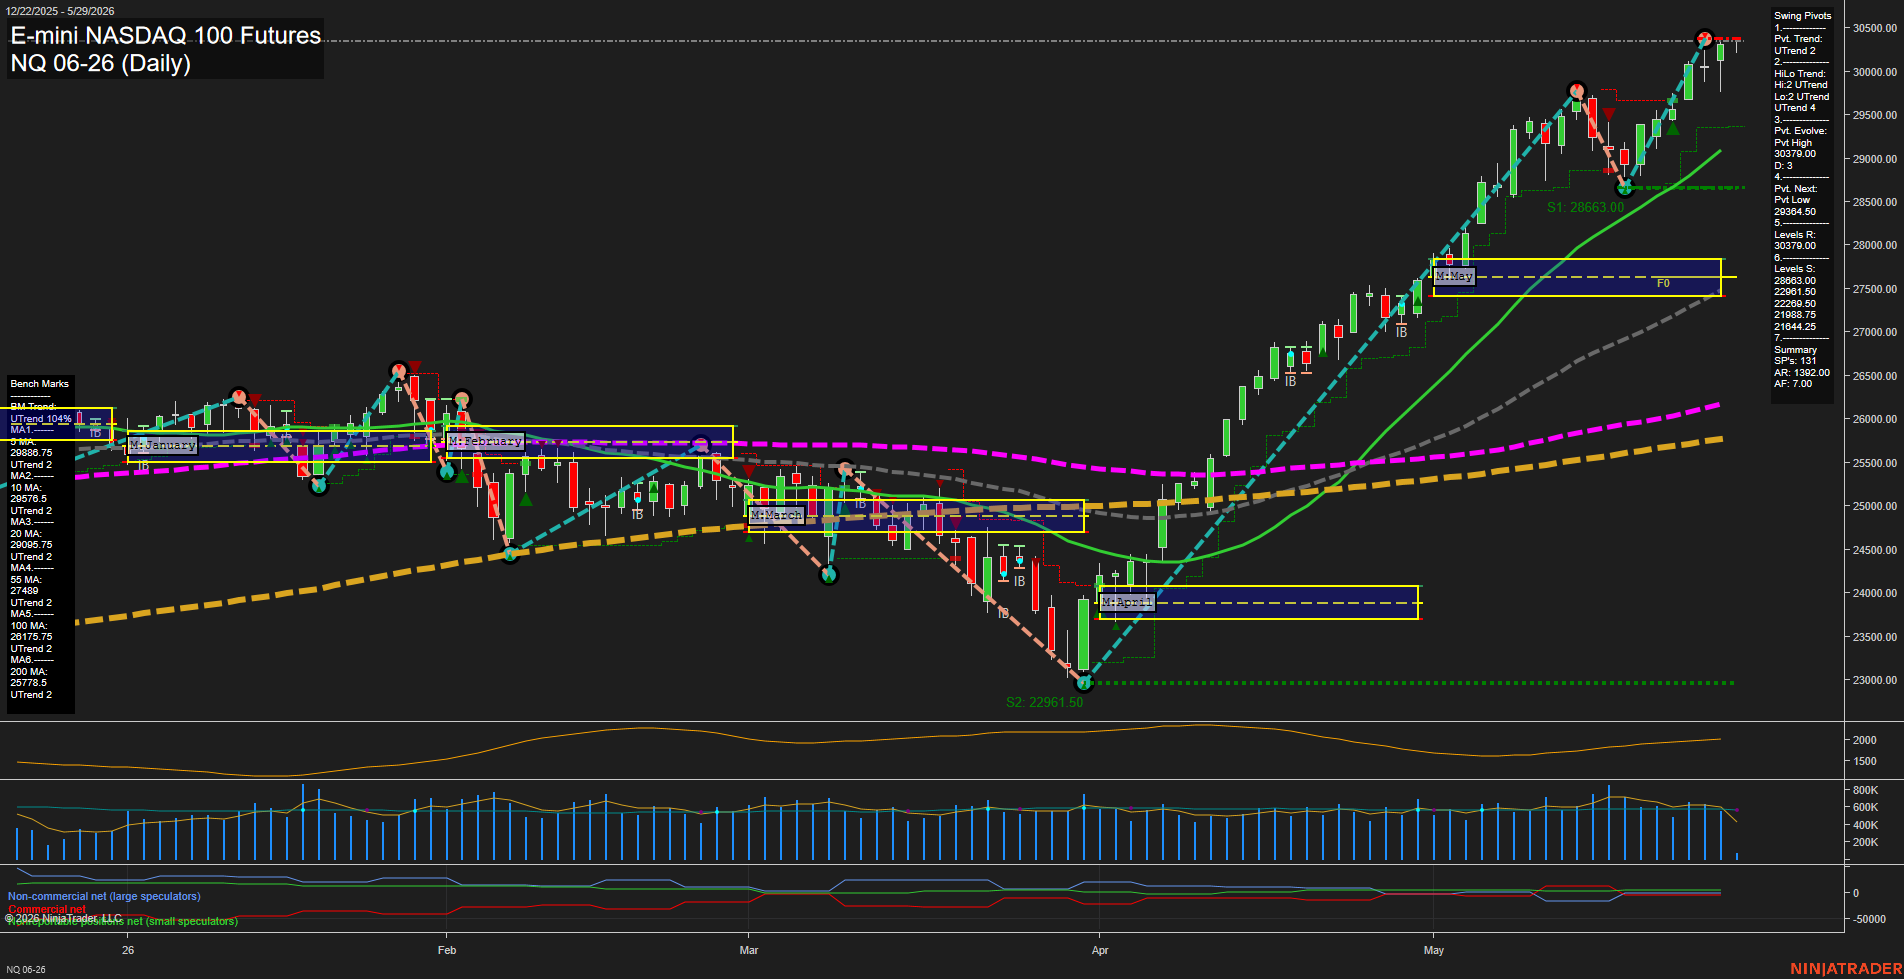
- NQ Weekly/Daily Bullish, above YSFG/MSFG/WSFG midlines, bullish MA stack, UTrend pivots; resistance near 30379, next swing support 29364.50 then 27828.
- YM Weekly/Daily Bullish, above YSFG/MSFG/WSFG midlines, rising MA stack, UTrend pivots; resistance near 51209, layered support lower from spring recovery zone.
- EMD Weekly/Daily Bullish, above YSFG/MSFG/WSFG midlines, bullish MA alignment, higher-high continuation; resistance 3760-3767, support layered through mid-3500s to low-3100s.
- RTY Weekly/Daily Bullish, above YSFG/MSFG/WSFG midlines, bullish MA stack, UTrend pivots; resistance near 2952, support at 2728.4 and 2726.1.
- FDAX Weekly Bullish, Daily Neutral/Intermediate Bullish, above YSFG/MSFG/WSFG midlines; resistance 25494, 25666, 25854, support 24818, 23674, 22124.
Overall State
- Short-Term: Bullish
- Intermediate-Term: Bullish
- Long-Term: Bullish
Conclusion
US indices futures remain broadly aligned to the upside across YSFG, MSFG, and WSFG structures. ES, NQ, YM, EMD, and RTY are all holding above their fib-grid midlines with bullish benchmark moving-average stacks and UTrend pivot sequences, confirming higher highs and higher lows. FDAX is also structurally upward on HTF, though its daily posture is mixed beneath the 5-day while still above higher averages. Across the group, resistance is concentrated at recent swing highs, while prior consolidation and recovery zones define support beneath price.
Note: Intra-day counter-trend pullbacks or retracements may occur, HTF is context for informational usage and market structure. Glossary: Session Fib Grids periods of YSFG:’Yearly’, MSFG:’Monthly’, WSFG:’Weekly’
For full details visit: AlphaWebTrader Technicals
ES Daily View
Overall Rating
- Short-Term: Bullish
- Intermediate-Term: Bullish
- Long-Term: Bullish.
Key Insights Summary
The daily structure remains strongly bullish with price pressing into fresh highs near the 7595.75 pivot resistance after a sharp May reversal from the 6353.25 swing low. Short-term swing pivots are in UTrend and the HiLo trend is also UTrend, confirming a higher-high, higher-low sequence with momentum expanding fast. Price is holding above the May MSFG midpoint/bias zone and remains above the weekly and yearly fib frameworks, which keeps the broader trend aligned to the upside. All benchmark moving averages are stacked in bullish order and trending higher, supporting a persistent trend regime rather than a mean-reverting or choppy backdrop. Recent price action shows strong continuation out of the April base, with prior consolidation zones now acting as support beneath the market.
View charts on: AlphaWebTrader HTF Charts
NQ Daily View
Overall Rating
- Short-Term: Bullish
- Intermediate-Term: Bullish
- Long-Term: Bullish.
Key Insights Summary
The daily chart remains in a strong upside expansion phase, with price pressing into fresh highs above all benchmark moving averages and holding well above the monthly and yearly session fib grids. Short-term structure is firmly in UTrend, and the swing pivot sequence continues to favor higher highs and higher lows, with the latest pivot high at 30379 and the next downside reference at 29364.50. The benchmark stack is fully bullish, showing a clear trend hierarchy from the 5-day through the 200-day average, which supports persistent trend continuation behavior. Recent price action shows a powerful rally leg with large daily bars and fast momentum, following a sharp V-shaped recovery from the April low area near 22961.50 and extending through the May consolidation zone into breakout territory. The current tape reflects strong trend continuation with overhead resistance now concentrated near the prior swing high zone, while the broader structure remains constructive across weekly, monthly, and yearly session fib measures.
View charts on: AlphaWebTrader HTF Charts
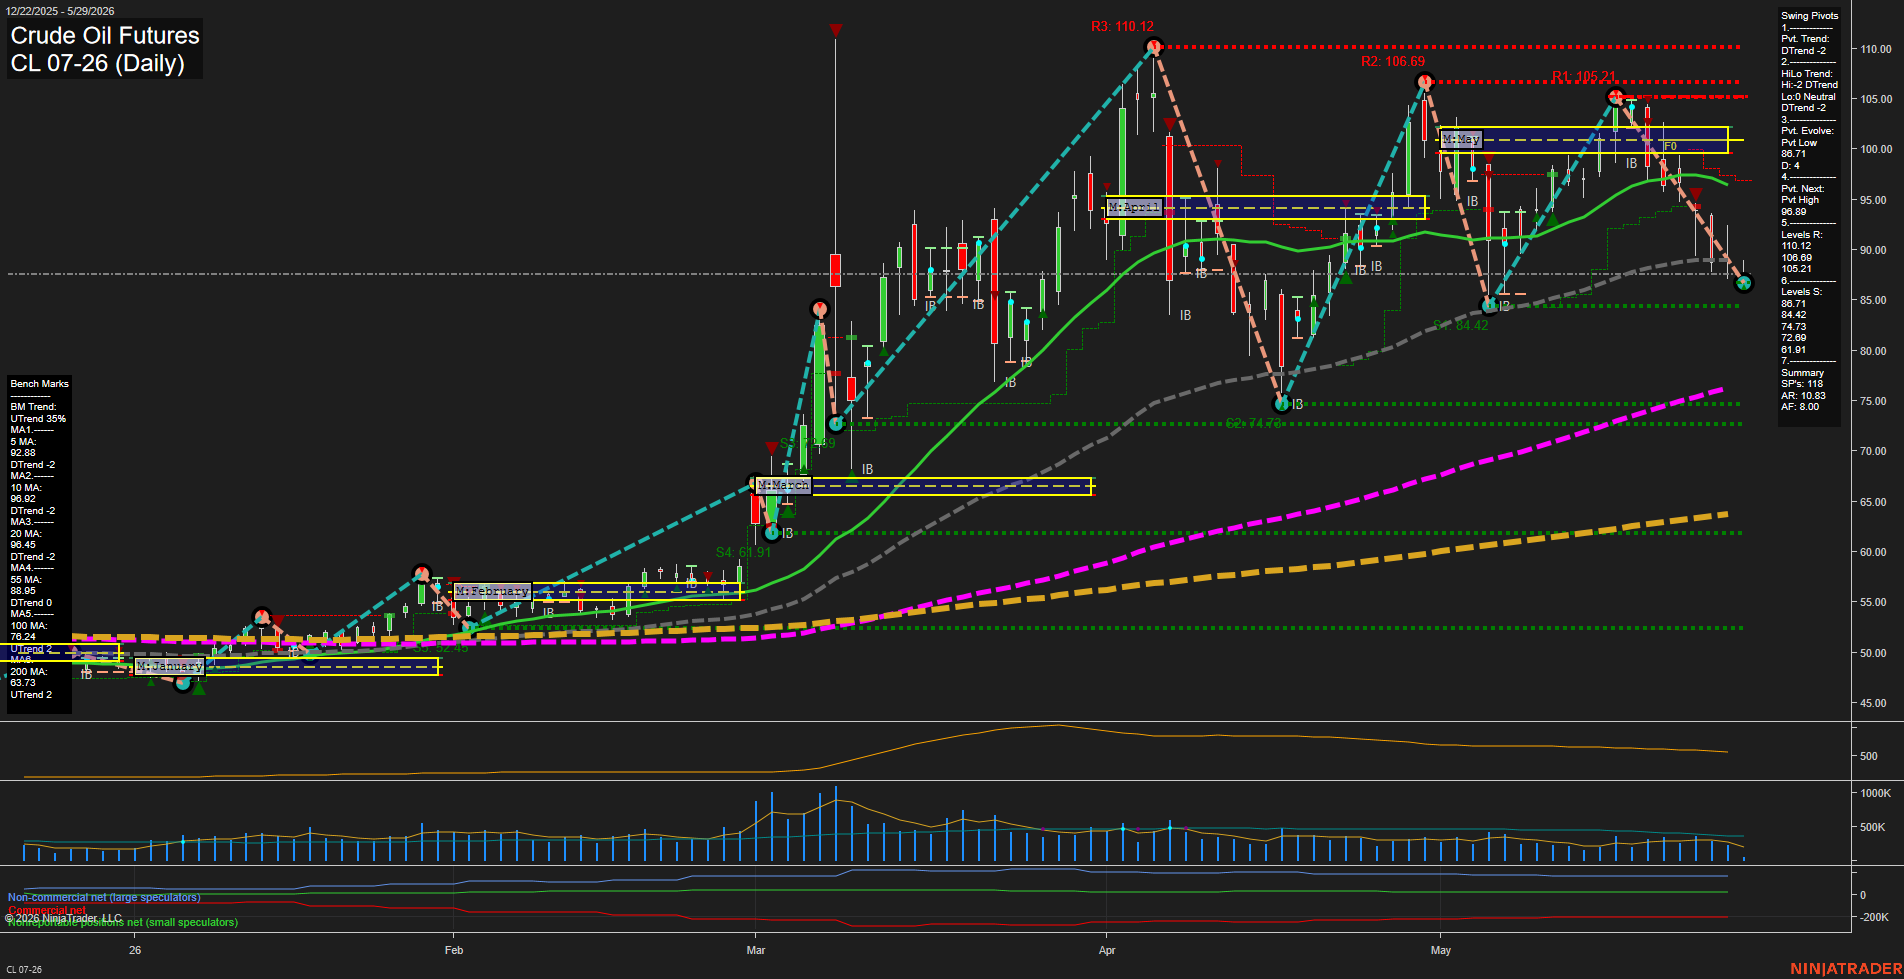
CL Daily View
Overall Rating
- Short-Term: Bearish
- Intermediate-Term: Bearish
- Long-Term: Bullish.
Key Insights Summary
Crude oil is in a sharp daily selloff from the early-May swing high, with price back down into the mid-80s after failing near the 105-110 resistance band and then losing the monthly/weekly fib structure. The short-term pivot trend and Hi/Lo trend are both bearish, and the market is trading below the 5, 10, 20, and 55-day benchmarks, confirming downside control on the active swing. The longer-term structure remains constructive because the 100-day and 200-day averages are still rising and price remains well above those major trend references, so the larger backdrop is still upward even as the current swing has rolled over. The recent signal sequence also reflects that deterioration, with short signals printing at the weekly, monthly, and long-cycle levels. Overall, the chart shows a strong corrective leg within a broader uptrend, with volatility elevated and momentum expanding to the downside.
View charts on: AlphaWebTrader HTF Charts
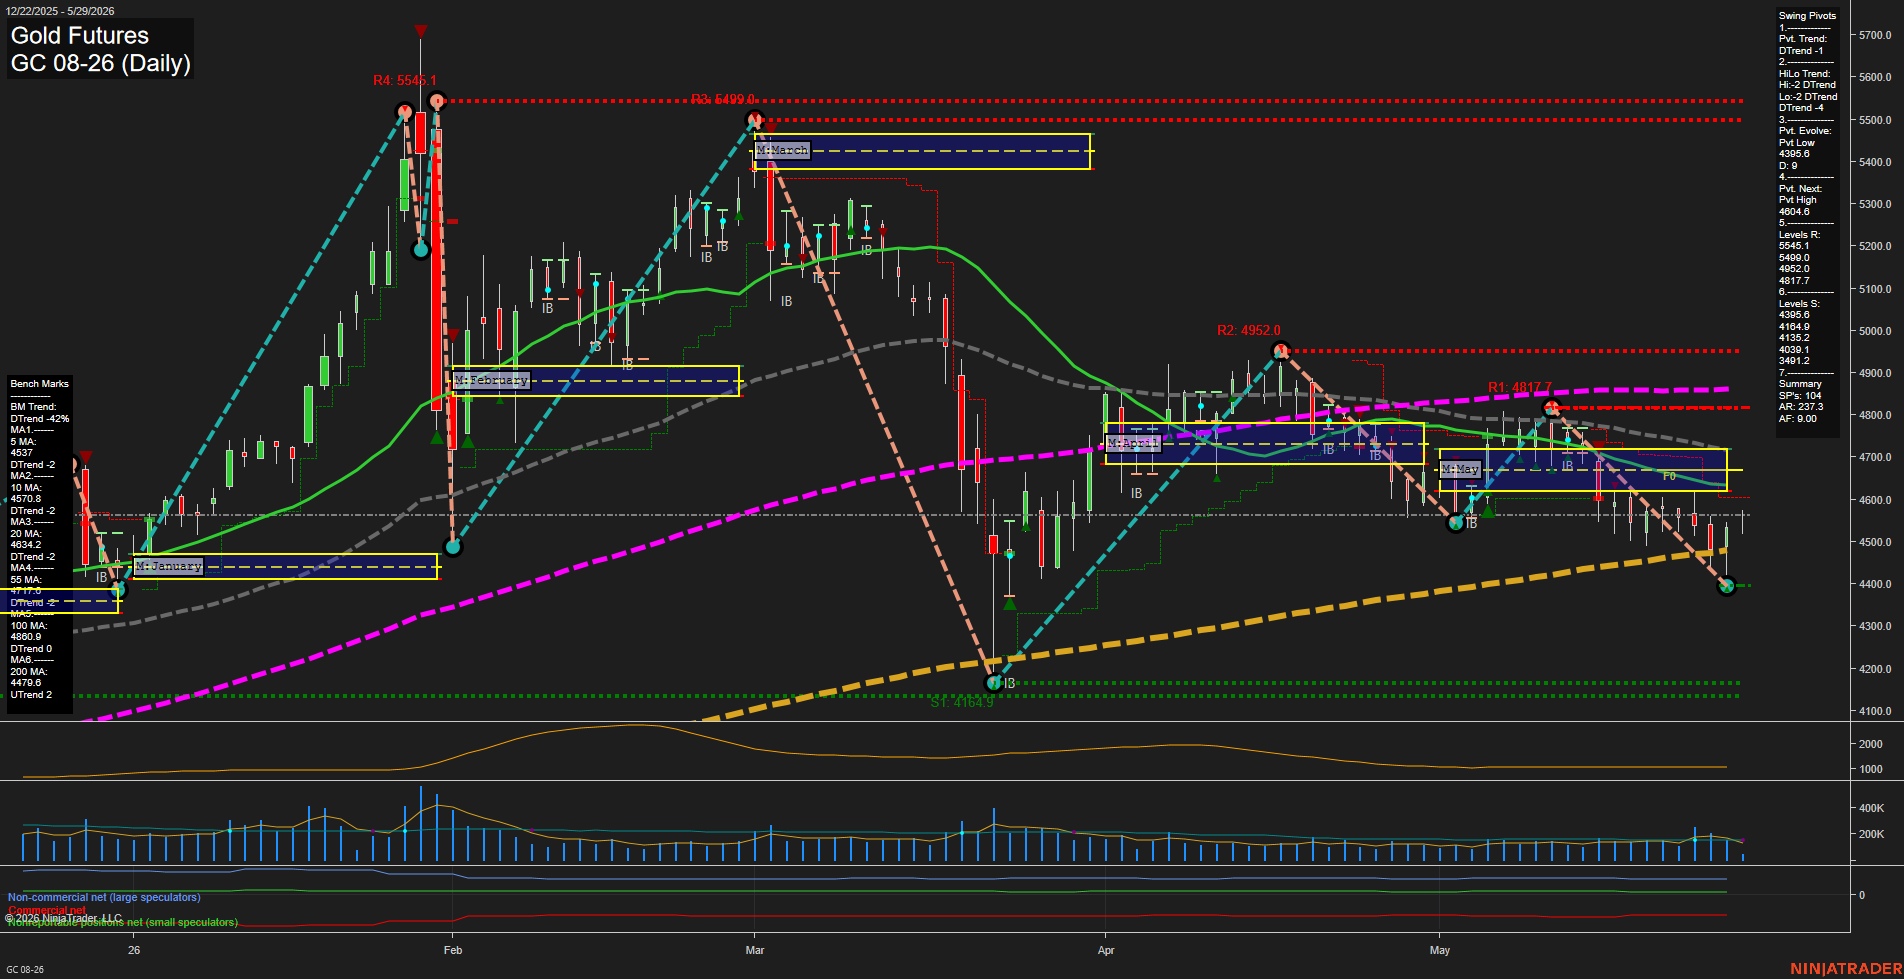
GC Daily View
Overall Rating
- Short-Term: Bearish
- Intermediate-Term: Bearish
- Long-Term: Neutral.
Key Insights Summary
Gold futures are trading in a fast downside swing with price pressed below the short- and intermediate-term benchmark averages, while the daily pivot structure remains in DTrend and the next pivot focus is a higher swing high near 4604.6. The weekly fib grid still holds an upward bias, but the monthly and yearly session grids remain below their f0% zones with down trends, keeping the larger backdrop corrective to bearish. Recent price action shows a sharp retracement from the 4800-4950 resistance zone toward the 4400 area, with the current bar sitting near support derived from the latest pivot low region and the 200-day benchmark. The setup reflects a volatile pullback inside a broader two-sided sequence, with overhead resistance clustered at 4817.7, 4952.0, and 5499.0, while downside reference levels remain layered at 4395.6, 4164.9, and 4039.1.
View charts on: AlphaWebTrader HTF Charts